Review
. 2020 Apr 3;6(14):eaaz4888.
doi: 10.1126/sciadv.aaz4888. eCollection 2020 Apr.

Quantum biology revisited

Affiliations
Review

Quantum biology revisited

Jianshu Cao et al. Sci Adv. .

Abstract

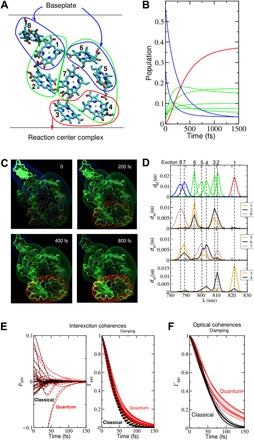
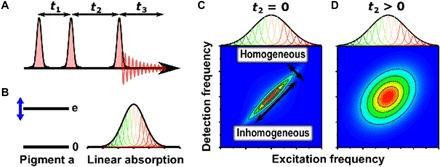
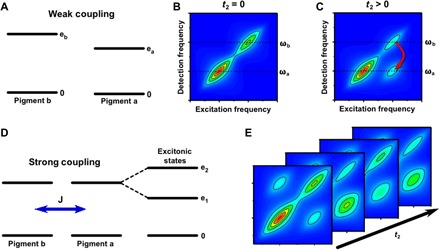
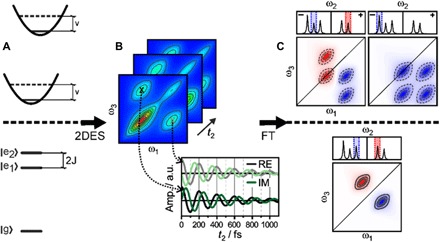
Photosynthesis is a highly optimized process from which valuable lessons can be learned about the operating principles in nature. Its primary steps involve energy transport operating near theoretical quantum limits in efficiency. Recently, extensive research was motivated by the hypothesis that nature used quantum coherences to direct energy transfer. This body of work, a cornerstone for the field of quantum biology, rests on the interpretation of small-amplitude oscillations in two-dimensional electronic spectra of photosynthetic complexes. This Review discusses recent work reexamining these claims and demonstrates that interexciton coherences are too short lived to have any functional significance in photosynthetic energy transfer. Instead, the observed long-lived coherences originate from impulsively excited vibrations, generally observed in femtosecond spectroscopy. These efforts, collectively, lead to a more detailed understanding of the quantum aspects of dissipation. Nature, rather than trying to avoid dissipation, exploits it via engineering of exciton-bath interaction to create efficient energy flow.


Figures

Fig. 1
Fig. 1. Excitation energy transfer and decay of coherences in the FMO protein.
(A) Illustration of the excitation energy transfer in the FMO protein of green sulfur bacteria. The eight BChl a pigments of the monomeric subunit of the trimeric FMO protein are oriented as depicted. The excitation energy enters from the baseplate at the top and is transferred to the reaction center complex at the bottom. The blue, green, and red surroundings of the pigments indicate high-, intermediate-, and low-energy exciton states, respectively, to which the respective pigments contribute, as analyzed in detail in (D). (B) Time-dependent population of the exciton states [same color code as in (A)], assuming that the initial state is created by incoherent exciton transfer from the baseplate (section S5). (C) Time-dependent populations of local excited states, illustrated at four different times by illuminating the pigments accordingly. In addition, the exciton states are included as surroundings of pigments that appear and fade away according to the populations of these states in (B). (D) Analysis of the spatial extent of the different exciton states, using the density of exciton states dM(ω), eq. S20, shown in the top part, where the same color code is used for the different exciton states as in (A) to (D) and the exciton states pigment distribution functions dm(ω), eq. S21, shown in the lower three parts. (E) Interexciton coherences (left part) and their damping function (right part). (F) Damping functions of the optical coherences. In both (E) and (F), the coherences are initiated by assuming a δ-pulse excitation at time zero, and the quantum mechanical treatment of nuclear motion (red lines; eqs. S26, S27, S30, and S31) is compared with a classical treatment; see eqs. S33, S34, and S37, black lines. These calculations, as well as the calculations of the population transfer (B and C) were carried out for room temperature (300 K). The lower parts of figures S4, S6, and S8 show the population transfer obtained for a classical treatment of the nuclear motion, which fails to thermalize correctly. Two movies illustrating the spatial energy transfer as in (C) are available in the Supplementary Materials.
Fig. 2
Fig. 2. What is a 2D spectrum?
(A) In 2DES (14), a sequence of three laser pulses interacts with the sample, causing emission of a signal that is recorded as a function of the three time delays. For a given “population time” t2, the Fourier transform of the signal with respect to the t1 and t3 delays provides the respective excitation and detection frequency axes of the 2D spectrum. (B) Simple quantum two-level model for the energy levels of a photosynthetic pigment, giving rise to an inhomogeneously broadened absorption spectrum. In photosynthetic complexes, the protein environment tunes the electronic energy gap, and small conformational differences among proteins probed in an ensemble measurement cause shifts of energy gaps, broadening the absorption from its inherent homogeneous width. (C) A 2D spectrum recorded at t2 = 0 separates homogeneous and inhomogeneous broadening, which are manifest as the antidiagonal and diagonal widths, respectively. (D) At later times (t2 > 0), dynamical interactions between the pigment and protein environment lead to energy gap fluctuations that broaden the antidiagonal width in a process termed spectral diffusion. The 2D spectrum contains both absorptive and refractive responses of the system; however, usually only the real part of the 2D spectrum is presented, corresponding to the absorptive part.
Fig. 3
Fig. 3. What can we learn from 2D spectra?
2D spectra have rich information about electronic structure and dynamics (14). Photosynthetic complexes contain light-absorbing pigments that are held in place by a protein scaffold that controls their relative distance and orientation, determining their coupling. In (A), we consider a common case of two weakly coupled pigments a and b. (B) At t2 = 0, the 2D spectrum displays peaks along the diagonal that reveal the inhomogeneously broadened peaks at ωa and ωb, corresponding to absorption by pigments a and b, respectively. (C) At later times, if pigments a and b are sufficiently close in space and favorably oriented, then energy transfer may occur between them, with higher probability that energy flows “downhill” from the higher energy state of pigment b to pigment a. The energy transfer process leads to the formation of a cross-peak in the 2D spectrum. Recording 2D spectra as a function of population time t2 enables the mapping of energy transfer pathways and time scales. In (D), we consider the case of two strongly coupled photosynthetic pigments. The strong coupling mixes the energy levels of the individual pigments, leading to excitons in which excitations are delocalized across the coupled pigments. Excitonic coupling between transitions is revealed by cross-peaks in the t2 = 0, so-called correlation spectrum. Besides the population relaxation between two excitonic states, observed as growing of the lower cross peak, coherence is manifest as t2-dependent oscillations as shown in (E). The distribution of the oscillating signals on 2D maps can provide important insight into the physical origin of the coherence as discussed in Fig. 4.
Fig. 4
Fig. 4. Assigning QBs to physical processes.
Coherences of different physical origin—vibrational or excitonic—lead to different characteristic patterns in the so-called oscillation maps. The characteristics of these signals—such as frequency, pump dependence, and detection dependence—provide unique identifiers, at least in idealized systems. Comparing the complicated signals from these systems to model systems proves very helpful. In (A), simple and useful model systems are the displaced oscillator (top) featuring ground- and excited-state vibrations and the excitonic dimer (bottom), where excited-state splitting is induced by coupling between pigments. (B) Even these simple models may yield virtually indistinguishable 2D spectra, with coherence manifested as QBs in the signal amplitude at specific spectral coordinates. When following these beats along the population time t2, one can observe periodic modulations of the real (RE; absorption) and imaginary (IM; dispersion) parts of the signal (black/gray and green/light green, respectively). a.u., arbitrary units. (C) Successful assignment of oscillatory signals to physical phenomena requires simultaneous analysis of beats in the entire 2D map, yielding oscillation maps after complex Fourier transformation (FT). These oscillation maps are most insightful when retrieved separately for rephasing (photon-echo) and nonrephasing responses. We here sketch rephasing data of a system with three closely spaced, but distinguishable, coherences: an excited state vibrational wave packet (top left), a Raman-active ground-state vibrational mode (top right), and an excitonic coherence (bottom). The oscillation maps show unique patterns, allowing unambiguous identification of coherences.

References

    1. Lambert N., Chen Y.-N., Cheng Y.-C., Li C.-M., Chen G.-Y., Nori F., Quantum biology. Nat. Phys. 9, 10–18 (2013).
    1. Brookes J. C., Quantum effects in biology: Golden rule in enzymes, olfaction, photosynthesis and magnetodetection. Proc. Math Phys. Eng. Sci. 473, 20160822 (2017). - PMC - PubMed
    1. E. Schrödinger, What is Life? (Cambridge Univ. Press, Cambridge, 1944).
    1. Engel G. S., Calhoun T. R., Read E. L., Ahn T.-K., Mančal T., Cheng Y.-C., Blankenship R. E., Fleming G. R., Evidence for wavelike energy transfer through quantum coherence in photosynthetic systems. Nature 446, 782–786 (2007). - PubMed
    1. J. McFadden, J. Al-Khalili, Life on the Edge: The Coming of Age of Quantum Biology. (Broadway Books, 2014).

Publication types

Substances

LinkOut - more resources