

Metabolic maturation in the first 2 years of life in resource-constrained settings and its association with postnatal growths
- PMID: 32284996
- PMCID: PMC7141821
- DOI: 10.1126/sciadv.aay5969
Metabolic maturation in the first 2 years of life in resource-constrained settings and its association with postnatal growths
Abstract
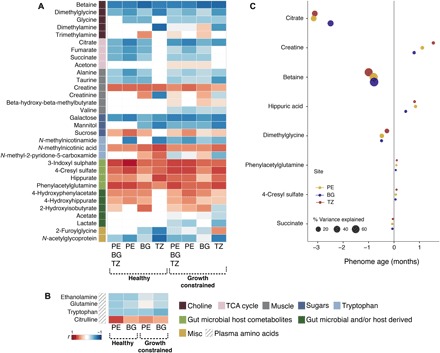
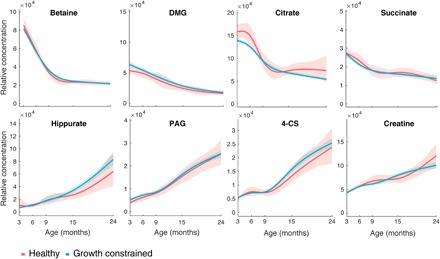
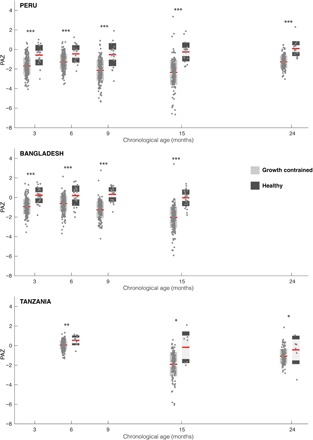
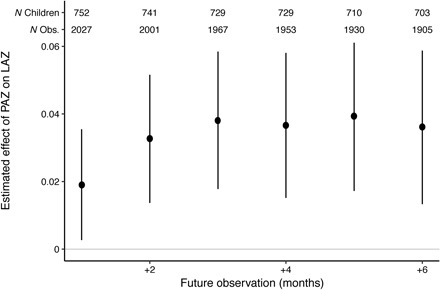
Malnutrition continues to affect the growth and development of millions of children worldwide, and chronic undernutrition has proven to be largely refractory to interventions. Improved understanding of metabolic development in infancy and how it differs in growth-constrained children may provide insights to inform more timely, targeted, and effective interventions. Here, the metabolome of healthy infants was compared to that of growth-constrained infants from three continents over the first 2 years of life to identify metabolic signatures of aging. Predictive models demonstrated that growth-constrained children lag in their metabolic maturity relative to their healthier peers and that metabolic maturity can predict growth 6 months into the future. Our results provide a metabolic framework from which future nutritional programs may be more precisely constructed and evaluated.
Copyright © 2020 The Authors, some rights reserved; exclusive licensee American Association for the Advancement of Science. No claim to original U.S. Government Works. Distributed under a Creative Commons Attribution NonCommercial License 4.0 (CC BY-NC).
Figures
References
-
- UNICEF/WHO/World Bank, Malnutrition, UNICEF Data (2019); https://www.who.int/news-room/fact-sheets/detail/malnutrition.
-
- Black R. E., Victora C. G., Walker S. P., Bhutta Z. A., Christian P., de Onis M., Ezzati M., Grantham-McGregor S., Katz J., Martorell R., Uauy R.; Maternal and Child Nutrition Study Group , Maternal and child undernutrition and overweight in low-income and middle-income countries. Lancet 382, 427–451 (2013). - PubMed
-
- The Independent Expert Group of the Global Nutrition Report, Global Nutrition Report: The Burden of Malnutrition (Development Initiatives Poverty Research Ltd., 2018); https://globalnutritionreport.org/reports/global-nutrition-report-2018/b....
-
- Bhutta Z. A., Das J. K., Rizvi A., Gaffey M. F., Walker N., Horton S., Webb P., Lartey A., Black R. E.; Lancet Nutrition Interventions Review Group; Maternal and Child Nutrition Study Group , Evidence-based interventions for improvement of maternal and child nutrition: What can be done and at what cost? Lancet 382, 452–477 (2013). - PubMed
Publication types
MeSH terms
Substances
LinkOut - more resources
Full Text Sources
Medical
