. 2020 Apr 8;6(15):eaaz4232.
doi: 10.1126/sciadv.aaz4232. eCollection 2020 Apr.

Locus coeruleus norepinephrine activity mediates sensory-evoked awakenings from sleep

Affiliations

Locus coeruleus norepinephrine activity mediates sensory-evoked awakenings from sleep

Hanna Hayat et al. Sci Adv. .

Abstract

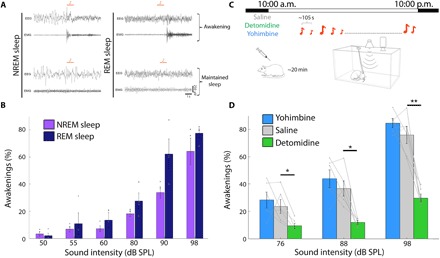
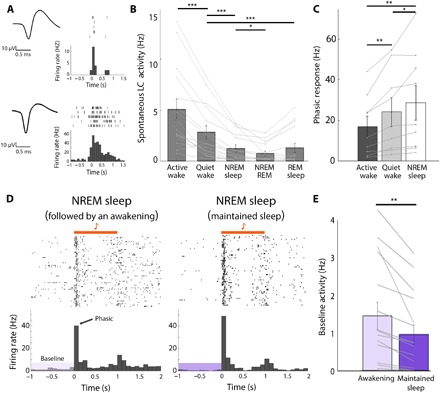
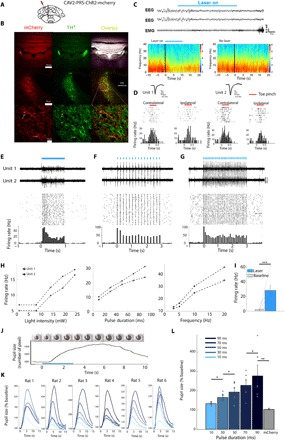
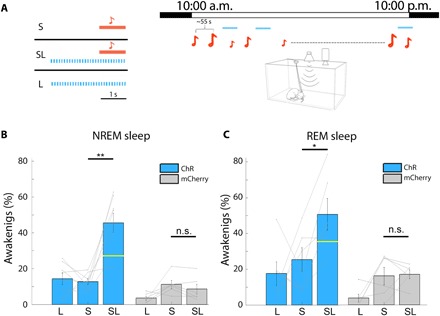
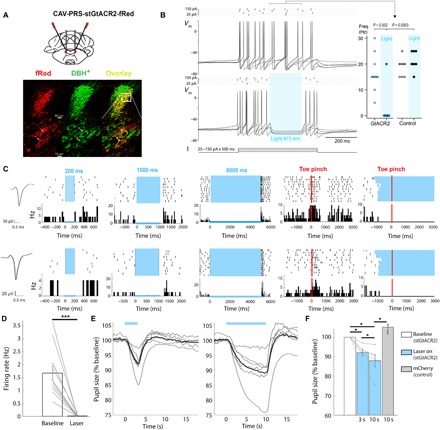
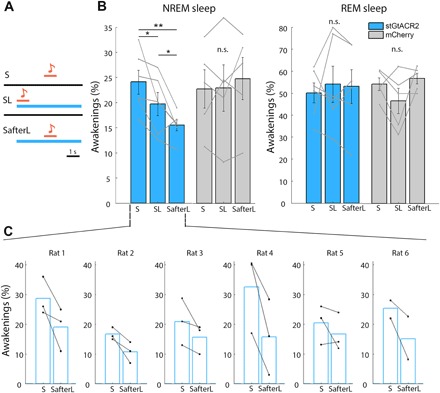
A defining feature of sleep is reduced responsiveness to external stimuli, but the mechanisms mediating sensory-evoked arousal remain unclear. We hypothesized that reduced locus coeruleus (LC) norepinephrine (NE) activity during sleep mediates unresponsiveness, and its action promotes sensory-evoked awakenings. We tested this using electrophysiological, behavioral, pharmacological, and optogenetic techniques alongside auditory stimulation in freely behaving rats. We found that systemic reduction in NE signaling lowered probability of sound-evoked awakenings (SEAs). The level of tonic LC activity during sleep anticipated SEAs. Optogenetic LC activation promoted arousal as evident in sleep-wake transitions, EEG desynchronization, and pupil dilation. Minimal LC excitation before sound presentation increased SEA probability. Optogenetic LC silencing using a soma-targeted anion-conducting channelrhodopsin (stGtACR2) suppressed LC spiking and constricted pupils. Brief periods of LC opto-silencing reduced the probability of SEAs. Thus, LC-NE activity determines the likelihood of sensory-evoked awakenings, and its reduction during sleep constitutes a key factor mediating behavioral unresponsiveness.


Figures

Fig. 1
Fig. 1. Lower NE signaling decreases the probability of SEAs from NREM sleep.
(A) Representative EEG and EMG traces showing immediate awakenings (top) versus maintained sleep (bottom) after auditory stimulation (4-kHz pure tone, 1-s duration; orange bars) in NREM sleep (left) and REM sleep (right). (B) Probability of awakenings (%) as a function of sound intensity in NREM sleep (purple) and REM sleep (dark blue). Gray circles show individual subject data (n = 4 rats). (C) Schematic of experimental setup for rat arousal threshold experiments (each lasting ~12 hours during lights on periods, with ~400 tone pips presented every 105 s on average). Sounds were delivered intermittently from speaker on top, while animals were continuously monitored with EEG, EMG, and video. In pharmacological experiments, NE drugs were injected intraperitoneally at lights on (10:00 a.m.). (D) Probability of awakenings (%) as a function of sound intensity in NREM sleep following administration of detomidine (α2 agonist, lower NE; green), yohimbine (α2 antagonist, higher NE; blue), or saline (gray). Note that lower NE decreases awakening probability. Two-way repeated-measures (RM) ANOVA, followed by post hoc t tests corrected with false discovery rate (FDR) *P < 0.05 and **P < 0.01 in n = 6 rats.
Fig. 2
Fig. 2. Baseline tonic LC activity is higher before SEAs from NREM sleep.
(A) Two representative LC clusters recorded during the experiment. Left: Action potential waveforms of unit clusters. Right: Corresponding raster plot and peristimulus time histogram (PSTH) in response to toe pinch under light anesthesia. (B) Average spontaneous firing rates of LC clusters (n = 16 from three rats) across different sleep-wake states, one-way RM ANOVA followed by post hoc FDR-corrected t test (***P < 0.001 and *P < 0.05). (C) Phasic LC response to sound (0 to 100 ms after sound onset) in 9 of 16 LC neurons exhibiting auditory-evoked discharges as a function of vigilance state. Mean ± SEM across n = 9 clusters, one-way RM ANOVA followed by post hoc FDR-corrected t-test; *P < 0.05 and **P < 0.01. (D) Representative auditory-evoked multiunit (MU) firing (raster and PSTH) during NREM sleep. Left: Trials followed by awakening. Right: Trials followed by maintained sleep. Horizontal orange bar shows 1-s tone stimulus. (E) Quantification of baseline LC activity during NREM sleep in trials preceding awakening (light purple) versus maintained sleep (dark purple). Data represent means ± SEM (**P < 0.01, paired t test; n = 16 neuronal clusters, an average of 84 trials per cluster, n = 3 rats). Note significantly higher baseline activity before awakenings (51.37% increase compared with maintained sleep).
Fig. 3
Fig. 3. Specific and effective optogenetic excitation of LC neurons.
(A) Schematic of unilateral LC injection and optic fiber implantation. (B) Specific expression of ChR2-mCherry in LC neurons: Representative coronal images showing CAV2-PRS-ChR2-mCherry expression (left column, red), labeling of TH+ neurons (middle column, green), and their overlay (right column, yellow). Top: Global expression in coronal sections; middle: expression around the LC; bottom: magnified images of cells in the boxed area marked in middle row. Arrows mark neurons showing coexpression. (C) Top: Representative EEG and EMG traces showing an immediate awakening from NREM sleep upon strong optogenetic LC activation (10-s stimulation at 10 Hz, 90-ms pulses). Bottom: Representative EEG spectrograms after LC activation (bottom left) versus no laser stimulation (bottom right). (D) Representative recordings from two LC neurons recorded simultaneously. Insets show action potential waveforms, while raster plots and PSTHs show typical biphasic response to contralateral and ipsilateral toe pinch. (E) Top: Representative high-pass–filtered (>300 Hz) traces of two simultaneously same recorded channels in response to 1 Hz on/off laser stimulation. Middle and bottom: Raster plot and PSTH of neuron from bottom trace. (F) Same as in (E) for stimulation at 5 Hz (pulse duration, 10 ms). (G) Same as in (E) for laser stimulation at 10 Hz (pulse duration, 10 ms). (H) Laser-evoked firing rate as a function of light intensity (left; 1-s stimulation), pulse duration (middle; at 5 Hz), or stimulation frequency (right; pulse duration, 10 ms). (I) Significant increase in LC firing rates upon 1-s laser illumination compared with baseline (***P < 0.001, paired t test; n = 7 neuronal clusters from two rats, 37 trials, on average, per unit). (J) Representative single trial example of LC optogenetic induced pupil dilation. Top: Video images and pupil size estimation (red contour) before and during 3-s laser illumination (10 pulses/s, 90-ms pulse duration). (K) Fifteen-second time courses of pupil size increase (relative to baseline) for five pulse duration conditions (10 to 90 ms, light to dark blue) in each animal. (L) Summary data (mean ± SEM) of pupil size increase as a function of laser pulse duration (**P < 0.01 and *P < 0.05, Wilcoxon test) in n = 6 rats (ChR-mCherry; blue) and n = 6 control rats (mCherry; gray). Five to 15 trials per pulse duration condition.
Fig. 4
Fig. 4. Minimal optogenetic LC excitation increases the probability of SEAs.
(A) Left: Schematic of three conditions in LC optogenetic activation arousal threshold experiments: presentation of sound (S) only, sound on a background of blue laser stimulation (SL), and blue laser only (L). Right: Schematic of experimental session for rat arousal threshold experiments combined with LC optogenetics (each experiment lasting ~12 hours during lights on periods, with hundreds of tone pips presented every 55 s on average). (B) Probability of awakening in NREM sleep as a function of the three experimental conditions in rats injected with CAV-PRS-ChR2-mCherry (blue, n = 8 rats) or control mCherry (gray, n = 6 rats). Yellow horizontal line dividing the SL bar represents the expected independent effect of sound and laser stimulation (Materials and Methods). n.s., not significant. (C) Same as in (B) for REM sleep with rats injected with CAV-PRS-ChR2-mCherry (blue, n = 6 rats) or control mCherry (n = 6 rats; gray). **P < 0.01 and *P < 0.05, paired t tests corrected with FDR (see fig. S2 for laser frequency parameters). On average, per session and for each condition (SL/S/SL), n = 68 trials occurred during NREM sleep, and n = 21 trials occurred during REM sleep.
Fig. 5
Fig. 5. Specific and effective optogenetic inhibition of LC neurons.
(A) Schematic of bilateral LC injection and optic fiber implantation (top) and specific expression of stGtACR2-fRed in LC neurons (bottom): representative coronal images showing CAV2-PRS-stGtACR2-fRed expression (left column, red), labeling of DBH+ neurons (middle column, green), and their overlay (right column, yellow). (B) Whole-cell current-clamp recording from LC neurons in pontine slice (n = 10 rats, one to three neurons per rat) showing the spike discharge evoked by current injection is prevented by a brief pulse of light (473 nm, 200 ms x 4 mW) to activate the stGtACR2, a silencing effect seen across recordings from transduced LC neurons (data from response to 175-pA pulse; P = 0.002, Wilcoxon matched pairs; n = 10 neurons), whereas no effect of light was seen in nontransduced LC neurons in the same slices (n = 7 neurons). (C) Representative data from two recordings of neuronal clusters in the same CAV2-PRS-stGtACR2-fRed transduced rat. (Left) Action potential waveforms, (middle) raster plots and PSTH of inhibitory responses to different laser durations (in blue, 200, 1000, and 5000 ms), and (right) LC neuron with typical biphasic response to contralateral toe pinch, abolished by concurrent illumination. (D) Bar graph shows significant decrease in the firing rate of LC neurons upon 1 s of laser illumination (n = 13 units from two rats; nine trials, on average, per unit; ***P < 0.001, paired t test). (E) Representative pupil size traces (gray lines represent single trials, and black lines represent average of the trials) during 3 s (left) and 10 s (right) of laser illumination. (F) Bar graph shows significant pupil constriction when LC was silenced in a duration-dependent manner (stGtACR2 in blue, n = 6 rats; control mCherry in gray, n = 5 rats, 5 to 15 trials per laser duration condition), *P < 0.05, Wilcoxon test.
Fig. 6
Fig. 6. Optogenetic LC silencing decreases the probability of SEAs.
(A) Schematic of three conditions in LC opto-silencing arousal threshold experiments. Top: Presentation of sound (S) only (85-dB SPL); middle: same sound played simultaneously with laser stimulation (SL); bottom: same sound played 2 s after laser onset (SafterL). Laser duration was continuous for 5 s. (B) Probability of awakening as a function of the three conditions in rats expressing stGtACR2-fRed (blue, n = 6 rats) and mCherry control (gray, n = 5 rats) in NREM sleep (left) and REM sleep (right) (*P < 0.05 and **P < 0.01, paired t test). (C) Probability of awakenings from NREM sleep in each session per rat expressing stGtACR2-fRed. On average, per session and for each condition (S/SL/SafterL), 71 trials occurred during NREM sleep, and 20 trials occurred during REM sleep.

References

    1. Anafi R. C., Kayser M. S., Raizen D. M., Exploring phylogeny to find the function of sleep. Nat. Rev. Neurosci. 20, 109–116 (2019). - PubMed
    1. Neckelmann D., Ursin R., Sleep stages and EEG power spectrum in relation to acoustical stimulus arousal threshold in the rat. Sleep 16, 467–477 (1993). - PubMed
    1. Oswald I., Taylor A. M., Treisman M., Discriminative responses to stimulation during human sleep. Brain 83, 440–453 (1960). - PubMed
    1. Busby K. A., Mercier L., Pivik R. T., Ontogenetic variation in auditory arousal threshold during sleep. Psychophysiology 31, 182–188 (1994). - PubMed
    1. Lee S.-H., Dan Y., Neuromodulation of brain states. Neuron 76, 209–222 (2012). - PMC - PubMed

Publication types

LinkOut - more resources