. 2020 Apr 3:3:51.
doi: 10.1038/s41746-020-0249-z. eCollection 2020.

Personalized predictions of patient outcomes during and after hospitalization using artificial intelligence

Affiliations

Personalized predictions of patient outcomes during and after hospitalization using artificial intelligence

C Beau Hilton et al. NPJ Digit Med. .

Abstract

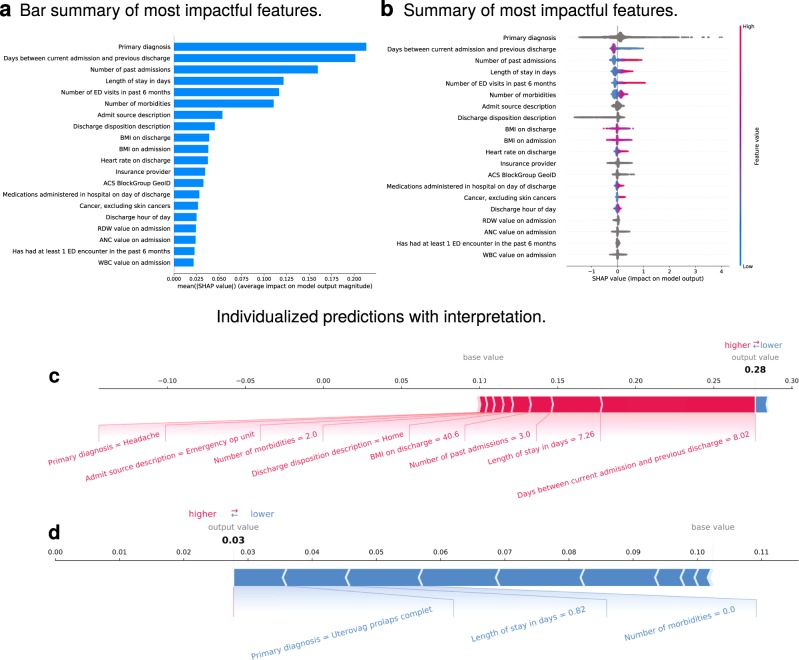
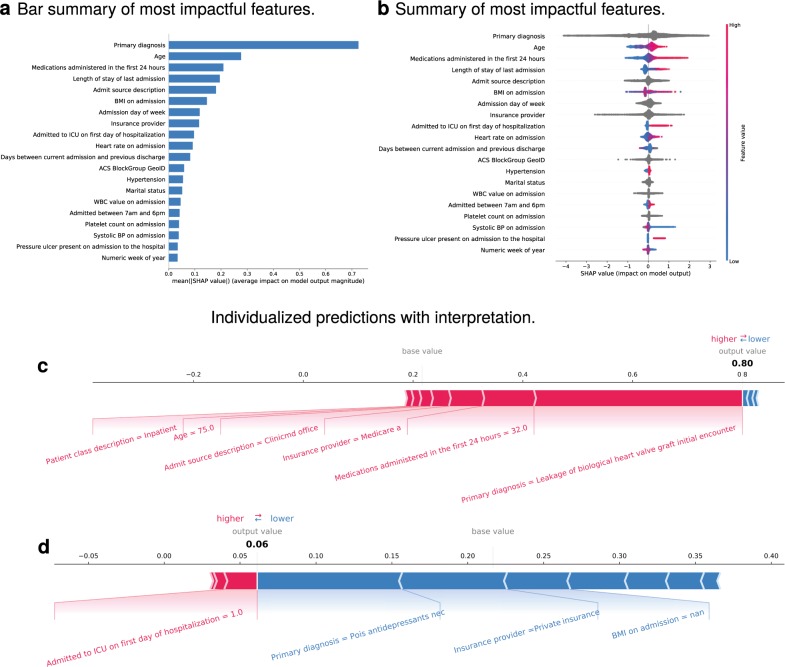
Hospital systems, payers, and regulators have focused on reducing length of stay (LOS) and early readmission, with uncertain benefit. Interpretable machine learning (ML) may assist in transparently identifying the risk of important outcomes. We conducted a retrospective cohort study of hospitalizations at a tertiary academic medical center and its branches from January 2011 to May 2018. A consecutive sample of all hospitalizations in the study period were included. Algorithms were trained on medical, sociodemographic, and institutional variables to predict readmission, length of stay (LOS), and death within 48-72 h. Prediction performance was measured by area under the receiver operator characteristic curve (AUC), Brier score loss (BSL), which measures how well predicted probability matches observed probability, and other metrics. Interpretations were generated using multiple feature extraction algorithms. The study cohort included 1,485,880 hospitalizations for 708,089 unique patients (median age of 59 years, first and third quartiles (QI) [39, 73]; 55.6% female; 71% white). There were 211,022 30-day readmissions for an overall readmission rate of 14% (for patients ≥65 years: 16%). Median LOS, including observation and labor and delivery patients, was 2.94 days (QI [1.67, 5.34]), or, if these patients are excluded, 3.71 days (QI [2.15, 6.51]). Predictive performance was as follows: 30-day readmission (AUC 0.76/BSL 0.11); LOS > 5 days (AUC 0.84/BSL 0.15); death within 48-72 h (AUC 0.91/BSL 0.001). Explanatory diagrams showed factors that impacted each prediction.

Keywords: Health care economics; Outcomes research; Risk factors.


Conflict of interest statement

Competing interestsThe authors declare no competing interests.

Figures

Fig. 1
Fig. 1. 30-Day readmission.
a Shows the most impactful features on prediction (ranked from most to least important). b Shows the distribution of the impacts of each feature on the model output. The colors represent the feature values for numeric features: red for larger values and blue for smaller. The line is made of individual dots representing each admission, and the thickness of the line is determined by the number of examples at a given value (for example, most patients have a low number of past admissions). A negative SHAP value (extending to the left) indicates a reduced probability, while a positive one (extending to the right) indicates an increased probability. For non-numeric features, such as primary diagnosis, the gray points represent specific possible values, with certain diagnoses greatly increasing or reducing the model’s output, while the majority of diagnoses have relatively mild impact on prediction. c, d Show the composition of individualized predictions for two patients. The patient in c was admitted from the emergency outpatient unit with a headache and stayed for >7 days. In addition, this patient had been hospitalized 3 times prior to this admission and had been discharged from the last admission only 8 days prior. The predicted probability of 30-day readmission (~0.30) was three times the baseline value predicted by the model (~0.1). All of the listed features increased the model’s prediction of risk by the relative amounts shown by the size of the red bars. Conversely, the patient in d was admitted for a complete uterovaginal prolapse, stayed less than a full day, and had no reported comorbidities, such as hypertension, depression, or a history of cancer. The model predicted their probability of 30-day readmission at 0.03 or roughly one-third of the baseline prediction. The top variables that contribute and will fit on the chart are shown, but the others can be queried in the live system. The model considers all variables, and SHAP reports on all variables internally, but the images are understandably truncated for visibility.
Fig. 2
Fig. 2. Length of stay >5 days.
a shows the most impactful features on prediction (ranked from most to least important). b shows the distribution of the impacts of each feature on the model output. The colors represent the feature values for numeric features: red for larger values and blue for smaller. The line is made of individual dots representing each admission, and the thickness of the line is determined by the number of examples at a given value (for example, many of our patients are elderly). A negative SHAP value (extending to the left) indicates a reduced probability, while a positive one (extending to the right) indicates an increased probability. For example, advanced age increases the probability of extended length of stay (SHAP value between zero and one), while young age tends toward a SHAP value between roughly −1 and zero, corresponding to reduced probability. For non-numeric features, such as primary diagnosis, the gray points represent specific possible values, with certain diagnoses greatly increasing or reducing the model’s output, while the majority of diagnoses have relatively mild impact on prediction. c, d show the composition of individualized predictions for two patients. The 75-year-old patient in c was admitted to the inpatient service directly from a physician’s office with leakage of a heart valve graft. The patient received 32 medications in the first 24 h and has Medicare Part A insurance coverage. The model predicted that the patient’s probability of staying >5 days was 0.80, nearly four times the baseline prediction of ~0.2. The majority of the model’s prediction was based on the diagnosis, followed by the number of initial medications, and then the other variables as shown. The patient in d, on the other hand, had a predicted probability of length of stay of 0.06 or roughly one-fourth of the baseline, despite being admitted to the ICU within 24 h of admission. The major contributor to this low probability was the diagnosis of antidepressant poisoning, followed by a private insurance provider, and finally by a lack of BMI recorded in the chart for this encounter. The reasoning behind the importance of a missing value for BMI is unclear but is repeatedly apparent in several analyses and may have to do with systematic recording practices within the hospital system (see Agniel et al. for an exploration of this phenomenon).

References

    1. Auerbach AD, Neinstein A, Khanna R. Balancing innovation and safety when integrating digital tools into health care. Ann. Intern. Med. 2018;168:733–734. doi: 10.7326/M17-3108. - DOI - PubMed
    1. Cabitza F, Rasoini R, Gensini GF. Unintended consequences of machine learning in medicine. JAMA. 2017;318:517. doi: 10.1001/jama.2017.7797. - DOI - PubMed
    1. Sniderman AD, D’Agostino RB, Sr, Pencina MJ. The role of physicians in the era of predictive analytics. JAMA. 2015;314:25–26. doi: 10.1001/jama.2015.6177. - DOI - PubMed
    1. Wadhera RK, et al. Association of the Hospital Readmissions Reduction Program with mortality among Medicare beneficiaries hospitalized for heart failure, acute myocardial infarction, and pneumonia. JAMA. 2018;320:2542–2552. doi: 10.1001/jama.2018.19232. - DOI - PMC - PubMed
    1. Bojarski, M. et al. End to end learning for self-driving cars. Preprint at https://arxiv.org/abs/1604.07316 (2016).