. 2019 Jan-Mar:1:100005.
doi: 10.1016/j.yjsbx.2019.100005. Epub 2019 Feb 14.

Eliminating effects of particle adsorption to the air/water interface in single-particle cryo-electron microscopy: Bacterial RNA polymerase and CHAPSO

Affiliations

Eliminating effects of particle adsorption to the air/water interface in single-particle cryo-electron microscopy: Bacterial RNA polymerase and CHAPSO

James Chen et al. J Struct Biol X. 2019 Jan-Mar.

Abstract

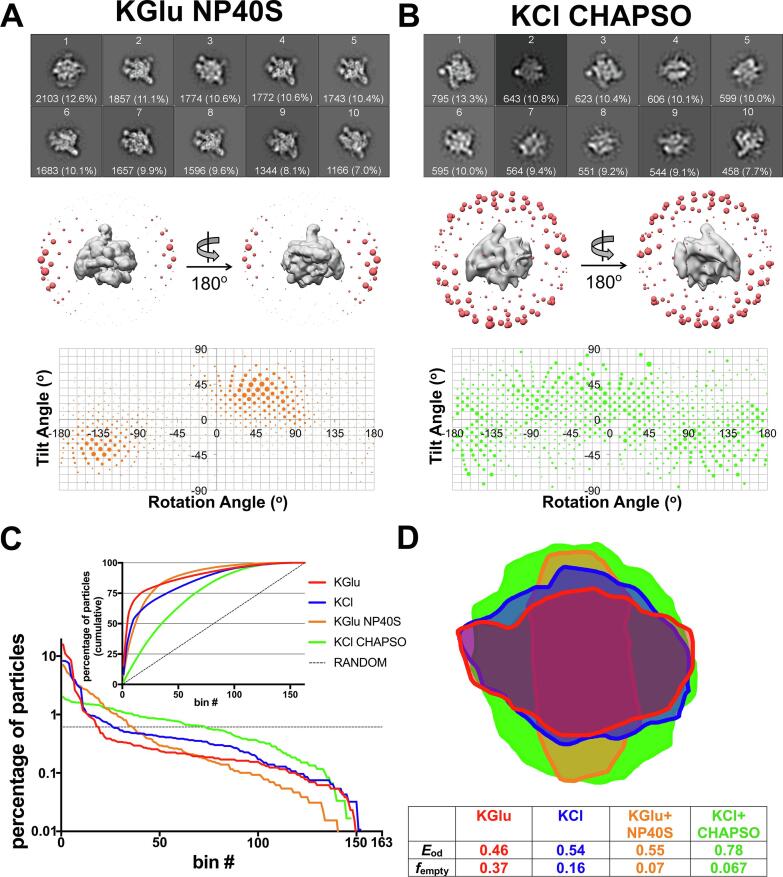
Preferred particle orientation presents a major challenge for many single particle cryo-electron microscopy (cryo-EM) samples. Orientation bias limits the angular information used to generate three-dimensional maps and thus affects the reliability and interpretability of the structural models. The primary cause of preferred orientation is presumed to be due to adsorption of the particles at the air/water interface during cryo-EM grid preparation. To ameliorate this problem, detergents are often added to cryo-EM samples to alter the properties of the air/water interface. We have found that many bacterial transcription complexes suffer severe orientation bias when examined by cryo-EM. The addition of non-ionic detergents, such as NP-40, does not remove the orientation bias but the Zwitter-ionic detergent CHAPSO significantly broadens the particle orientation distributions, yielding isotropically uniform maps. We used cryo-electron tomography to examine the particle distribution within the ice layer of cryo-EM grid preparations of Escherichia coli 6S RNA/RNA polymerase holoenzyme particles. In the absence of CHAPSO, essentially all of the particles are located at the ice surfaces. CHAPSO at the critical micelle concentration eliminates particle absorption at the air/water interface and allows particles to randomly orient in the vitreous ice layer. We find that CHAPSO eliminates orientation bias for a wide range of bacterial transcription complexes containing E. coli or Mycobacterium tuberculosis RNA polymerases. Findings of this study confirm the presumed basis for how detergents can help remove orientation bias in cryo-EM samples and establishes CHAPSO as a useful tool to facilitate cryo-EM studies of bacterial transcription complexes.

Keywords: Cryo-electron tomography.


Conflict of interest statement

Declarations of interest: None

Figures

None
Graphical abstract
Fig. 1
Fig. 1
Single particle cryo-EM analysis of 6S-Eσ70 particle orientation distributions in KGlu and KCl. A – B. (Top Panel) Top 10 2D classes calculated in RELION (Scheres, 2012) based on particle population. Absolute number and percentage of particles for each class are designated in white text. (Middle Panel) 3D distribution plot of particle orientations. Particles were 3D classified into one class using Eco core RNAP (PDB ID 4LJZ (Bae et al., 2013); σ 70 was deleted and the structure was low-pass filtered using EMAN2) (Tang et al., 2007) as a 3D template in RELION (Scheres, 2012). The resulting density is shown as a solid grey volume and the angular distribution from this alignment is shown as red spheres. Each sphere represents a particular Euler angle and the sphere volume represents the absolute number of particles at that particular angle. (Bottom Panel) 2D distribution plot of particle orientations. Particles are plotted on a tilt angle vs rotation angle graph. Areas of the points represents the percentage of particles at that particular orientation. A. 2D classes and angular distribution of 6S-Eσ70 particles in KGlu (see Supplemental Table 1). B. 2D classes and angular distribution of 6S-Eσ70 particles in KCl (see Supplemental Table 1). (For interpretation of the references to color in this figure legend, the reader is referred to the web version of this article.)
Fig. 2
Fig. 2
Single particle cryo-EM analysis of 6S-Eσ70 particle orientation distributions in KGlu + NP40S and KCl + CHAPSO. A-B (Top, middle, bottom panels) Refer to Fig. 1. A. 2D classes and angular distribution of 6S-Eσ70 particles in KGlu + NP40S (see Supplemental Table 1). B. 2D classes and angular distribution of 6S-Eσ70 particles in KCl + CHAPSO (see Supplemental Table 1). C. Particles for each dataset were grouped into Euler angle bins (20° rotation angle × 20° tilt angle bind) and then the bins were ranked according to the number of particles populating that bin (bin #1 has the most particles, so on). Plotted on a semi-log scale is the percent of total particles in each dataset by bin #. The horizontal dashed line represents a totally random particle orientation distribution (equal number of particles in each bin). (Inset) Plotted is the cumulative percent particles by bin #. The random distribution is denoted by the dashed line. D. Cross-sections through the middle of the expected PSFs (calculated using cryoEF (Naydenova and Russo, 2017) are superimposed, illustrating the anisotropy for the KGlu (red), KCl (blue), and KGlu + NP40S (orange) samples, while the KCl + CHAPSO sample yields an isotropic PSF (green). Parameters further characterizing the orientation distributions (the orientation efficiency, Eod, and the fraction of unsampled Fourier space, fempty (Naydenova and Russo, 2017) are also tabulated. (For interpretation of the references to color in this figure legend, the reader is referred to the web version of this article.)
Fig. 3
Fig. 3
Cryo-ET reveals mechanism for preferred orientation. A – D. (Left Panel) Surface tomographic cross-section of the vitreous ice layer. (Middle Panel) Middle tomographic cross-section of the vitreous ice layer. (Top Right Panel) Schematic diagram of particle distribution in vitreous ice. Top and bottom surfaces of the ice are shown with a solid blue line. Thickness of ice is indicated on the bracket right of the cartoon. 6S-Eσ70 and free 6S RNA particles are shown as grey volumes in the cartoon. (Bottom Right Panel) Spatial plot of particles in vitreous ice layer, oriented orthogonal to the ice surface. Each 6S-Eσ70 particle is represented as a blue point and graphed based on 3D position in the ice layer. A. Tomogram of 6S-Eσ70 particles in KGlu. B. Tomogram of 6S-Eσ70 particles in KCl. C. Tomogram of 6S-Eσ70 particles in KGlu + NP40S. D. Tomogram of 6S-Eσ70 particles in KCl + CHAPSO. (For interpretation of the references to color in this figure legend, the reader is referred to the web version of this article.)
Fig. 4
Fig. 4
Effect of CHAPSO on particle orientations is concentration dependent. A – C. (Top Panel) 3D distribution plot of particle orientations. Particles were 3D classified into one class using Eco core RNAP (PDB ID 4LJZ (Bae et al., 2013); σ70 was deleted and the structure was low-pass filtered using EMAN2) (Tang et al., 2007) as a 3D template in RELION (Scheres, 2012). The resulting density is shown as a solid grey volume and the angular distribution from this alignment is shown as red spheres. Each sphere represents a particular Euler angle and the sphere volume represents the absolute number of particles at that particular angle. (Bottom Panel) 2D distribution plot of particle orientations. Particles are plotted on a tilt angle vs rotation angle graph. Areas of the points represents the percentage of particles at that particular orientation. A. Angular distribution of TEC particles in TEC buffer (20 mM Tris-HCl, pH 8.0, 150 mM KCl, 5 mM MgCl2, 5 mM DTT) without CHAPSO. B. Angular distribution of TEC particles in TEC buffer + 4 mM CHAPSO (0.5XCMC). C. Angular distribution of TEC particles in TEC buffer + 8 mM CHAPSO (1XCMC). D. Particles for each dataset were grouped into Euler angle bins (20° rotation angle × 20° tilt angle bind) and then the bins were ranked according to the number of particles populating that bin (bin #1 has the most particles, so on). Plotted on a semi-log scale is the percent of total particles in each dataset by bin #. The horizontal dashed line represents a totally random particle orientation distribution (equal number of particles in each bin). (Inset) Plotted is the cumulative percent particles by bin #. The random distribution is denoted by the dashed line. E. Cross-sections through the middle of the expected PSFs (calculated using cryoEF (Naydenova and Russo, 2017) are superimposed. Parameters further characterizing the orientation distributions (the orientation efficiency, Eod, and the fraction of unsampled Fourier space, fempty (Naydenova and Russo, 2017) are also tabulated. (For interpretation of the references to color in this figure legend, the reader is referred to the web version of this article.)
Fig. 5
Fig. 5
CHAPSO molecules interact with RNAP particles. A. CHAPSO molecules bound to the Eco RNAP surface. (top middle) Overall view of the Eco RNAP ops-ternary elongation complex bound to RfaH (6C6T) (Kang et al., 2018a). The structure is shown as molecular surfaces color-coded as shown in the color key at the lower right. Shown in orange are three CHAPSO molecules bound to the RNAP surface. (lower left) Molecular structure of CHAPSO. The portion highlighted in orange is resolved in the cryo-EM maps. (top left) Magnified view showing CHAPSO3 along with the nominal 3.5 Å resolution cryo-EM map (blue mesh). (top right) Magnified view showing CHAPSO2 along with the cryo-EM map. The cryo-EM density for CHAPSO2 was not of sufficient quality to determine the CHAPSO orientation. (bottom middle) Magnified view showing CHAPSO1 along with the cryo-EM map. B. Cryo-EM maps of previously published Eco RNAP transcription complexes were retrospectively examined for the presence of bound CHAPSO in the three sites. The presence of CHAPSO density in the map is indicated by ‘X’. In the HisPEC (6ASX) (Kang et al., 2018b), a conformational change shifts the position of βi9, disrupting CHAPSO site 3. (For interpretation of the references to color in this figure legend, the reader is referred to the web version of this article.)
Supplementary figure 1
Cryo-EM data collection and processing of 6S-Eσ70. A. Cryo-EM processing pipeline for 6S-Eσ70 in KGlu. This processing scheme was used to process all other datasets in this study. Movies were drift corrected using either MotionCor (Zheng et al., 2017) or Unblur (Grant and Grigorieff, 2015a) to generate images that were then CTF corrected using GCtf (Zhang, 2016). Particles were autopicked using Gautomatch (K. Zhang, http://www.mrc-lmb.cam.ac.uk/kzhang/Gautomatch) and cleaned up using RELION (Scheres, 2012) 2D (N = 50) and 3D (N = 3) classifications. The final set of particles were aligned using RELION (Scheres, 2012) 3D classification (N = 1) using PDB ID 4LJZ (Bae et al., 2013) as a 3D template (made in EMAN2 (Tang et al., 2007)) to determine angular orientations. B. Demonstration of “smearing” effect from maps with particles with preferred orientation. (Top) RELION (Scheres, 2012) 3D reconstruction of particles from KGlu showing “smearing” in the plane opposite to that of the preferred orientation. (Bottom) RELION (Scheres, 2012) 3D reconstruction of particles from KCl + CHAPSO shows an isotropically uniform map.
Supplementary figure 2
CHAPSO molecules bound to the Eco RNAP surface at 4 mM CHAPSO. (top) Overall view of the Eco RNAP TEC reconstruction (29,500 particles, nominal 8.3 Å resolution). The structure is shown as molecular surfaces color-coded as follows: αI, αII, ω, light gray; β, cyan; β’, pink; nt-strand DNA, medium gray; t-strand DNA, dark gray; RNA transcript, red. Shown in orange are three CHAPSO molecules bound to the RNAP surface. (bottom) Magnified views of the three CHAPSO sites. The RNAP model is shown as a backbone ribbon. Cryo-EM difference maps (orange mesh) reveal the CHAPSO molecules.

References

    1. Agulleiro J.I., Fernandez J.J. Fast tomographic reconstruction on multicore computers. Bioinformatics. 2011;27:582–583. doi: 10.1093/bioinformatics/btq692. - DOI - PubMed
    1. Agulleiro J.I., Fernandez J.-J. Tomo3D 2.0–exploitation of advanced vector extensions (AVX) for 3D reconstruction. J. Struct. Biol. 189. 2015:147–152. doi: 10.1016/j.jsb.2014.11.009. - DOI - PubMed
    1. Bae B., Davis E., Brown D., Campbell E.A., Wigneshweraraj S.R., Darst S.A. Phage T7 Gp2 inhibition of Escherichia coli RNA polymerase involves misappropriation of σ70 domain 1.1. Proceedings of the National Academy of Sciences. 2013;110:19772–19777. doi: 10.1073/pnas.1314576110. - DOI - PMC - PubMed
    1. Barth M., Bryan R.K., Hegerl R. Approximation of missing-cone data in 3D electron microscopy. Ultramicroscopy. 1989;31:365–378. doi: 10.1016/0304-3991(89)90335-5. - DOI
    1. Boyaci H., Chen J., Lilic M., Palka M., Mooney R.A., Landick R. Fidaxomicin jamsMycobacterium tuberculosisRNA polymerase motions needed for initiation via RbpA contacts. Elife. 2018;7 - PMC - PubMed

LinkOut - more resources