. 2020 Aug;108(2):253-263.
doi: 10.1002/cpt.1856. Epub 2020 May 12.

Optimizing Hydroxychloroquine Dosing for Patients With COVID-19: An Integrative Modeling Approach for Effective Drug Repurposing

Affiliations

Optimizing Hydroxychloroquine Dosing for Patients With COVID-19: An Integrative Modeling Approach for Effective Drug Repurposing

Maria Garcia-Cremades et al. Clin Pharmacol Ther. 2020 Aug.

Erratum in

Abstract

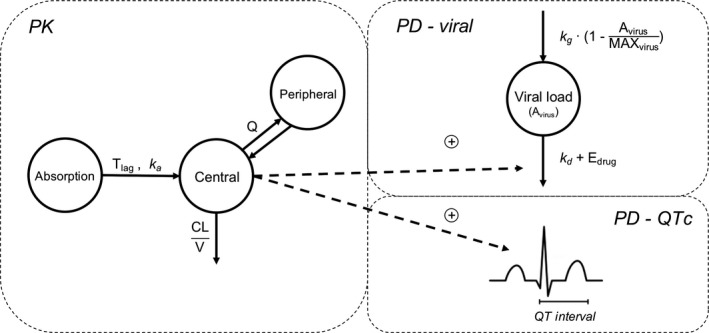
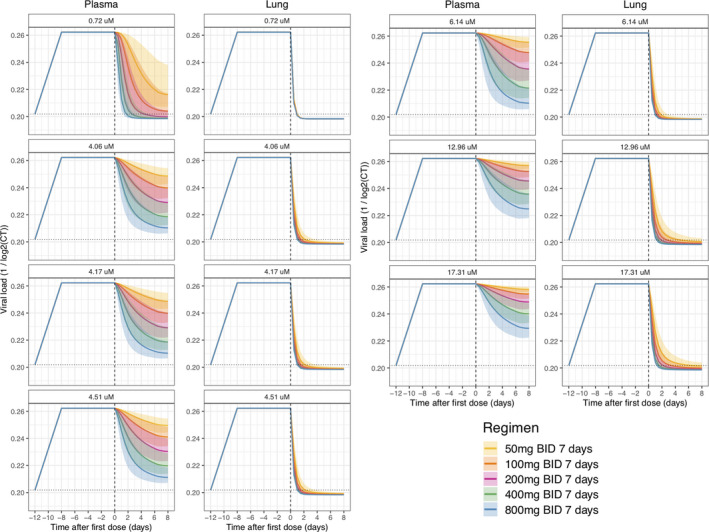
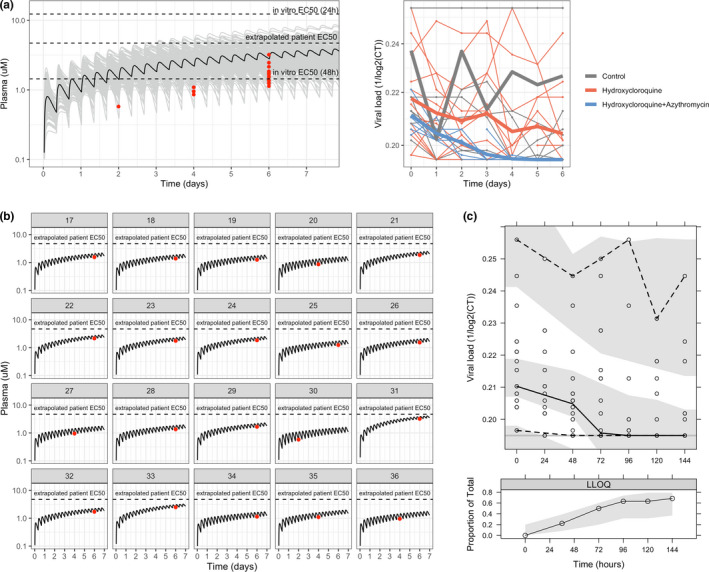
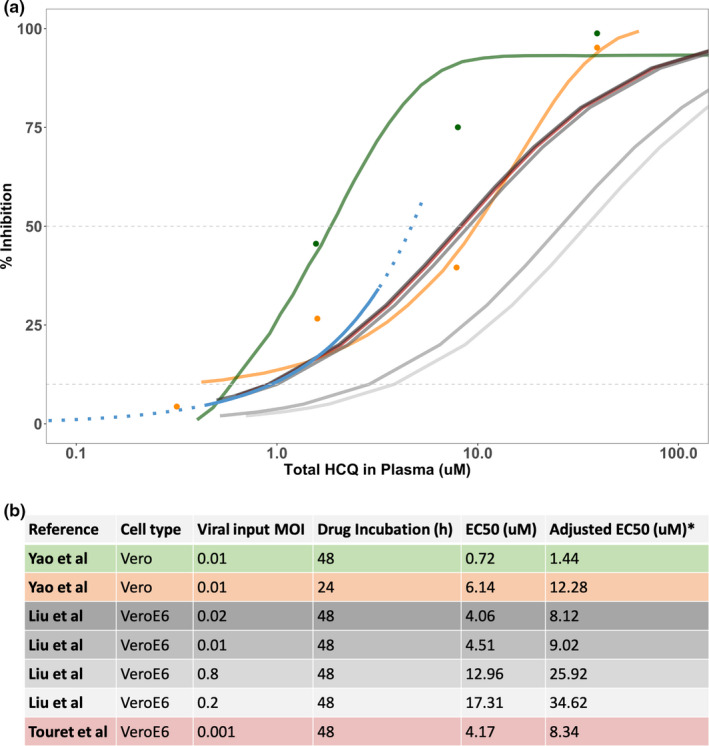
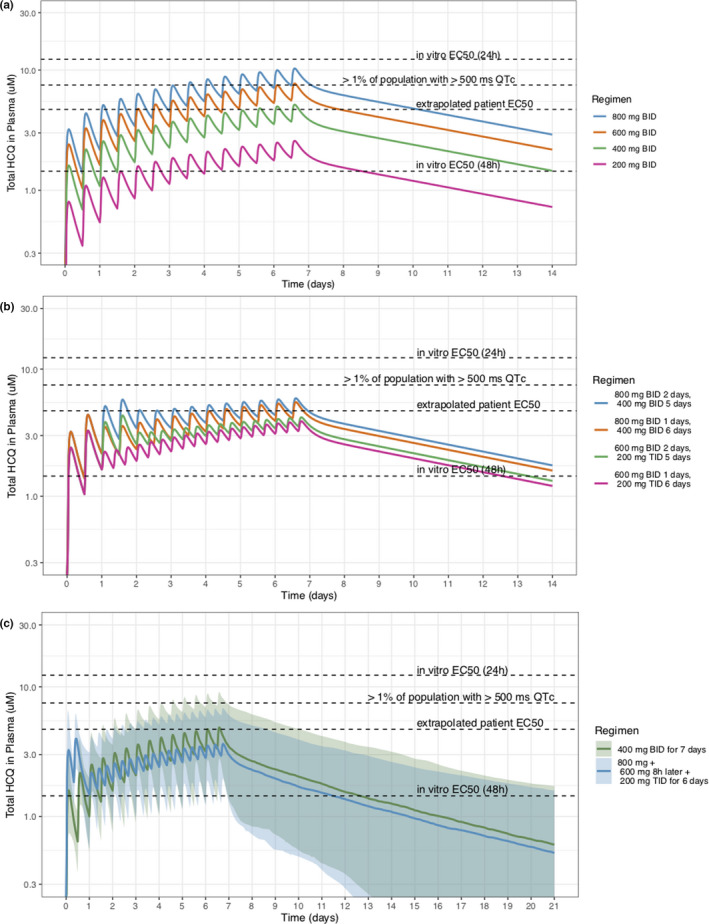
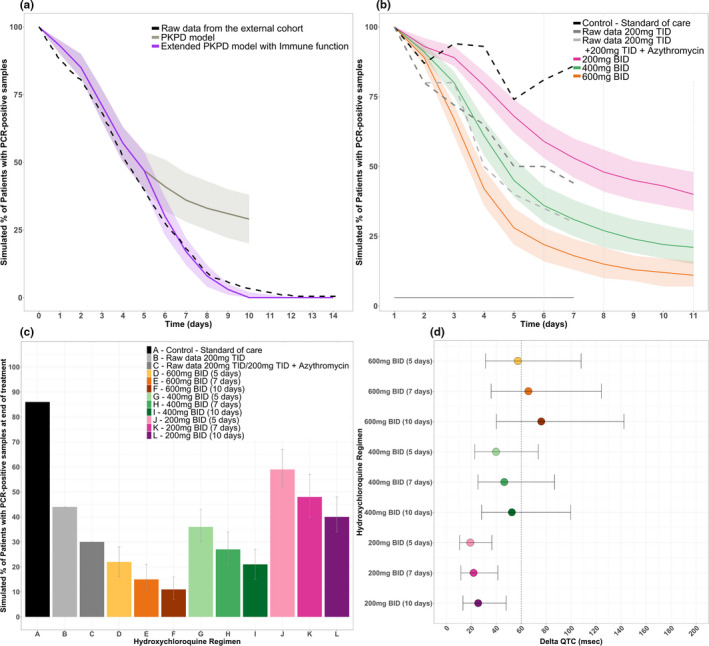
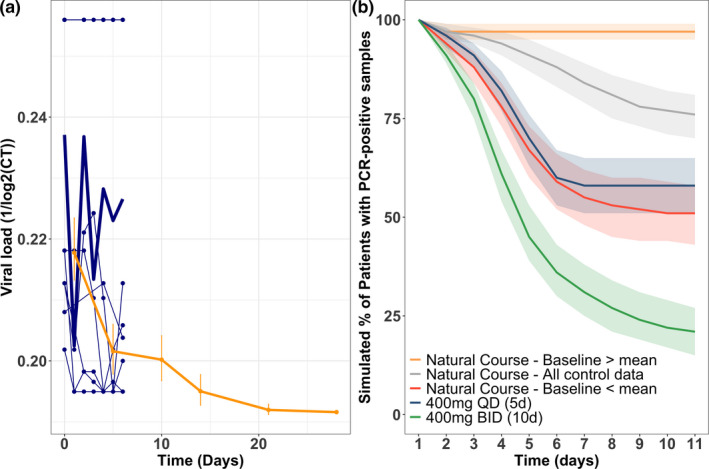
Hydroxychloroquine (HCQ) is a promising candidate for Coronavirus disease of 2019 (COVID-19) treatment. The optimal dosing of HCQ is unknown. Our goal was to integrate historic and emerging pharmacological and toxicity data to understand safe and efficacious HCQ dosing strategies for COVID-19 treatment. The data sources included were (i) longitudinal clinical, pharmacokinetic (PK), and virologic data from patients with severe acute respiratory syndrome-2 (SARS-CoV-2) infection who received HCQ with or without azithromycin (n = 116), (ii) in vitro viral replication data and SARS-CoV-2 viral load inhibition by HCQ, (iii) a population PK model of HCQ, and (iv) a model relating chloroquine PKs to corrected QT (QTc) prolongation. A mechanistic PK/virologic/QTc model for HCQ was developed and externally validated to predict SARS-CoV-2 rate of viral decline and QTc prolongation. SARS-CoV-2 viral decline was associated with HCQ PKs (P < 0.001). The extrapolated patient half-maximal effective concentration (EC50 ) was 4.7 µM, comparable to the reported in vitro EC50s . HCQ doses > 400 mg b.i.d. for ≥5 days were predicted to rapidly decrease viral loads, reduce the proportion of patients with detectable SARS-CoV-2 infection, and shorten treatment courses, compared with lower dose (≤ 400 mg daily) regimens. However, HCQ doses > 600 mg b.i.d. were also predicted to prolong QTc intervals. This prolongation may have clinical implications warranting further safety assessment. Due to COVID-19's variable natural history, lower dose HCQ regimens may be indistinguishable from controls. Evaluation of higher HCQ doses is needed to ensure adequate safety and efficacy.


Conflict of interest statement

The authors declared no conflict of interest.

Figures

Figure 1
Figure 1
Pharmacokinetic/pharmacodynamic (PK/PD)‐viral kinetics model diagram. A previously published two‐compartment plasma PK model was used to simulate plasma concentration. PD compartments included a one‐compartment model describing viral growth, death, and drug effect, and a model describing drug effect on QTc prolongation. Edrug represents the PD relationship for hydroxychloroquine (HCQ) plasma concentration (C p). In the in vitro model, Edrug is characterized by a maximum effect (Emax) function Edrug=Emax×CpCp+EC50, whereas for the clinical model it is described using a linear function (Edrug=sl×Cp). CL, clearance; EC50, half‐maximal effective concentration; QTc, corrected QT; V, volume of distribution.
Figure 2
Figure 2
Translational pharmacokinetic/pharmacodynamic (PK/PD) simulation. Simulated scenarios of drug effect on in vitro replication rate based on reported hydroxychloroquine (HCQ) efficacy., , Viral kinetics were estimated from in vitro replication rate of severe acute respiratory syndrome‐coronavirus (SARS‐CoV)‐1 and unbound drug concentration in plasma and lungs were simulated with HCQ PK model., Solid continuous line represents the 50th percentile of the simulated data and shaded areas represent the 95% prediction intervals for median, 2.5th, and 97.5th percentiles obtained from 500 simulated datasets. Dotted horizontal lines represent the baseline level, whereas dashed vertical lines indicate the start of treatment.
Figure 3
Figure 3
Data and model for clinical data. (a) Raw pharmacokinetic (PK) and viral load data. In the PK graph, raw data is shown in red, whereas black and grey lines represent the typical and population plasma PK simulation (n = 200) using the PK model. In vitro half‐maximal effective concentration (EC50s) indicated in the graph were calculated considering total drug using the values reported in Yao et al. In the viral load graph (left), thick lines represent the mean profiles of each group, whereas the thin ones represent the individual profiles. (b) Individual PK plasma profile predicted with the PK model for each patient treated with hydroxychloroquine (HCQ). (c) Visual predictive check of population PK/pharmacodynamic model. The solid continuous line represents the 50th percentile of the observations, dashed lines represent 2.5th and 97.5th percentiles of observations, and shaded areas represent the 95% prediction intervals for median, 2.5th, and 97.5th percentiles obtained from 1,000 simulated datasets. The lower panel shows the proportions of below the limit of quantification values observed (solid line), with 95% prediction variability shown by shaded area. CT, cycle threshold; LLOQ, lower limit of quantification.
Figure 4
Figure 4
Comparison of EC50 values. (a) Comparison of percentage of viral inhibition for hydroxychloroquine (HCQ) by data source, including digitized 48‐hour in vitro data (green), 24‐hour in vitro data (orange) obtained from Yao et al., in vitro data from Liu et al. and Touret et al., and longitudinal clinical data (blue; solid line = available data; dashed line = extrapolated data. Raw data and curves from Yao et al. were digitized and displayed directly in the plot. The model used for these data is shown in the original manuscript and used a sigmoidal concentration‐response function Y=Bottom+Top-Bottom1+10LogEC50-X×HillSlope. For the recently added references (Liu et al. and Touret et al. 10 ), a Hill coefficient equal to 1 was assumed, and the different points for plotting purposes were calculated from the half‐maximal effective concentration (EC50) values provided in the original manuscripts. (b) Table including the EC50 values and in vitro experimental conditions from Yao et al., Liu et al., and Touret et al. , , *Adjusted EC50 was calculated to obtain the total drug value as follows: totaldrug=freedrugfu, where fu = 0.5.
Figure 5
Figure 5
Pharmacokinetic (PK) simulations for optimal dose. (a) Population PK plasma profiles following different twice daily regimens. (b) Population PK plasma profiles following different combinations of loading and maintenance dosing. (c) Proposed dosing schemes with interindividual variability. Hydroxychloroquine (HCQ) concentration is detectable in plasma for up to 21 days. Apparent in vitro half‐maximal effective concentration (EC50s) were adjusted to account for plasma protein binding. QTc, corrected QT.
Figure 6
Figure 6
Efficacy and safety simulations. (a) External validation of the model using original structure and extended structure with immune effect. (b) Predicted proportion of adults with detectable viral loads over time, stratified by regimen. (c) Median simulated proportion of adults with detectable viral loads at the end of treatment, stratified by regimen. (d) Predicted delta corrected QT (QTc; using a baseline QTc of 394 ± 30 SD) for each regimen of interest. PCR, polymerase chain reaction; PKPD, pharmacokinetic pharmacodynamic.
Figure 7
Figure 7
Sensitivity analysis. (a) Raw data of the control arm from the published data from Gautret et al. (blue), and from Cao et al. (yellow). (b) Predicted proportion of adults with detectable viral loads over time assuming different natural course of the disease scenarios (high, low, and mixed baseline) and showing two different treatment options. CT, cycle threshold; PCR, polymerase chain reaction.

Comment in

References

    1. World Health Organization . (2020). Coronavirus disease (COVID‐19) outbreak situation <https://www.who.int/emergencies/diseases/novel‐coronavirus‐2019> (Geneva, Switzerland,2020).
    1. Biot, C. et al. Design and synthesis of hydroxyferroquine derivatives with antimalarial and antiviral activities. J. Med. Chem. 49, 2845–2849 (2006). - PubMed
    1. Yao, X. et al. In vitro antiviral activity and projection of optimized dosing design of hydroxychloroquine for the treatment of severe acute respiratory syndrome Coronavirus 2 (SARS‐CoV‐2). Clin. Infect. Dis. (2020). 10.1093/cid/ciaa237 - DOI - PMC - PubMed
    1. Wang, M. et al. Remdesivir and chloroquine effectively inhibit the recently emerged novel coronavirus (2019‐nCoV) in vitro. Cell Res. 30, 269–271 (2020). - PMC - PubMed
    1. Schrezenmeier, E. & Dorner, T. Mechanisms of action of hydroxychloroquine and chloroquine: implications for rheumatology. Nat. Rev. Rheumatol. 16, 155–166 (2020). - PubMed

MeSH terms