. 2020 Apr 14;11(1):1796.
doi: 10.1038/s41467-020-15520-5.

Transposable elements contribute to cell and species-specific chromatin looping and gene regulation in mammalian genomes

Affiliations

Transposable elements contribute to cell and species-specific chromatin looping and gene regulation in mammalian genomes

Adam G Diehl et al. Nat Commun. .

Abstract

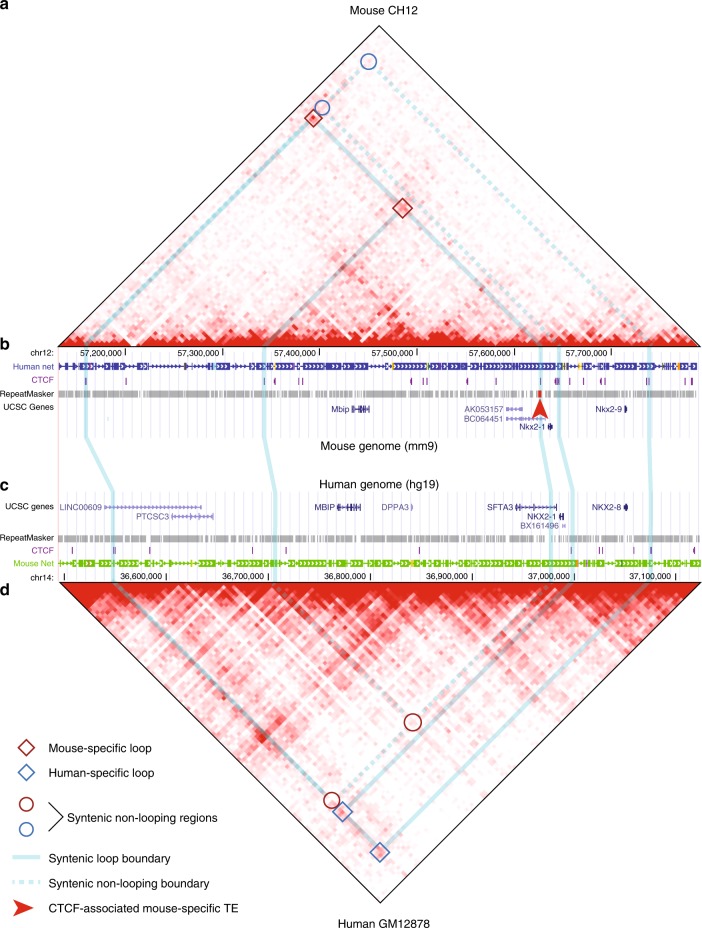
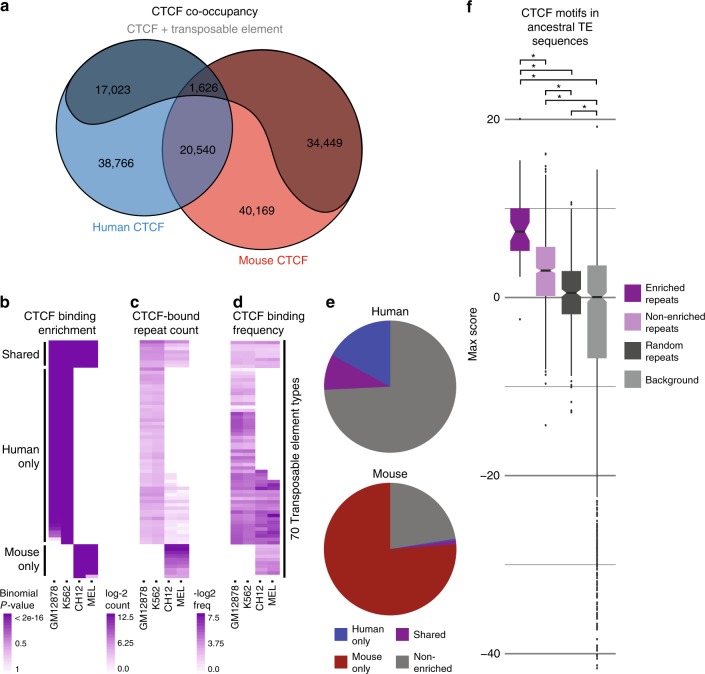
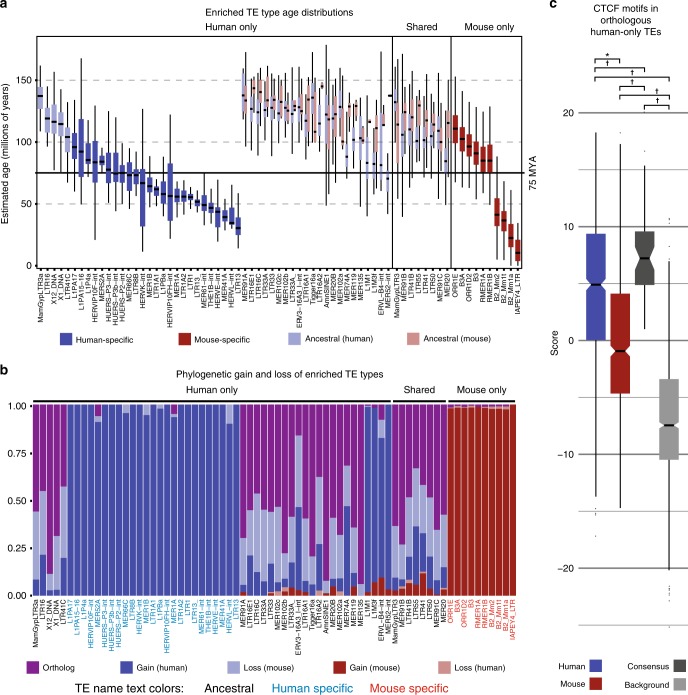
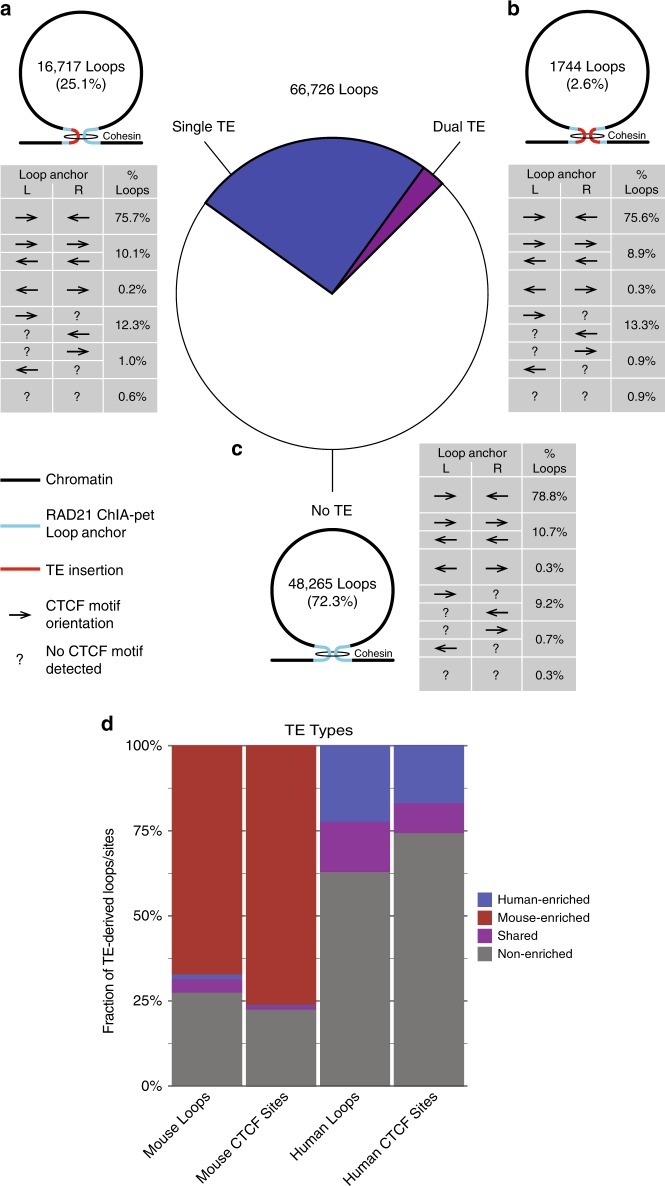
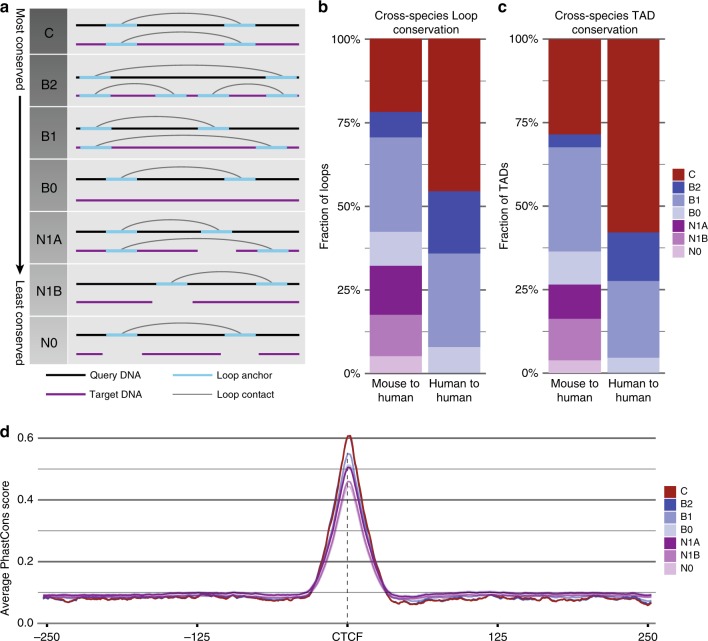
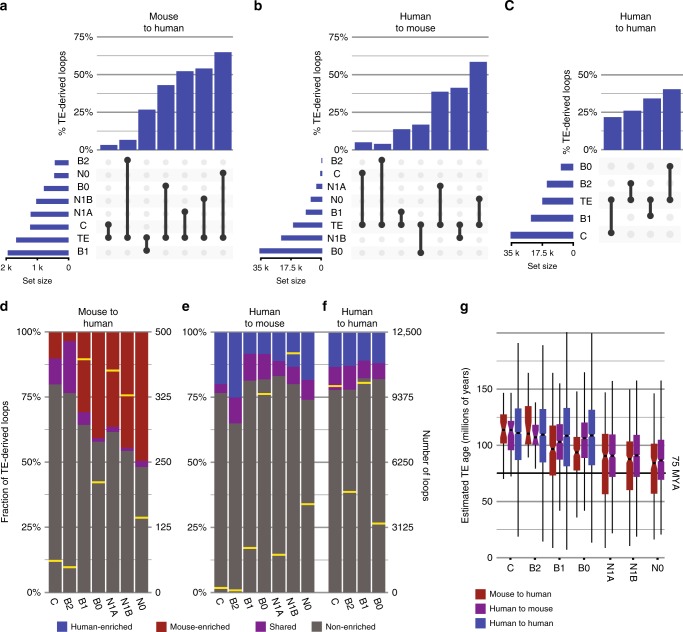
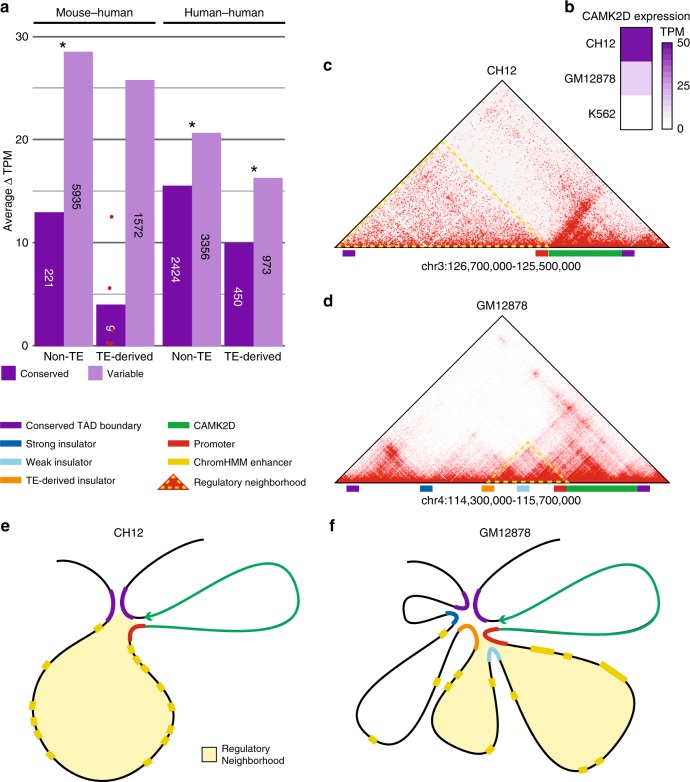
Chromatin looping is important for gene regulation, and studies of 3D chromatin structure across species and cell types have improved our understanding of the principles governing chromatin looping. However, 3D genome evolution and its relationship with natural selection remains largely unexplored. In mammals, the CTCF protein defines the boundaries of most chromatin loops, and variations in CTCF occupancy are associated with looping divergence. While many CTCF binding sites fall within transposable elements (TEs), their contribution to 3D chromatin structural evolution is unknown. Here we report the relative contributions of TE-driven CTCF binding site expansions to conserved and divergent chromatin looping in human and mouse. We demonstrate that TE-derived CTCF binding divergence may explain a large fraction of variable loops. These variable loops contribute significantly to corresponding gene expression variability across cells and species, possibly by refining sub-TAD-scale loop contacts responsible for cell-type-specific enhancer-promoter interactions.


Conflict of interest statement

The authors declare no competing interests.

Figures

Fig. 1
Fig. 1. Transposable element insertions create novel species-specific loop contacts.
A differentially looped syntenic region of mouse chromosome 12 and human chromosome 14, in which the variable loop is anchored at a TE-derived CTCF-binding site. a Hi-C map of the region in mouse CH12 cells. Two mouse-specific loop contacts are indicated by dark red boxes, with their syntenic locations in the human genome indicated by red circles in (d). Blue circles indicate the location of human-specific loops in (d). b Relevant features of the mouse region in the UCSC Genome Browser. The right anchors of both mouse loops are tethered by a CTCF-binding site falling within a mouse-specific ERVK retrotransposon (bright red bar marked by arrowhead). c Relevant features of the orthologous region of the human genome in the UCSC Genome Browser. Syntenic locations of loop anchors observed in mouse and human are connected by vertical blue lines. d Hi-C map for the orthologous human region in GM12878 cells. Blue boxes indicate two human-specific loops, with their syntenic locations indicated by blue circles in (a). Red circles indicate the syntenic locations of mouse-specific loops in (a).
Fig. 2
Fig. 2. CTCF-binding variability is associated with transposable element activity.
a Proportion of CTCF sites in the human and mouse genomes with conserved and divergent binding and their respective transposable element (TE)-derived fractions. Human-specific and mouse-specific fractions include both orthologous and non-orthologous CTCF-binding sites. b Binomial tests recovered 70 TE types significantly enriched for CTCF binding. Enrichments were classified as human-only, mouse-only, or shared based on the cell types in which they were observed. c Cell-wise counts of CTCF-bound copies for each enriched TE type. d Cell-wise percentage of TE copies bound by CTCF for each enriched TE type. e Human and mouse fractions of TE-derived CTCF-binding sites originating from human-enriched, mouse-enriched, shared, and non-enriched TE types. f Log-odds score distributions for the strongest CTCF motif match within consensus of CTCF-enriched and non-enriched TEs, compared with TEs selected randomly from RepBase and length-matched background sequences. Scores above 1 represent sequences with greater than random resemblance to the CTCF motif. Enriched repeats, n = 53; non-enriched repeats, n = 905; random repeats, n = 343; background, n = 958. Boxplots are centered around the median, with upper and lower hinges indicating the first and third quartiles. Upper and lower whiskers extend from the hinge to the largest and smallest values within 1.5× the inter-quartile range from the hinge. Individual data points beyond the ends of the whiskers represent outliers. *One-sided Wilcoxon rank-sum test p-value < = 0.03.
Fig. 3
Fig. 3. Ages and phylogenetic histories of human-only CTCF-enriched TEs support mouse-specific loss-of-function.
a Estimated age distributions for CTCF-bound TE insertions of enriched types. Colors indicate the species-specificity of each TE type and score distributions are split by species where applicable. The solid black horizontal line marks the estimated primate–rodent divergence date. b Fraction of enriched TE insertions inferred as orthologous, or as evolutionary gains or losses on a given branch of the phylogeny. TE label colors indicate whether the given type is ancestral (black), human-specific (blue), or mouse-specific (red). c Maximum CTCF motif scores within human and mouse instances of ancestral, human-only TE types. TE Consensus sequences (a proxy for the ancestral TE sequence, dark gray) and length-matched background sequences (light gray) are shown for comparison. Log-odds scores greater than 1 indicate sequences matching the CTCF motif more than expected by chance. Hypothesis tests were used to assess significance of differences in all pairwise comparisons: *p < = 2.9e−58 (one-sided Wilcoxon signed-rank test), p < = 2.6e−4 (one-sided Wilcoxon rank-sum test). Human, n = 852; mouse, n = 852; consensus, n = 54; background, n = 852. Boxplots in a and c are centered around the median, with upper and lower hinges, indicating the first and third quartiles. Upper and lower whiskers extend from the hinge to the largest and smallest values within 1.5× the inter-quartile range from the hinge. Individual data points beyond the ends of the whiskers represent outliers.
Fig. 4
Fig. 4. Transposable elements and native CTCF-binding sites form functionally equivalent chromatin loop anchors.
Human RAD21 ChIA-PET and mouse Hi-C loops containing CTCF ChIP-seq peaks at both anchors are broken down according to the number of TE-derived anchors they include. Each possible configuration is shown as a pictograph, with associated counts, alongside the central pie chart showing the fraction of all loops contributed by each configuration. Tables show the prevalence of different CTCF motif arrangements for each loop configuration. a Prevalence and CTCF motif arrangements for loops formed between pairs of TE-derived and native anchors. b Prevalence and CTCF motif arrangements for loops formed between pairs of TE-derived anchors. c Prevalence and CTCF motif arrangements for loops formed between anchors not derived from known TE insertions. d Contributions of CTCF-enriched and non-enriched TE types to TE-derived loops and CTCF-binding sites in human and mouse.
Fig. 5
Fig. 5. Conservation classes describe loop co-occurrence patterns across cells and species, and are correlated with underlying phylogenetic conservation.
a Conservation classes describe varying degrees of loop conservation between a query cell and a target cell based on sequence mappability and presence of a loop anchor at the syntenic locus. Diagrams illustrate the possible arrangements when comparing a query loop to a syntenic region in the target cell, with their corresponding conservation class labels. b, c Conservation class assignments from all pairwise comparisons between different cell types were aggregated into human–human and mouse–human comparisons. b Contributions of each conservation class to all chromatin loops. c Contributions of each conservation class to the subset of loops corresponding to known TADs. d Average phastCons conservation scores in 500 bp windows centered at the CTCF ChIP-seq peak summit within human GM12878 loop anchors plotted for each conservation class, with CH12 used as the target cell.
Fig. 6
Fig. 6. Transposon-derived loop anchors contribute disproportionately to species-specific and cell-specific loops.
a UpSet plot showing TE-derived fractions within each conservation class for the comparison of mouse query loops to human target loops. Horizontal bars show the number of loops assigned to each conservation class and the observed number of TEs among query loops. Vertical bars show the fraction of loops derived from TEs within each conservation class, ordered from left to right by decreasing structural conservation. b Same as (a), but between human query loops and mouse target loops. c Same as (a) and (b), but for bidirectional pairwise comparisons between human GM12878 and K562 loops. d Fraction of TE-derived loops contributed by CTCF-enriched TE types in each conservation class for aggregate data from mouse–human comparisons. Yellow bars indicate the number of loops observed in each conservation class (right scale). e Same as (d), but for aggregated data from human–mouse comparisons. f Same as (c) and (d), but for aggregated data from human–human comparisons. g Age distributions of TE insertions found at loop anchors in each conservation class for mouse–human (red), human–mouse (purple), and human–human (blue) comparisons. The estimated rodent–primate divergence date (75MYA) is indicated by a bold horizontal line. Boxplots are centered around the median, with upper and lower hinges, indicating the first and third quartiles. Upper and lower whiskers extend from the hinge to the largest and smallest values within 1.5 × the inter-quartile range from the hinge. Individual data points beyond the ends of the whiskers represent outliers. C: mouse–human, n = 37; human–human, n = 6374; human–mouse, n = 58. B2: mouse–human, n = 26; human–human, n = 3106; human–mouse, n = 20. B1: mouse–human, n = 386; human–human, n = 6126; human–mouse, n = 1149. B0: mouse–human, n = 223; human–human, n = 2029; human–mouse, n = 5200. N1A: mouse–human, n = 394; human–mouse, n = 996. N1B: mouse–human, n = 416; human–mouse, n = 7755. N0: mouse–human, n = 170; human–mouse, n = 2457.
Fig. 7
Fig. 7. TE-derived and native variable loops are associated with variable gene expression.
a Bar plots show average differences in target gene expression, expressed as ΔTPM (see “Methods” for derivation), across species and cell types for conserved and variable enhancer–promoter loops. Loops are defined as “TE-derived”, if one or both of the CTCF sites defining the loop boundaries is embedded within a TE and “native” otherwise. Bars are annotated with the number of contributing observations, with red points indicating observed ΔTPM values for conserved, TE-derived loops in the mouse–human comparison, for which only nine observations were available. *One-sided Wilcoxon p-value < = 0.01. bf A variable enhancer–promoter loop associated with variable CAMK2D gene expression. b CH12, GM12878, and K562 CAMK2D expression in transcripts per million (TPM). c Hi-C plot for the TAD enclosing CAMK2D in mouse CH12 cells. Relevant features are highlighted along the x-axis (see color key). The CAMK2D-regulatory neighborhood (outlined in yellow) extends from the promoter to the distal TAD boundary, and is enriched throughout for enhancer–promoter interactions. d Hi-C plot showing the CAMK2D TAD in human GM12878 cells. Three CTCF-tethered loop anchors appear to act as insulators, dividing the TAD into four distinct subloops. A TE-derived CTCF-binding site insulates the CAMK2D promoter from contact with the two furthest-distal loops, thus restricting the CAMK2D-regulatory neighborhood to two proximal subloops separated by an embedded, native insulator element. Both of these subloops are enriched for enhancer–promoter interactions. e, f Illustration of chromatin loops detected in mouse CH12 (e) and human GM12878 cells (f). Relevant features in both genomes are indicated by colored bars (see color key), and CAMK2D-regulatory neighborhoods are highlighted with light yellow fill. e In CH12 cells, multiple enhancers are free to interact with the CAMK2D promoter, evident as diffuse enrichment within the regulatory triangle in the CH12 Hi-C map (c). f In GM12878 cells, the CAMK2D-regulatory neighborhood is much more restricted. The 5′ boundary is demarcated by a TE-derived CTCF-binding site, which sequesters further-distal enhancers falling within two distal loops, included in the CH12 CAMK2D-regulatory neighborhood, from promoter interactions. The two proximal loops remaining in the regulatory neighborhood contain both multiple enhancer elements (Supplementary Fig. 13H) and an internal insulator element possibly refining enhancer–promoter interactions between loci in both loops.

References

    1. Cremer T, Cremer M. Chromosome territories. Cold Spring Harb. Perspect. Biol. 2010;2:a003889–a003889. doi: 10.1101/cshperspect.a003889. - DOI - PMC - PubMed
    1. Boveri T. Die Blastomerenkerne von Ascaris megalocephala und die Theorie der Chromosomenindividualitat. Arch. fur Zellforsch. 1909;3:181–268.
    1. Rao SSP, et al. A 3D map of the human genome at kilobase resolution reveals principles of chromatin looping. Cell. 2014;159:1665–1680. doi: 10.1016/j.cell.2014.11.021. - DOI - PMC - PubMed
    1. Dixon JR, et al. Topological domains in mammalian genomes identified by analysis of chromatin interactions. Nature. 2012;485:376–380. doi: 10.1038/nature11082. - DOI - PMC - PubMed
    1. Handoko L, et al. CTCF-mediated functional chromatin interactome in pluripotent cells. Nat. Genet. 2011;43:630–638. doi: 10.1038/ng.857. - DOI - PMC - PubMed

Publication types