. 2020 Apr 14;11(1):1795.
doi: 10.1038/s41467-020-15496-2.

Drought alters the biogeochemistry of boreal stream networks

Affiliations

Drought alters the biogeochemistry of boreal stream networks

Lluís Gómez-Gener et al. Nat Commun. .

Abstract

Drought is a global phenomenon, with widespread implications for freshwater ecosystems. While droughts receive much attention at lower latitudes, their effects on northern river networks remain unstudied. We combine a reach-scale manipulation experiment, observations during the extreme 2018 drought, and historical monitoring data to examine the impact of drought in northern boreal streams. Increased water residence time during drought promoted reductions in aerobic metabolism and increased concentrations of reduced solutes in both stream and hyporheic water. Likewise, data during the 2018 drought revealed widespread hypoxic conditions and shifts towards anaerobic metabolism, especially in headwaters. Finally, long-term data confirmed that past summer droughts have led to similar metabolic alterations. Our results highlight the potential for drought to promote biogeochemical shifts that trigger poor water quality conditions in boreal streams. Given projected increases in hydrological extremes at northern latitudes, the consequences of drought for the health of running waters warrant attention.


Conflict of interest statement

The authors declare no competing interests.

Figures
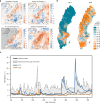
Fig. 1
Fig. 1. The summer 2018 drought in northern Europe.
a Spatial distribution of July 2018 anomalies of the primary factors controlling the water balance of watersheds over Europe (average deviation for July 2018 relative to the monthly average for the period 1979–2018; Source: European Centre for Medium-Range Weather Forecasts (ECMWF), Copernicus Climate Change Service (C3S)). b Comparison of the spatial distribution of summer flow anomalies for 2017 and 2018 over Sweden (daily flow deviation for summer 2017 and 2018 relative to the daily summer flows for the period 1963–1992; Source: Swedish Meteorological and Hydrological Institute (SMHI)). c Summer 2018 streamflow anomaly for a headwater stream in the KCS. The figure shows the median daily discharge and the daily 10th to 90th percentile values during summer between 1985 and 2018 (black solid line and gray shade, respectively). Daily discharge for 2017 and 2018 periods is shown in blue and orange solid lines, respectively.
Fig. 2
Fig. 2. Experimental drought reduced O2 availability and aerobic respiration.
Relationship between stream water residence time and a, dissolved oxygen (O2) concentration in the stream surface and hyporheic water and b, aerobic respiration measured during the summer 2017 drought experiment. Panels c and d present Kernel density plots for hyporheic O2 concentration and whole-stream aerobic respiration rates for drought and background (pre- and post drought) observations, respectively. Differences between drought and background conditions were tested using a nonparametric Wilcoxon Signed-Rank test. Orange and blue colors denote drought and background conditions, respectively. Circles and triangles denote surface and hyporheic water observations, respectively. Solid and dashed lines in panel a are locally weighted regression model fittings (Loess) for surface and hyporheic water observations, respectively. Solid orange lines in b represent the regression model best fitting the observations (r2 = 0.41; p < 0.001, n = 111). The inset plot in panel b shows the segment-averaged aerobic respiration rates along a log-transformed x axis.
Fig. 3
Fig. 3. Experimental drought influenced NH4+:NO3 and CH4:CO2 ratios.
Relationships between the stream water residence time and the molar ratios of a, NH4+:NO3 and b, CH4:O2. Orange and blue colors denote drought and background (pre- and post drought) conditions, respectively. Circles and triangles denote surface and hyporheic water observations, respectively. Solid and dashed lines are locally weighted regression model fittings (Loess) for surface and hyporheic water observations, respectively. Note that crosses denote observations for groundwater well samples. Panels c and d show differences in NH4+:NO3 and CH4:O2 ratios between the surface and hyporheic water, respectively. Box plots display the 25th, 50th, and 75th percentiles; whiskers display minimum and maximum values. Differences between hydrological conditions were tested using a nonparametric Wilcoxon Signed-Rank test.
Fig. 4
Fig. 4. Experimental drought caused stochiometric imbalances between O2 and CO2.
Relationships between the molar departure of stream CO2 and O2 from atmospheric equilibrium (ΔCO2:ΔO2) assessed from a, low-frequency (i.e., grab samples) and b, high-frequency (i.e., sensor data) sampling. Circles and triangles denote surface and hyporheic water observations, respectively (note that panel b is only surface water). Orange and blue colors in panel a denote drought and background (pre- and post drought) hydrological conditions, respectively. Color pattern in panel b indicates changes in stream water residence time (WRT) during the experiment. The black line in panels a and b denotes the theoretical 1:–1 relationship defined for aerobic respiration. Solid and dashed lines in panel a represent the linear regression model for surface and hyporheic observations, respectively, either during drought (orange) or background (blue) conditions. The upper left square in panel a is a reference showing the space of the xy plane captured by high-frequency data in panel b. Additional metrics associated with the analysis of ΔCO2:ΔO2 are presented in Supplementary Table 3.
Fig. 5
Fig. 5. Network-scale drought altered the stream O2 availability.
a Time series of stream-dissolved O2 saturation (%) measured at 10-min intervals in the surface water of 16 stream sites across  the KCS from June 2017 to October 2018 (shaded circles). Colored lines denote daily averages of O2 saturation for different headwater streams (i.e., stream order 1 or 2; catchment area < 1.5 km2; n = 9; Supplementary Fig. 1a, Table 1). Gray lines denote daily averages of dissolved O2 saturation for higher-order streams (i.e., stream order > 2; catchment area > 1.5 km2; n = 7; Supplementary Fig. 1a, Table 1). b Relationship between stream order and dissolved O2 saturation for the same sites during summer 2018. Lines represent nonparametric 10th (lower dashed line), 50th (solid line), and 90th (higher dashed line) percentile regressions for the entire data set.
Fig. 6
Fig. 6. Drought promotes anaerobic signals in boreal headwater streams.
a Relationship between specific discharge (mm d−1) and the molar ratio between CH4 and CO2 in the surface water of five headwater streams of the KCS (i.e., stream order 1 or 2; catchment area < 1.5 km2; n = 5; Supplementary Fig. 1a, Table 1) during the summer period between January 2010 and October 2018. Observations with asterisks correspond to the 2018 drought. Vertical dashed bars represent thresholds among flow conditions during this period. Discharge delineation is based on percentile distributions of the historical (1980–2018) records in the catchment: drought (0th–10th percentile; n = 59), low flow (10th–20th percentile; n = 22), baseflow (20th−50th percentile; n = 90), and high flow (50th–100th percentile; n = 193). Gray lines are the nonparametric 10th and 90th percentile regression based on all of the data. The inset shows locally weighted regression model lines (Loess) for each headwater stream. b Density distributions for CH4:CO2 during drought (orange) and nondrought (blue) hydrological conditions. The dashed line represents the density distribution of stream CH4:CO2 from seven additional headwater catchments in northern Sweden sampled before the summer 2018 severe drought (site locations in Supplementary Fig. 1a).

References

    1. Lu X, et al. Drought rewires the cores of food webs. Nat. Clim. Chang. 2016;6:875–878. doi: 10.1038/nclimate3002. - DOI
    1. Van Loon AF, et al. Drought in the Anthropocene. Nat. Geosci. 2016;9:89–91. doi: 10.1038/ngeo2646. - DOI
    1. Vörösmarty CJ, et al. Global threats to human water security and river biodiversity. Nature. 2010;467:555–561. doi: 10.1038/nature09440. - DOI - PubMed
    1. Wang W, Ertsen MW, Svoboda MD, Hafeez M. Propagation of drought: from meteorological drought to agricultural and hydrological drought. Adv. Meteorol. 2016;2016:1–5.
    1. Keys PW, et al. Invisible water security: moisture recycling and water resilience. Water Secur. 2019;8:100046. doi: 10.1016/j.wasec.2019.100046. - DOI - PMC - PubMed

Publication types