. 2020 Apr 14;11(1):1802.
doi: 10.1038/s41467-020-15549-6.

Limiting oxidative DNA damage reduces microbe-induced colitis-associated colorectal cancer

Affiliations

Limiting oxidative DNA damage reduces microbe-induced colitis-associated colorectal cancer

Thergiory Irrazabal et al. Nat Commun. .

Abstract

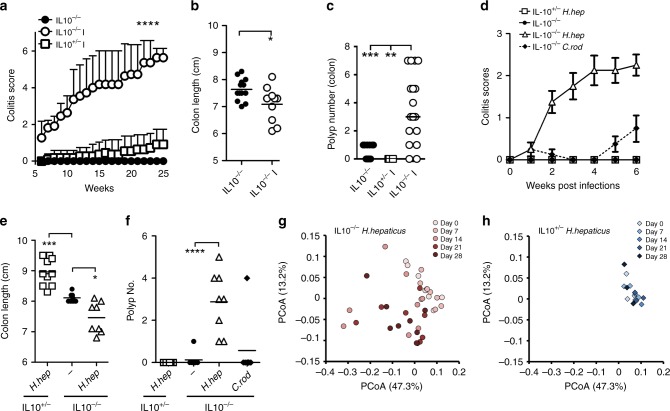
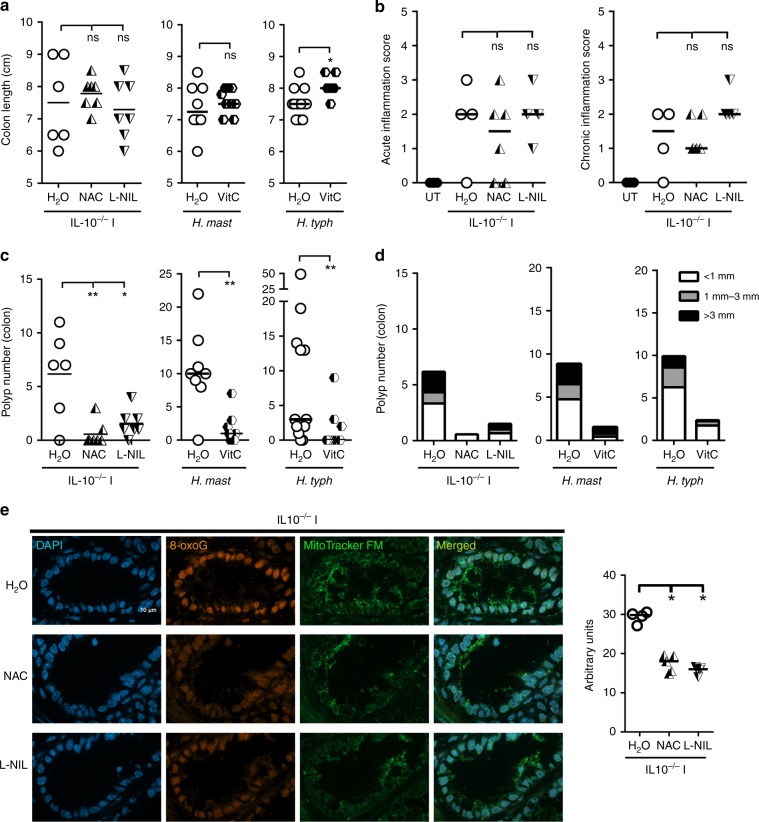
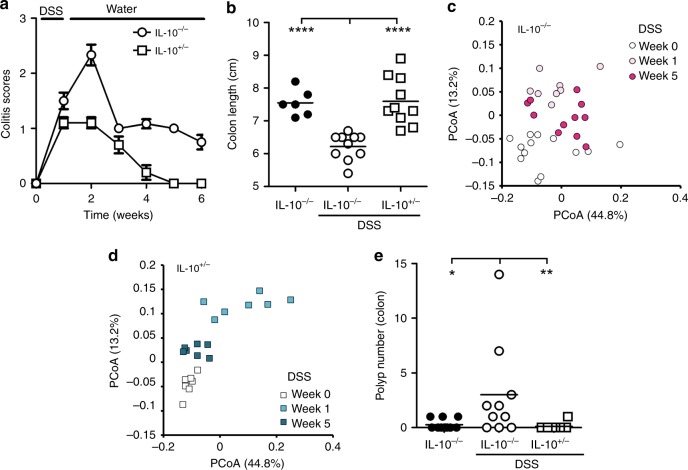
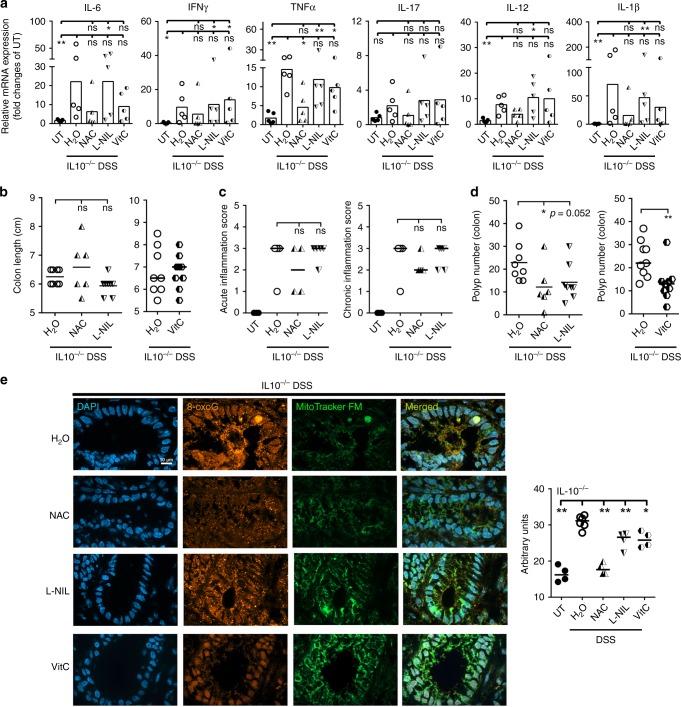
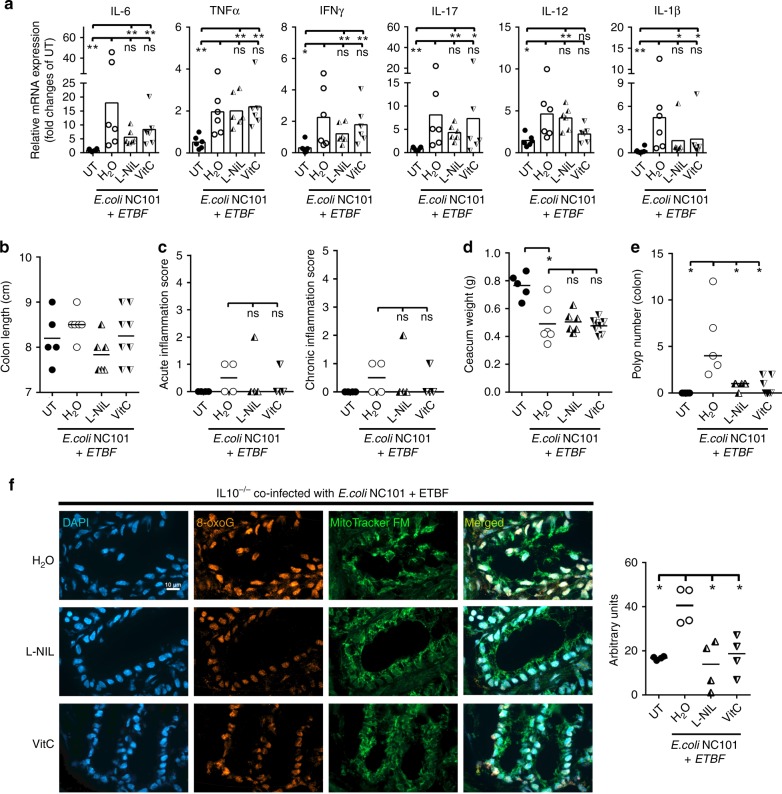
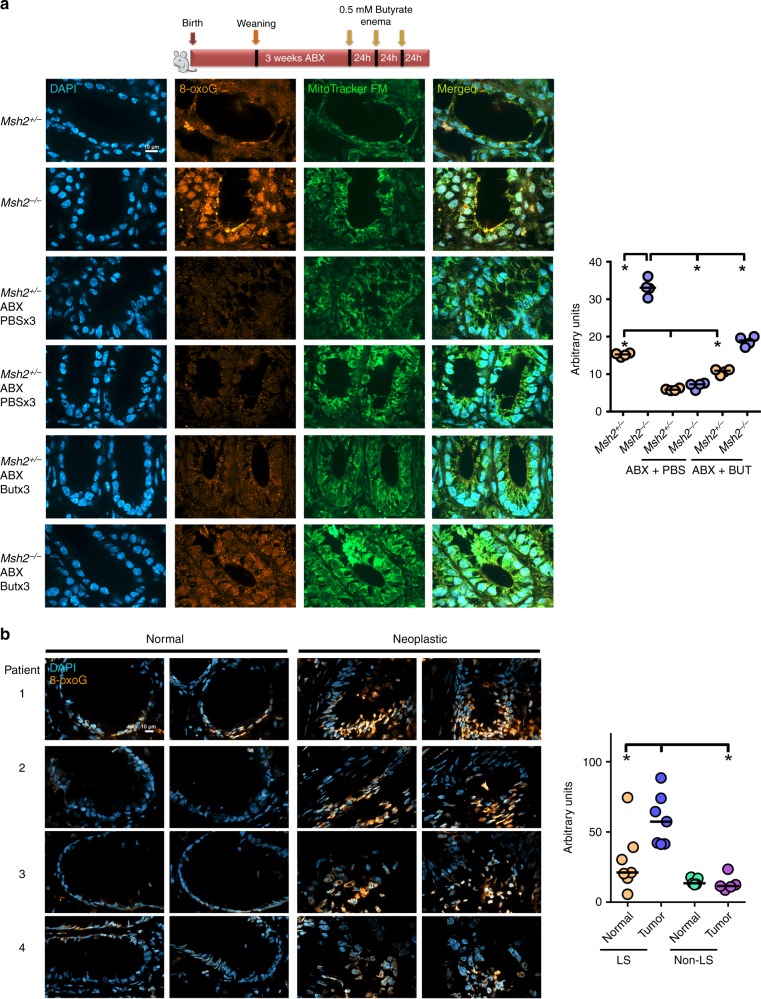
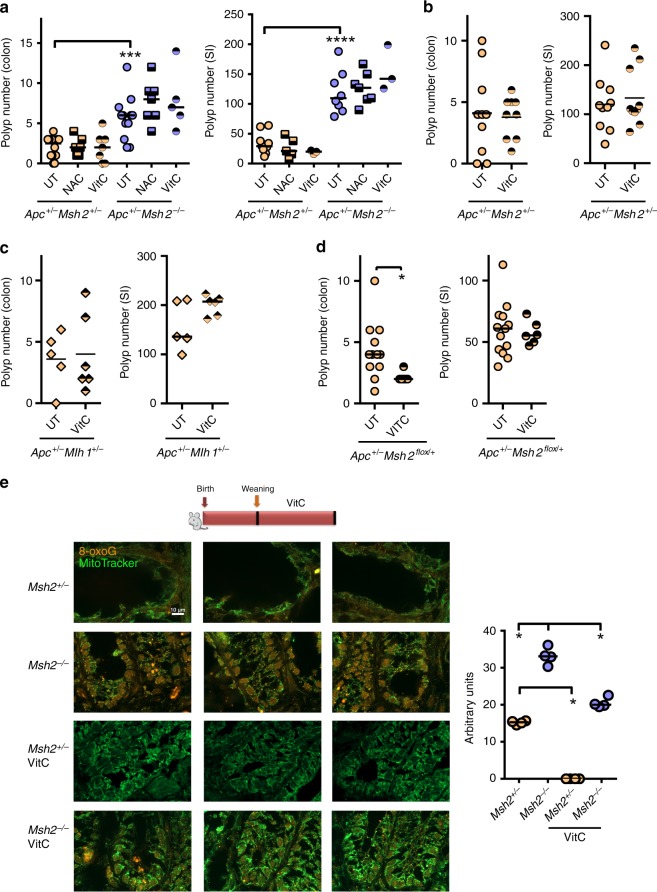
Inflammatory bowel disease patients have a greatly increased risk of developing colitis-associated colon cancer (CAC); however, the basis for inflammation-induced genetic damage requisite for neoplasia is unclear. Using three models of CAC, we find that sustained inflammation triggers 8-oxoguanine DNA lesions. Strikingly, antioxidants or iNOS inhibitors reduce 8-oxoguanine and polyps in CAC models. Because the mismatch repair (MMR) system repairs 8-oxoguanine and is frequently defective in colorectal cancer (CRC), we test whether 8-oxoguanine mediates oncogenesis in a Lynch syndrome (MMR-deficient) model. We show that microbiota generates an accumulation of 8-oxoguanine lesions in MMR-deficient colons. Accordingly, we find that 8-oxoguanine is elevated in neoplastic tissue of Lynch syndrome patients compared to matched untransformed tissue or non-Lynch syndrome neoplastic tissue. While antioxidants reduce 8-oxoguanine, they do not reduce CRC in Lynch syndrome models. Hence, microbe-induced oxidative/nitrosative DNA damage play causative roles in inflammatory CRC models, but not in Lynch syndrome models.


Conflict of interest statement

The authors declare no competing interests.

Figures

Fig. 1
Fig. 1. Helicobacter species induce inflammation, dysbiosis, and colon tumorigenesis in IL10−/− mice.
a Colitis scores for IL10−/− mice compared to IL10−/− (IL10−/−I) and IL10+/− (IL10+/−I) infected with two Helicobacter species: H. typhlonius and H. mastomyrinus. To account for disease, each of the following parameters was given a value of either 0 or 1: stool with excreted mucus, rectal inflammation, rectal prolapse, bloody stool, over 5% weight lost, and moribund, leading to a maximum grade of 6. N = 33 mice were examined. Data are presented as mean values + SEM. Two-way ANOVA p < 0.0001. b Colon length measured in 9-week-old Helicobacter-infected or -uninfected IL10−/− mice. Shortening of the colon is indicative of colitis. N = 30 mice were examined. c Polyp number was analyzed in the colon of 9-week-old Helicobacter-infected (IL10−/− and IL10+/− littermates) or -uninfected IL10−/− mice. N = 35 mice were examined. d 3- or 4-week-old IL10−/− or IL10+/− mice were inoculated by oral gavage with H. hepaticus or C. rodentium, and colitis was monitored for 6 weeks. N = 34 mice were examined. Data are presented as mean values ± SEM. e Colon length measured on 10-week-old mice from the indicated genotypes and treatments. N = 24 mice were examined. f Polyp number was analyzed in the colon of 10-week-old mice from the indicated genotypes and treatments. N = 30 mice were examined. g Principal coordinate analysis of 16 S rRNA gene-sequencing analysis of fecal bacteria obtained from IL10−/− mice infected with H. hepaticus. Fecal samples were obtained before (day 0) and after H. hepaticus infection, for four consecutive weeks. Each dot represents one mouse. N = 8 mice were examined. h Same as g, except that IL10+/− mice were used. N = 3 mice were examined. Data in b, c, e and f were analyzed using the two-sided non-parametric t-test Mann–Whitney; *p < 0.05, **p < 0.01, ***p < 0.001, ****p < 0.0001.
Fig. 2
Fig. 2. Antioxidants reduce Helicobacter-induced 8-oxoG and colon tumorigenesis.
a Colon length measured in 12-week-old Helicobacter-infected IL10−/− mice untreated or treated with L-NIL, NAC, or VitC. IL10−/− I indicates that mice were infected with both H. mastomyrinus and H. typhlonius. N = 57 mice were examined. b Acute and chronic inflammation were assessed histopathologically in Helicobacter-infected or uninfected IL10−/− mice. N = 17 mice were examined. c Polyp number was analyzed in the colon of 12-week-old Helicobacter-infected IL10−/−mice untreated or treated with L-NIL, NAC, or VitC. N = 57 mice were examined. d Polyps counted in c were graded according their size. e Immunofluorescence for 8-oxoG and MitoTracker in colon from Helicobacter-infected IL10−/− mice administered with L-NIL or NAC. Representative images of four independent experiments involving at least one mouse per group are depicted. Magnification 100×. Scale bar = 10 µm. Right panel: one dot represents the median intensity of fluorescence of 40 nuclei per mouse. Data in a, b, c and e were analyzed using the two-sided non-parametric t-test Mann–Whitney; *p < 0.05, **p < 0.01; ns nonsignificant.
Fig. 3
Fig. 3. DSS-treated IL10−/− mice develop colon polyposis and dysbiosis.
a Four-week-old IL10+/− and IL10−/− mice were treated with 1% DSS for 1 week followed by 5 weeks of regular drinking water, and colitis development was monitored as in Fig. 1a. N = 20 mice were examined. Data are presented as mean values ± SEM. b Colon length was measured in 9-week-old mice of the indicated genotypes and treatments. N = 26 mice were examined. c Weighted UniFrac principal coordinate analysis of 16 S rRNA gene-sequencing analysis of fecal bacteria obtained from DSS-treated IL10−/− mice. Fecal samples were obtained before (day 0), 1, and 5 weeks after DSS treatment. N = 13 mice were examined. d Same as c, except that IL10+/− mice were used. N = 7 mice were examined. e Polyp number was analyzed in the colon of 9-week-old mice of the indicated genotypes and treatments. N = 26 mice were examined. Data in b and e were analyzed using the two-sided non-parametric t-test Mann–Whitney; *p < 0.05, **p < 0.01, ****p < 0.0001.
Fig. 4
Fig. 4. Antioxidants reduce DSS-induced oxidative DNA damage and polyposis in IL10−/− mice.
a Four-week-old IL10−/− mice were treated with 1% DSS for 1 week and then administered with water, L-NIL, NAC, or VitC for 4 weeks. cDNA levels of indicated inflammatory cytokines were quantified by qPCR. Relative mRNA expression was normalized to 1 for untreated IL10−/− mice. N = 20 mice were examined. b Colon length was analyzed in 9-week-old mice. N = 39 mice were examined. c Acute and chronic inflammation were assessed histopathologically in the colon of 9-week-old IL10−/− mice with the indicated treatments. N = 16 mice were examined. d Polyp number was analyzed in the colon of 9-week-old mice. N = 40 mice were examined. e Immunofluorescence for 8-oxoG and MitoTracker in colon from DSS-treated IL10−/− mice administered with antioxidants. Representative images of four independent experiments involving at least one mouse per group are depicted. Magnification 100×. Scale bar = 10 µm. Right panel: quantification of 8-oxoG immunofluorescence. One dot represents the median intensity of fluorescence of 40 nuclei per mouse as shown in Supplementary Fig. 4e. All data were analyzed using the two-sided non-parametric t-test Mann–Whitney; *p < 0.05, **p < 0.01; ns nonsignificant.
Fig. 5
Fig. 5. Antioxidants reduce E. coli NC101 + ETBF-induced polyposis in IL10 −/− mice.
a Four-week-old IL10−/− mice were inoculated by oral gavage with E. coli NC101 and ETBF, and treated or untreated with L-NIL or VitC for 8 weeks. cDNA levels of indicated inflammatory cytokines were quantified by qPCR. Relative mRNA expression was normalized to 1 for untreated IL10−/− mice. N = 24 mice were examined. Colon length b, acute inflammation and chronic inflammation c, cecum weight d, and colonic polyp number e were measured in 12-week-old IL10−/− mice of the indicated treatments. N = 25 mice were examined. f Immunofluorescence for 8-oxoG and MitoTracker in colon from E. coli NC101 and ETBF-infected IL10−/− mice administered with L-NIL or VitC. Magnification 100×. Scale bar = 10 µm. Right panel: quantification of 8-oxoG immunofluorescence shown to the left. One dot represents the median intensity of fluorescence of 40 nuclei per mouse as shown in Supplementary Fig. 5c. N = 16 samples were examined over three independent experiments. All data were analyzed using the two-sided non-parametric t-test Mann–Whitney; *p < 0.05, **p < 0.01; ns nonsignificant.
Fig. 6
Fig. 6. The MMR is the dominant repair pathway of the 8-oxoG lesion in mouse and human colon.
a Top panel: schematic outlining the experimental interventions before immunofluorescence against 8-oxoG. Antibiotic cocktail was administered in drinking water for 3 weeks. Butyrate or PBS were administered for three consecutive days. Left panel: immunofluorescence for DAPI, 8-oxoG, and MitoTracker in colon from mice of the indicated treatments and genotypes. Magnification 100×. Scale bar = 10 µm. Right panel: quantification of 8-oxoG immunofluorescence. One dot represents the median intensity of fluorescence of 40 nuclei per mouse as shown in Supplementary Fig. 7a. N = 24 samples were examined over four independent experiments. b Left panel: immunofluorescence for DAPI and 8-oxoG in colon from four Lynch syndrome patients. Magnification 63×. Scale bar = 10 µm. Right panel: quantification of 8-oxoG immunofluorescence are shown for the Lynch patients (b, left panel) and non-Lynch patients (Supplementary Fig. 8b). One dot represents the median intensity of fluorescence of 40 nuclei per patient as shown in Supplementary Fig. 8a. N = 12 biopsies (plus 12 matched normal tissue) were examined over two independent experiments. All data were analyzed using the two-sided non-parametric t-test Mann–Whitney; *p < 0.05.
Fig. 7
Fig. 7. Antioxidants are not effective at reducing CRC in Lynch syndrome mouse models.
a Three-week-old Apcmin/+ Msh2+/− and Apcmin/+ Msh2−/− mice were treated with NAC or VitC for 3 weeks and polyp number was measured in the colon and small intestine (6-week-old mice). N = 50 mice were examined. b Four-week-old Apcmin/+ Msh2+/− mice were treated with VitC for 12 weeks and polyp number was measured in the colon and small intestine. N = 20 mice were examined. c Four-week-old Apcmin/+ Mlh1+/− mice were treated with VitC for 8 weeks and polyp number was measured in the colon and small intestine. N = 11 mice were examined. d Four-week-old Apcmin/+ Msh2flox/+ villin CRE mice were treated with VitC for 12 weeks and polyp number was measured in the colon and small intestine. Each symbol represents the numbers of polyps in one mouse. N = 18 mice were examined. e Left panels: immunofluorescence for 8-oxoG and MitoTracker in colon from mice of the indicated treatments and genotypes. Representative images of four independent experiments, involving one mouse per group are depicted. Magnification 100×. Scale bar = 10 µm. Right panels: quantification of 8-oxoG immunofluorescence shown in left panels. One dot represents the median intensity of fluorescence of 40 nuclei per mouse as shown in Supplementary Fig. 9a. All data were analyzed using the two-sided non-parametric t-test Mann–Whitney; *p < 0.05, ***p < 0.001, ****p < 0.0001.

References

    1. Eaden JA, Abrams KR, Mayberry JF. The risk of colorectal cancer in ulcerative colitis: a meta-analysis. Gut. 2001;48:526–535. - PMC - PubMed
    1. Mittal M, Siddiqui MR, Tran K, Reddy SP, Malik AB. Reactive oxygen species in inflammation and tissue injury. Antioxid. Redox Signal. 2014;20:1126–1167. - PMC - PubMed
    1. Panday A, Sahoo MK, Osorio D, Batra S. NADPH oxidases: an overview from structure to innate immunity-associated pathologies. Cell Mol. Immunol. 2015;12:5–23. - PMC - PubMed
    1. Niles JC, Wishnok JS, Tannenbaum SR. Peroxynitrite-induced oxidation and nitration products of guanine and 8-oxoguanine: structures and mechanisms of product formation. Nitric Oxide. 2006;14:109–121. - PubMed
    1. Tamir S, Burney S, Tannenbaum SR. DNA damage by nitric oxide. Chem. Res. Toxicol. 1996;9:821–827. - PubMed

Publication types

MeSH terms