

Climate change rapidly warms and acidifies Australian estuaries
- PMID: 32286277
- PMCID: PMC7156424
- DOI: 10.1038/s41467-020-15550-z
Climate change rapidly warms and acidifies Australian estuaries
Abstract
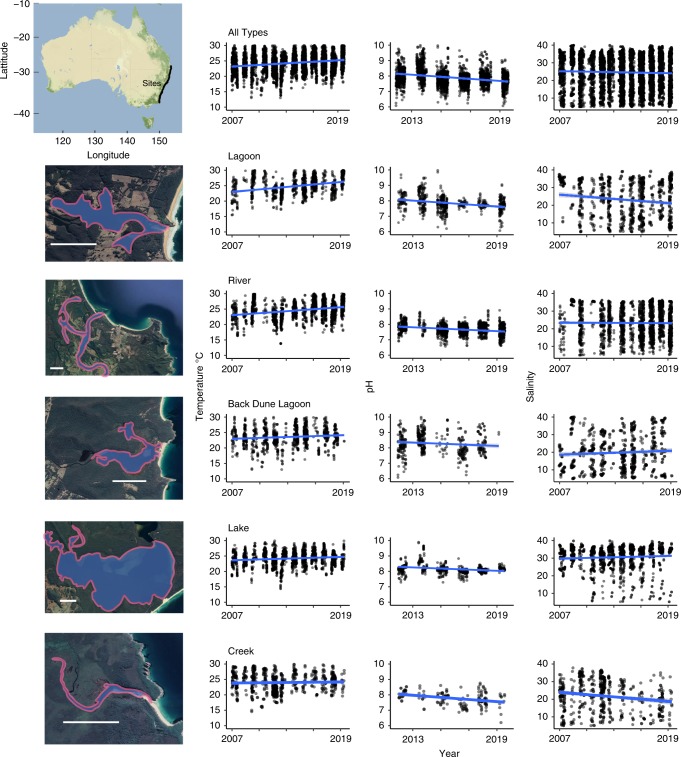
Climate change is impacting ecosystems worldwide. Estuaries are diverse and important aquatic ecosystems; and yet until now we have lacked information on the response of estuaries to climate change. Here we present data from a twelve-year monitoring program, involving 6200 observations of 166 estuaries along >1100 kilometres of the Australian coastline encompassing all estuary morphologies. Estuary temperatures increased by 2.16 °C on average over 12 years, at a rate of 0.2 °C year-1, with waters acidifying at a rate of 0.09 pH units and freshening at 0.086 PSU year-1. The response of estuaries to climate change is dependent on their morphology. Lagoons and rivers are warming and acidifying at the fastest rate because of shallow average depths and limited oceanic exchange. The changes measured are an order of magnitude faster than predicted by global ocean and atmospheric models, indicating that existing global models may not be useful to predict change in estuaries.
Conflict of interest statement
The authors declare no competing interests.
Figures
References
-
- Gillanders BM, et al. Potential effects of climate change on Australian estuaries and fish utilising estuaries: a review. Mar. Fresh. Res. 2011;62:1115–1131. doi: 10.1071/MF11047. - DOI
-
- Hallett CS, et al. Observed and predicted impacts of climate change on the estuaries of south-western Australia, a Mediterranean climate region. Reg. Environ. l Change. 2018;18:1357–1373. doi: 10.1007/s10113-017-1264-8. - DOI
-
- Roy P, et al. Structure and function of south-east Australian estuaries. Estuar. Coas. Shelf Sci. 2001;53:351–384. doi: 10.1006/ecss.2001.0796. - DOI
-
- Scanes, P., Ferguson, A. & Potts, J. in Applications of Paleoenvironmental Techniques in Estuarine Studies (Springer, 2017).
-
- Whitfield A, Elliott M, Basset A, Blaber S, West R. Paradigms in estuarine ecology—a review of the Remane diagram with a suggested revised model for estuaries. Estuar. Coas. Shelf Sci. 2012;97:78–90. doi: 10.1016/j.ecss.2011.11.026. - DOI
LinkOut - more resources
Full Text Sources
