. 2020 Apr 14;11(1):1790.
doi: 10.1038/s41467-020-15569-2.

Alarmin-painted exosomes elicit persistent antitumor immunity in large established tumors in mice

Affiliations

Alarmin-painted exosomes elicit persistent antitumor immunity in large established tumors in mice

Bingfeng Zuo et al. Nat Commun. .

Abstract

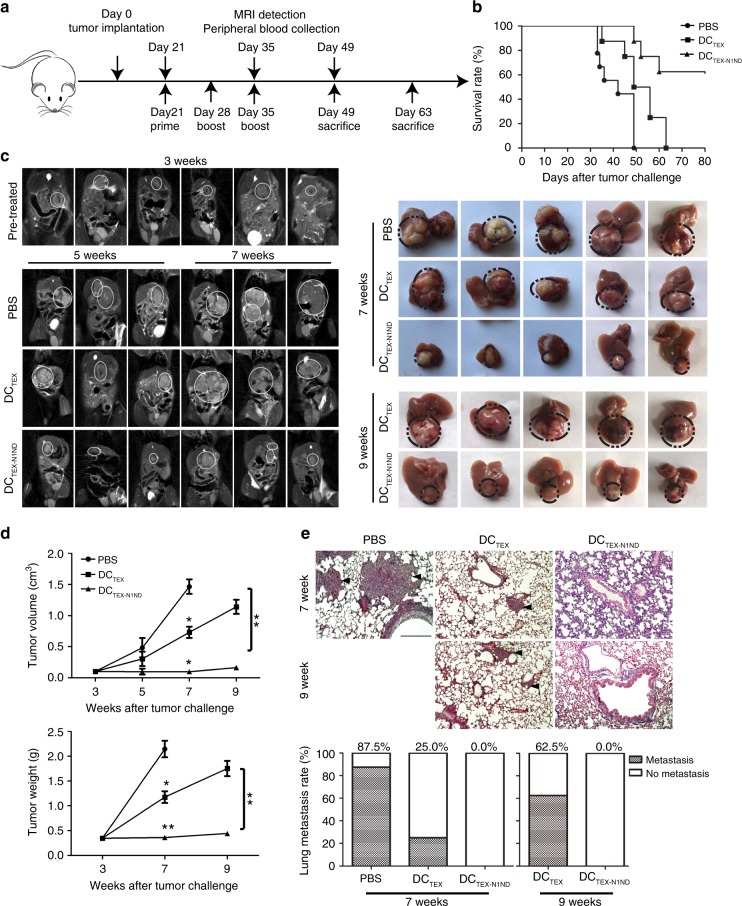
Treating large established tumors is challenging for dendritic cell (DC)-based immunotherapy. DC activation with tumor cell-derived exosomes (TEXs) carrying multiple tumor-associated antigen can enhance tumor recognition. Adding a potent adjuvant, high mobility group nucleosome-binding protein 1 (HMGN1), boosts DCs' ability to activate T cells and improves vaccine efficiency. Here, we demonstrate that TEXs painted with the functional domain of HMGN1 (TEX-N1ND) via an exosomal anchor peptide potentiates DC immunogenicity. TEX-N1ND pulsed DCs (DCTEX-N1ND) elicit long-lasting antitumor immunity and tumor suppression in different syngeneic mouse models with large tumor burdens, most notably large, poorly immunogenic orthotopic hepatocellular carcinoma (HCC). DCTEX-N1ND show increased homing to lymphoid tissues and contribute to augmented memory T cells. Importantly, N1ND-painted serum exosomes from cancer patients also promote DC activation. Our study demonstrates the potency of TEX-N1ND to strengthen DC immunogenicity and to suppress large established tumors, and thus provides an avenue to improve DC-based immunotherapy.


Conflict of interest statement

The authors declare no competing interests.

Figures

Fig. 1
Fig. 1. HMGN1 expression in TEXs and in vitro assessment of TEX-N1ND.
a Western blot analysis for detecting the expression of HMGN1 in TEXs derived from different tumor cells. Total protein (20 μg) was loaded for TEXs. Exosomes from Hela (EXOHela) and DCs (EXODC) were used as positive and negative controls, respectively. CD63 was used as an exosomal marker protein. This experiment was repeated once (two in total). b Quantitative analysis on the binding efficiency of N1ND-CP05 to TEXs. TEXHepa/N1ND or TEXHepa-N1ND represents the mixture of N1ND and TEXs from Hepa1-6 cells (TEXHepa) or the complex of N1ND-CP05 with TEXHepa, respectively. AF680-labeled N1ND-CP05 or N1ND peptide (80 μg) was incubated with PKH67-labeled TEXs (40 μg) for 12 h. Free peptide was removed by diafiltration. NC refers to unlabeled TEXHepa. c Flow cytometric analysis of TEX-N1ND uptake in BMDCs at 24 h after incubation. NC refers to untreated DCs. Levels (d) and quantitative analysis (e) of surface markers and co-stimulatory molecules in BMDCTEX-N1ND, BMDCTEX/N1ND, or BMDCTEX (n = 3; one-way ANOVA post hoc Student–Newman–Keuls test). NC refers to untreated DCs. f Measurement of TNF-α secretion in supernatants of BMDCTEX, BMDCTEX/N1ND, or BMDCTEX-N1ND (n = 4; one-way ANOVA on ranks). g Analysis of IFN-γ and IL-2 in supernatants from splenic T lymphocytes activated by BMDCTEX-N1ND, BMDCTEX/N1ND, or BMDCTEX (n = 4; one-way ANOVA post hoc Student–Newman–Keuls test). h Cytolysis rate against different murine tumor cells with T cells activated by BMDCTEX-N1ND, BMDCTEX/N1ND or BMDCTEX, respectively. A LDH-releasing cytotoxic assay was performed to measure the cytolysis efficiency of effector T cells activated by BMDCTEX-N1ND, BMDCTEX/N1ND, or BMDCTEX, respectively in Hepa1-6, Panc02 (n = 5; one-way ANOVA post hoc Student–Newman–Keuls test) and 4T1 cells (one-way ANOVA on ranks). N refers to the number of individual biological replicate unless otherwise specified. Data are presented as means ± s.e.m. (*p < 0.05; **p < 0.001; n.s not significant). Source data are provided as a Source Data file.
Fig. 2
Fig. 2. Effect of BMDCTEX-N1ND on large subcutaneous tumors.
a Measurement of tumor volume in subcutaneous C57BL/6 HCC mice treated with BMDCTEX-N1ND, BMDCTEX/N1ND, or BMDCTEX (2 × 106 cells once per week for 3 weeks) at day 26 (n = 5; one-way ANOVA on ranks), day 29 (n = 5; one-way ANOVA post hoc Student–Newman–Keuls test), day 32 and day 35 (n = 5; one-way ANOVA on ranks), day 38 (n = 5; one-way ANOVA post hoc Student–Newman–Keuls test) and day 42 (n = 5; one-way ANOVA on ranks). TEXs were derived from murine Hepa1-6 cells. Flow cytometric analysis of different immune cells in blood (b) or tumor tissues (c) from HCC mice treated with BMDCTEX-N1ND, BMDCTEX/N1ND, or BMDCTEX, respectively (n = 4; one-way ANOVA post hoc Student–Newman–Keuls test; n represents the number of animals used for each group). Measurement of tumor volume in syngeneic subcutaneous C57BL/6 pancreatic cancer mice (d) or BALB/C breast cancer mice (e) treated with BMDCTEX-N1ND, BMDCTEX/N1ND, or BMDCTEX (2 × 106 cells once per week for 3 weeks) day 26 (n = 5; one-way ANOVA post hoc Student–Newman–Keuls test), day 29 (n = 5; one-way ANOVA post hoc Student–Newman–Keuls test), day 32, 35, and 42 (n = 5; one-way ANOVA on ranks). TEXs were derived from murine pancreatic or breast cancer cells. Flow cytometric analysis of different immune cells in blood (f) or tumor tissues (g) from subcutaneous tumor mice treated with BMDCTEX-N1ND, BMDCTEX/N1ND, or BMDCTEX (n = 4; one-way ANOVA post hoc Student–Newman–Keuls test). Data are presented as means ± s.e.m. (*p < 0.05; **p < 0.001; n.s not significant). Source data are provided as a Source Data file.
Fig. 3
Fig. 3. Antitumor effect of DCTEX-N1ND in orthotopic HCC mice (H-2b).
Day-21 orthotopic C57BL6 HCC mice were intravenously treated with PBS(black circles), DCTEX (black squares), or DCTEX-N1ND (black triangles) (2 × 106 cells once per week for 3 weeks). a Schematic diagram for the dosing regimen of DCTEX-N1ND in day-21 orthotopic C57BL/6 HCC mice therapeutically. b Survival rate of day-21 orthotopic HCC mice treated with PBS (n = 9), DCTEX (n = 8), or DCTEX-N1ND (n = 8), respectively. c Real-time MRI monitoring and measurement of tumor nodules in day-21 orthotopic HCC mice treated with PBS, DCTEX or DCTEX-N1ND at different time-points. d Analysis of tumor volume and weight from orthotopic HCC mice treated with PBS, DCTEX, or DCTEX-N1ND on week 5 (n = 3), week 7 (n = 11 for PBS; n = 12 for DCTEX and DCTEX-N1ND; one-way ANOVA on ranks), and 9 (n = 11 for DCTEX and n = 12 for DCTEX-N1ND; two-tailed Mann–Whitney U test) (for pretreated controls on week 3, n = 7). The experiments for week 7 and 9 were repeated once (two in total). e Histological examination and quantitative analysis of pulmonary metastasis of HCC in lungs from orthotopic HCC mice treated with PBS, DCTEX, or DCTEX-N1ND on week 7 and 9, respectively (scale bar = 200 μm) (n = 8). Arrowheads point to HCC nodules. Data are presented as means ± s.e.m. (*p < 0.05; **p < 0.001). Source data are provided as a Source Data file.
Fig. 4
Fig. 4. DCTEX-N1ND reshaped orthotopic microenvironment in mice.
a Flow cytometric analysis of CD8+ T lymphocytes in blood and tumor tissues from orthotopic C57BL/6 HCC mice treated with PBS, DCTEX, or DCTEX-N1ND on week 7 (one-way ANOVA post hoc Student–Newman–Keuls test) and 9 (two-tailed t test) (n = 5). b Flow cytometric analysis of CD4+CD25+ Tregs in blood and tumor tissues from orthotopic C57BL/6 HCC mice treated with PBS, DCTEX, or DCTEX-N1ND on week 7 (one-way ANOVA on ranks) and 9 (two-tailed t test) (n = 5). c Immunohistochemistry of CD3+ T cells and Foxp3+ Tregs in tumor sections from different treatment samples to determine the extent of T cell infiltration (scale bar = 100 or 50 μm in magnified images). Arrowheads point to CD3+ or Foxp3+ T cells. This experiment was repeated once (two in total). d Quantification of Foxp3+ T cells in tumor sections from different treatment groups on week 7 (one-way ANOVA on ranks) and 9 (two-tailed Mann–Whitney U test) (n = 3; n represents the number of animals used for each group). e Measurement of IFN-γ in tumor tissues from treated mice with ELISA on week 3 (n = 3), week 7 (n = 5; one-way ANOVA post hoc Student–Newman–Keuls test), and 9 (n = 5; two-tailed t test). f Measurement of immunosuppressive cytokines including TGF-β on week 3 (n = 3), week 7 (one-way ANOVA on ranks), and 9 (two-tailed Mann-Whitney U test) (n = 5) and IL-10 on week 3 (n = 3), 7 (n = 5; one-way ANOVA post hoc Student–Newman–Keuls test), and 9 (n = 5; two-tailed Mann-Whitney U test). N represents the number of animals used for each group. The comparison was conducted between DCTEX-N1ND and DCTEX or PBS groups at the same time-point. Data are presented as means ± s.e.m. (*p < 0.05; **p < 0.001; n.s not significant). Source data are provided as a Source Data file.
Fig. 5
Fig. 5. DCTEX-N1ND augmented memory T cells in orthotopic HCC mice.
Flow cytometric analysis of long-lived memory T cells (a) or TEM cells (b) in blood from day-21 orthotopic HCC mice treated with DCTEX-N1ND, DCTEX or PBS on week 7 (one-way ANOVA on ranks) and 9 (two-tailed t test). CD44hi or CD127hi means CD44high or CD127high, respectively (n = 3). MFI mean fluorescence intensity. Quantitative analysis of long-lived memory T cells (c) or TEM and TCM cells (d) in the spleen from day-21 orthotopic HCC mice treated with DCTEX-N1ND, DCTEX, or PBS on week 7 (one-way ANOVA post hoc Student–Newman–Keuls test) and 9 (two-tailed t test), respectively (n = 5). CD62Lhi represents CD62Lhigh. Flow cytometric analysis of effector and memory T cells (e) or TEM cells (f) in blood from immunized wild-type C57BL/6 mice before tumor challenge (one-way ANOVA post hoc Student–Newman–Keuls test). These mice were immunized intravenously with DCTEX-N1ND, DCTEX (2 × 106 cells once per week for 3 weeks) or PBS, respectively and blood was collected 4 weeks after last immunization before challenge (n = 4). Measurement of tumor growth (g) or tumor volume/weight (h) of immunized C57BL/6 mice at 4 weeks after challenge (n = 4; one-way ANOVA post hoc Student–Newman–Keuls test). i Flow cytometric analysis of effector and memory T cells in tumor tissues from C57BL/6 mice immunized with DCTEX or DCTEX-N1ND 4 weeks after tumor challenge (n = 3; one-way ANOVA on ranks). TILs refer to tumor-infiltrating lymphocytes. j Measurement of tumor growth of day-7 established orthotopic HCC mice treated with memory T cells isolated from DCTEX-N1ND-immunized C57BL/6 mice (n = 5; one-way ANOVA post hoc Student–Newman–Keuls test). DCTEX-N1ND was used as a positive control. Data are presented as means ± s.e.m. (*p < 0.05; **p < 0.001; n.s not significant). Source data are provided as a Source Data file.
Fig. 6
Fig. 6. Effect of DCTEX-N1ND on T cells from DCTEX-N1ND-immunized mice.
C57BL/6 mice were immunized with DCTEX-N1ND (2 × 106 cells once per week for 3 weeks) and splenic memory or naive T cells were isolated from immunized mice 4 weeks after last immunization. a Quantification of TCM and TEM cells in TCM cell populations after the co-incubation of TCM cells with DCTEX-N1ND or DCTEX (3 × 104) for 3 days (n = 3; one-way ANOVA post hoc Student–Newman–Keuls test; n represents the number of animals immunized with DCTEX-N1ND). b Levels of IFN-γ and IL-2 in the culture medium after the co-incubation of TCM cells with DCTEX-N1ND or DCTEX (3 × 104) for 3 days (n = 3; one-way ANOVA post hoc Student–Newman–Keuls test; n represents the number of animals immunized with DCTEX-N1ND). c Analysis of TEM cells and IFN-γ in TEM cell populations stimulated with DCTEX-N1ND or DCTEX (3 × 104), respectively (n = 3; one-way ANOVA post hoc Student–Newman–Keuls test; n represents the number of animals immunized with DCTEX-N1ND). d Analysis of effector T cells (one-way ANOVA on ranks) and IFN-γ (one-way ANOVA post hoc Student–Newman–Keuls test) in naive T cell populations stimulated with DCTEX-N1ND or DCTEX (3 × 104) for 3 or 6 days, respectively (n = 4; n represents the number of animals used for isolation of naive T cells). e Quantification of memory T cells in naive T cell populations after the co-incubation of naive T cells with DCTEX-N1ND or DCTEX (3 × 104) on day 3 and 6, respectively (n = 3; one-way ANOVA post hoc Student–Newman–Keuls test; n represents the number of animals used for isolation of naive T cells). f Tissue distribution and quantification of DiI-labeled DCTEX-N1ND or DCTEX (5 × 106) in orthotopic HCC mice 48 h after single intravenous injection (n = 6; one-way ANOVA on ranks). The ratio is relative to untreated DCs. LN lymph node. g Flow cytometric analysis of DiI-labeled DCTEX-N1ND or DCTEX in orthotopic HCC mice 48 h after single intravenous injection (n = 8; one-way ANOVA post hoc Student–Newman–Keuls test). These experiments were repeated once (two in total). Data are presented as means ± s.e.m. (*p < 0.05; **p < 0.001; n.s not significant). Source data are provided as a Source Data file.
Fig. 7
Fig. 7. TEX-N1ND augmented human DC immunity.
a Western blot analysis for detecting the levels of HMGN1 and AFP expression in serum exosomes derived from normal healthy volunteers and HCC patients. Total protein (20 μg) was loaded and CD63 was used as an exosomal marker protein. This experiment was repeated once (two in total). b Quantitative analysis of levels of HMGN1 (two-tailed t test) and AFP (two-tailed Mann-Whitney U test) in serum exosomes derived from normal healthy volunteers (n = 7) and HCC patients (n = 8). c Cytolysis rate against different human HCC cells with PMDCTEX-N1ND and PMDCTEX. TEXs were derived from HCC patients’ serum. PMDC means peripheral mononuclear-derived dendritic cell. A LDH-releasing cytotoxic assay was performed to measure the cytolysis efficiency of effector lymphocytes activated by PMDCTEX-N1ND or PMDCTEX, respectively (n = 5; one-way ANOVA post hoc Student–Newman–Keuls test except for Hep3B in which one-way ANOVA on ranks was used). Control refers to human PBMC-derived lymphocytes. d Cytolysis rate against human pancreatic and breast cancer cells with PMDCTEX-N1ND and PMDCTEX. TEXs were derived from pancreatic or breast cancer patients’ serum, respectively (n = 10; one-way ANOVA on ranks). These experiments were repeated once (two in total). Data are presented as means ± s.e.m. (*p < 0.05; **p < 0.001; n.s not significant). Source data are provided as a Source Data file.

References

    1. Anguille S, Smits EL, Lion E, van Tendeloo VF, Berneman ZN. Clinical use of dendritic cells for cancer therapy. Lancet Oncol. 2014;15:e257–e267. doi: 10.1016/S1470-2045(13)70585-0. - DOI - PubMed
    1. Bryant CE, et al. Dendritic cells as cancer therapeutics. Semin. Cell Dev. Biol. 2019;86:77–88. doi: 10.1016/j.semcdb.2018.02.015. - DOI - PubMed
    1. Graff JN, Chamberlain ED. Sipuleucel-T in the treatment of prostate cancer: an evidence-based review of its place in therapy. Core Evid. 2015;10:1–10. - PMC - PubMed
    1. Sabado RL, Balan S, Bhardwaj N. Dendritic cell-based immunotherapy. Cell Res. 2017;27:74–95. doi: 10.1038/cr.2016.157. - DOI - PMC - PubMed
    1. Hargadon KM. Strategies to improve the efficacy of dendritic cell-based immunotherapy for melanoma. Front. Immunol. 2017;8:1594. doi: 10.3389/fimmu.2017.01594. - DOI - PMC - PubMed

Publication types

MeSH terms