. 2020 Apr 14;11(1):1775.
doi: 10.1038/s41467-020-15646-6.

Dietary lipids fuel GPX4-restricted enteritis resembling Crohn's disease

Affiliations

Dietary lipids fuel GPX4-restricted enteritis resembling Crohn's disease

Lisa Mayr et al. Nat Commun. .

Abstract

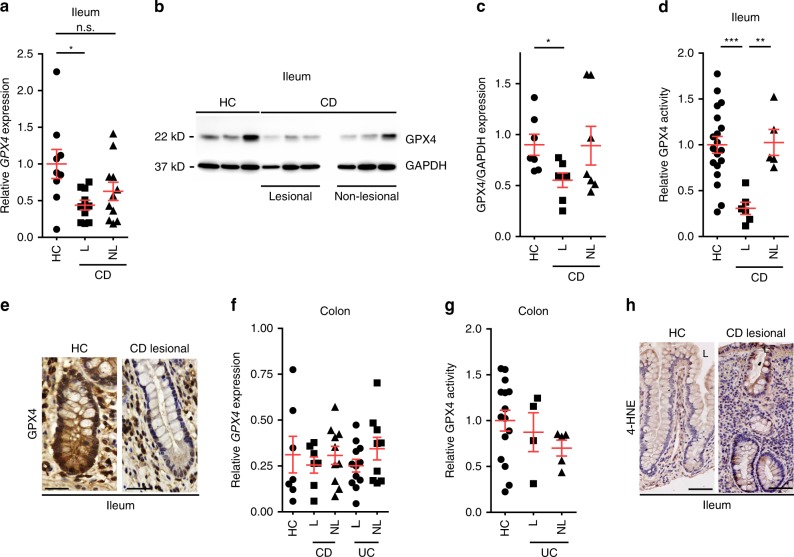
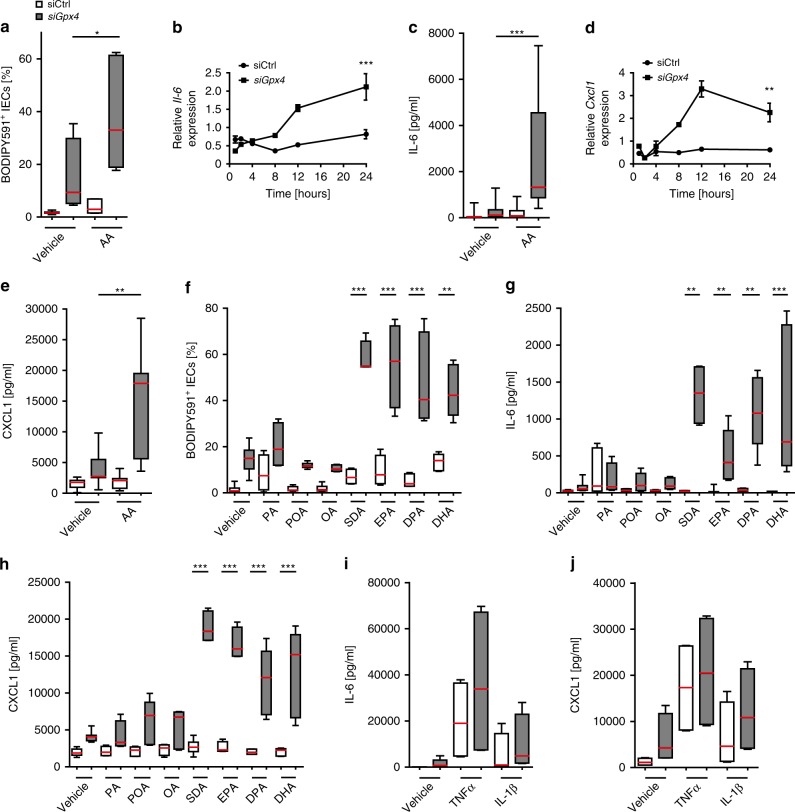
The increased incidence of inflammatory bowel disease (IBD) has become a global phenomenon that could be related to adoption of a Western life-style. Westernization of dietary habits is partly characterized by enrichment with the ω-6 polyunsaturated fatty acid (PUFA) arachidonic acid (AA), which entails risk for developing IBD. Glutathione peroxidase 4 (GPX4) protects against lipid peroxidation (LPO) and cell death termed ferroptosis. We report that small intestinal epithelial cells (IECs) in Crohn's disease (CD) exhibit impaired GPX4 activity and signs of LPO. PUFAs and specifically AA trigger a cytokine response of IECs which is restricted by GPX4. While GPX4 does not control AA metabolism, cytokine production is governed by similar mechanisms as ferroptosis. A PUFA-enriched Western diet triggers focal granuloma-like neutrophilic enteritis in mice that lack one allele of Gpx4 in IECs. Our study identifies dietary PUFAs as a trigger of GPX4-restricted mucosal inflammation phenocopying aspects of human CD.


Conflict of interest statement

The authors declare no competing interests.

Figures

Fig. 1
Fig. 1. Reduced GPX4 activity and LPO localize to IECs in CD patients.
a Relative GPX4 expression in the macroscopically inflamed (lesional, L) and macroscopically non-inflamed (non-lesional, NL) small intestinal mucosa of CD patients determined by qPCR and compared to healthy controls (HC). Each dot represents one patient (n = 9 for HC, n = 11 for CD-L, and n = 10 for CD-NL). *P = 0.0167. b, c Representative GPX4 immunoblot of IEC-enriched fractions from biopsies taken from the ileum of CD patients and HC (b), with densitometry relative to GAPDH shown in (c). Each dot represents one patient (n = 7 patients per group). *P = 0.0265. d Relative GPX4 enzymatic activity of epithelial-enriched fractions derived from the lesional (L) and non-lesional (NL) mucosa of the small intestine of CD patients as compared to HC. Each dot represents one patient (n = 19 for HC, n = 6 for CD-L, and n = 5 for CD-NL). ***P < 0.001, **P < 0.01. e Representative GPX4 immunoreactivity (brown) determined in the lesional small intestinal sections of CD patients as compared to HC (n = 7). f Relative GPX4 expression in the macroscopically inflamed (lesional, L) and non-inflamed (non-lesional, NL) mucosa of the large intestine of CD patients and UC patients as compared to HC. Each dot represents one patient (n = 7 for HC, n = 9 CD-L, n = 10 for CD-NL, n = 12 for UC-L and n = 7 for UC-NL). g Quantification of GPX4 enzymatic activity in lesional and non-lesional IEC-enriched fractions from the large intestine of UC as compared to HC. Each dot represents one patient (n = 15 for HC, n = 4 for UC-L, and n = 5 for UC-NL). h 4-HNE immunoreactivity (brown) in HC and small intestinal lesional sections of CD patients, indicative for LPO. L, luminal-oriented side (n = 3 patients per group). Scale bars indicate 25 µm (e) and 50 µm (h). For panel (a), (c), (d), (f), and (g) data are presented as mean±SEM. One-way ANOVA with Bonferroni’s multiple comparison test. Source data are provided as a Source Data file.
Fig. 2
Fig. 2. PUFAs trigger epithelial LPO and an inflammatory response restricted by GPX4.
a LPO quantification by flow cytometry of BODIPY581/591 C11+-labeled IECs stimulated with arachidonic acid (AA) for 24 h (n = 6 biologically independent experiments). *P = 0.0183. b, c Quantification of IL-6 expression from siGpx4 and siCtrl IECs over a course of AA stimulation determined by qPCR (n = 4 biologically independent experiments), ***P<0.001 (b), and after 24 h by ELISA (n = 12 for vehicle and n = 24 for AA biologically independent experiments). ***P < 0.001 (c). d, e Quantification of CXCL1 expression from siGpx4 and siCtrl IECs over a course of AA stimulation determined by qPCR (n = 3 biologically independent experiments). **P = 0.001 (d) and after 24 h by ELISA (n = 12 for vehicle and n = 24 for AA), **P = 0.0031 (e). f LPO quantification by flow cytometry of BODIPY581/591 C11+-labeled IECs stimulated with the saturated fatty acid palmitic acid (PA), monounsaturated fatty acids palmitoleic acid (POA) and oleic acid (OA) and polyunsaturated fatty acids stearidonic acid (SDA), eicosapentaenoic acid (EPA), docosapentaenoic acid (DPA) and docosahexaenoic acid (DHA) for 24 h (n = 4–12 biologically independent experiments) For all: ***P < 0.001 and **P<0.01 (g, h). Quantification of IL-6 and CXCL1 expression from siGpx4 and siCtrl IECs stimulated with PA, POA, OA, SDA, EPA, DPA, and DHA for 24 h by ELISA (n = 4–11 biologically independent experiments). ***P < 0.001 and **P < 0.01. i, j Quantification of IL-6 and CXCL1 production from siGpx4 and siCtrl IECs stimulated with TNFα or IL-1β for 24 h by ELISA (n = 4 biologically independent experiments). For panel (a), (c) and (ej) data are presented as boxblot with median and interquartile range (25th and 75th). The whiskers represent minimal and maximal values. For panel (b) and (d) data presented as mean ± SEM. For panel (aj) to (j) one-way ANOVA with Bonferroni multiple comparison test or a Kruskal–Wallis test with Dunn’s multiple comparison test was used with the exception of panel (b) and (d) for which a two-way ANOVA with Bonferroni post-hoc test was used and panel (f) and (g) for which an unpaired two-tailed Student’s t test was used. Source data are provided as a Source Data file.
Fig. 3
Fig. 3. PUFA enrichment of a Western diet induces focal enteritis in Gpx4+/−IEC mice.
a Representative small intestinal H&E images of Gpx4+/−IEC mice and WT littermates on a chow diet (n = 10 mice per group). Scale bars indicate 100 µm. b Representative H&E images of WT and Gpx4+/−IEC mice exposed to a low-fat diet (LFD), a Western diet (WD) or a PUFA-enriched WD (PUFA WD) for 3 months. Note that the PUFA WD evoked focal enteritis characterized by mono- and polymorphonuclear cell infiltration, crypt hyperplasia, and mucosal injury in Gpx4+/−IEC mice (n = 8 mice for WT LFD, n = 9 mice for Gpx4+/−IEC LFD, n = 7 mice for WT WD, n = 10 mice for Gpx4+/−IEC WD, n = 9 mice for WT PUFA WD and n = 11 mice for Gpx4+/−IEC PUFA WD). Scale bars indicate 100 µm. c Granuloma-like accumulation of inflammatory cells and submucosal infiltration of inflammatory cells in Gpx4+/−IEC mice exposed to a PUFA-enriched WD for 3 months (red arrows) (n = 11). Scale bars indicate 100 µm. d Histology score of WT and Gpx4+/−IEC mice exposed to a low-fat diet (LFD), a Western diet (WD) or a PUFA-enriched WD (PUFA WD) for 3 months. Each dot indicates one experimental animal (n = 8 mice for WT LFD, n = 9 mice for Gpx4+/−IEC LFD, n = 7 mice for WT WD, n = 10 mice for Gpx4+/−IEC WD, n = 9 mice for WT PUFA WD and n = 11 mice for Gpx4+/−IEC PUFA WD). Median shown, ***P < 0.001. One-way ANOVA with Bonferroni’s multiple comparison test. e Representative 4-HNE immunoreactivity (brown), indicative for LPO (n = 5 mice per group). Scale bars indicate 100 µm. f Relative Cxcl1 expression determined by qPCR (n = 4 mice for WT LFD, n =  6 mice for Gpx4+/−IEC LFD, n=4 mice for WT WD, n = 6 mice for Gpx4+/−IEC WD, n=8 mice for WT PUFAWD, and n = 11 mice for Gpx4+/−IEC PUFA WD). *P = 0.0288. One-way ANOVA with Bonferroni correction. g Representative images of MPO+ cells in Gpx4+/−IEC and WT mice on a PUFA-enriched WD (n = 5 mice per group). The red arrows denote granuloma-like lesions with MPO+ cells (brown) intermingled between crypts marked with asterisks. Scale bars indicate 50 µm and 100 µm, respectively. h Representative confocal images of GR-1+ neutrophils (red) in Gpx4+/−IEC and WT mice on a PUFA-enriched WD (n = 4 mice per group). DAPI stained nuclei blue. Dashed line denotes basal membrane; L, luminal-oriented side. Asterisks denote crypt units. Scale bars indicate 50 µm. i Leukocyte count and neutrophil granulocyte count from whole blood samples of Gpx4+/−IEC and WT mice after a 3-month PUFA-enriched WD (Left panel n = 11 mice, right panel n = 11 mice for WT and n = 12 mice for Gpx4+/−IEC). *P = 0.0361, ***P < 0.001. Unpaired two-tailed Student’s t test. Source data are provided as a Source Data file.
Fig. 4
Fig. 4. Iron availability, lipoxygenases and LPO control PUFA-induced cytokine production.
a LPO quantification after 24 h stimulation with AA and ferric iron (5 µM Fe(III) sulfate) or vehicle (n = 6 biologically independent experiments). *P = 0.0234. b, c Quantification of IL-6 and CXCL1 in the supernatant from siGpx4 and siCtrl IECs stimulated with AA and ferric iron or vehicle for 24 h (n = 4 biologically independent experiments).*P = 0.0479 for (b) and *P=0.0259 for (c). d, e Quantification of IL-6 and CXCL1 in the supernatant from siGpx4 and siCtrl IECs stimulated with AA and deferoxamine (DFO) or vehicle (n = 6 biologically independent experiments). ***P < 0.001 for (d) and (e). f LPO quantification by flow cytometry of BODIPY581/591 C11+-labeled IECs after 24 h stimulation with AA and α-tocopherol (α-toco) or vehicle (n = 6 biologically independent experiments). *P = 0.0199. g, h Quantification of indicated cytokines in the supernatant from siGpx4 and siCtrl IECs after 24 h AA stimulation co-treated with LPO scavengers (n = 6 biologically independent experiments in (g) and n = 4 biologically independent experiments in (h)). ***P < 0.001. i, j Cytokine quantification in the supernatant of siGpx4 and siCtrl IECs after 24 h AA stimulation and treatment with selective LOX inhibitors (n = 5 for vehicle and n = 3 for indicated inhibitors; biologically independent experiments). *P < 0.05, **P < 0.01, ***P < 0.001. k Quantification of CXCL1 in the supernatant from siGpx4 and siAlox12 or siAlox15 co-silenced IECs stimulated with AA (20 µM) for 24 h (n = 4 biologically independent experiments). ***P < 0.001. Data are presented as boxblot with median and interquartile range (25th and 75th). The whiskers represent minimal and maximal values. One-way ANOVA with Bonferroni’s multiple comparison test or Kruskal–Wallis Test with Dunn’s multiple comparison test was used. Source data are provided as a Source Data file.
Fig. 5
Fig. 5. AA and ferric maltol induce neutrophilic inflammation in Gpx4+/−IEC mice.
a Representative confocal microscopy images of 4-HNE-labeled organoids (green) from indicated genotypes after stimulation with AA and ferric iron or vehicle for 24 h. Scale bars indicate 20 µm (n = 3 biologically independent samples). b Cxcl1 expression after 48 h AA and ferric iron stimulation of indicated organoids determined by qPCR (n=11 biologically independent samples). Data are presented as boxblot with median and interquartile range (25th and 75th). The whiskers represent minimal and maximal values. *P = 0.0303. c Model of arachidonic acid and ferric maltol gavage. d, e Representative H&E images (d) and histology score (e) of indicated genotypes orally exposed to ferric maltol and/or AA as indicated in (c). The red arrows denote neutrophils. Scale bars indicate 100 µm and 50 µm, respectively. Each dot represents one experimental animal (n = 8 mice for WT AA, n = 7 mice for Gpx4+/−IEC AA, n = 7 mice for WT FM, n = 7 mice for Gpx4+/−IEC FM and n = 18 mice for WT AA+FM and n = 25 mice for Gpx4+/−IEC AA+FM). ***P < 0.001. f Neutrophilic infiltration of GR1+ neutrophils by flow cytometry of indicated genotypes from the experiment shown in (c). Each dot represents one experimental animal (n = 6 WT mice and n = 5 Gpx4+/−IEC mice). *P = 0.0228. g Representative images of 4-HNE immunoreactivity (brown), indicative for LPO (n = 5 mice per group). Scale bars indicate 100 µm. h Quantification of Cxcl1 expression determined by qPCR in intestinal epithelial scrapings of indicated genotypes from the experiment shown in (c). Each dot represents one experimental animal (n = 10 mice per group). P = 0.0435. Mann–Whitney test. i Histology score of AA- and ferric maltol-exposed mice with or without α-tocopherol supplementation [0.4 mg/ml] in drinking water over the course of the experiment. Each dot represents one experimental animal (n = 4 mice for WT + vehicle, n = 7 mice for WT + α-toco, n = 9 mice for Gpx4+/−IEC + vehicle and n = 8 mice for Gpx4+/−IEC + α-toco). P = 0.0302. j Enteritis histology score of WT and Gpx4+/−IEC mice exposed to a PUFA-enriched WD (PUFA WD) for 3 months with and without α-tocopherol supplementation [0.4 mg/ml] in drinking water over the course of the experiment. Each dot represents one experimental animal. Median shown (n = 9 mice for WT PUFA WD + vehicle, n = 14 mice for Gpx4+/−IEC PUFA WD + vehicle, n = 9 mice PUFA WD + α-toco). **P < 0.01. k Enteritis histology score of WT and Gpx4+/−IEC mice exposed to a PUFA-enriched WD (PUFA WD) for 3 months with and without liproxstatin-1 treatment intraperitoneally from 6 weeks [10 mg/kg] until the closure of the experiment. Each dot represents one experimental animal. Median shown (n = 5 mice for WT PUFA WD + vehicle, n = 8 mice for Gpx4+/−IEC PUFA WD + vehicle, n = 9 mice PUFA WD + liproxstatin-1). ***P < 0.001. For panel (e), (f), (h), and (i) data are presented as mean±SEM. For panel (b), (f) and (h) unpaired two-tailed Student’s t test and for panel (e) and (ik) one-way ANOVA with Bonferroni’s multiple comparison test was used. Source data are provided as a Source Data file.
Fig. 6
Fig. 6. ACSL4 governs AA-induced cytokine production partly by modulation of AA metabolism.
ac Quantification of LOX (a), COX (b), and P450 (c) AA metabolites in siGpx4 and siCtrl IECs with or without deletion of Acsl4 and AA stimulation for 24 h. Three independent experiments were performed and pooled for metabolite analysis by LC-MS/MS. d, e Quantification of IL-6 and CXCL1 in the supernatant of siGpx4 and siCtrl IECs with or without deletion of Acsl4 and AA stimulation for 24 h (n = 4 biologically independent experiments). ***P < 0.001. f, g Quantification of IL-6 and CXCL1 in siGpx4 and siCtrl IECs after 24 h AA stimulation co-treated with a combination of EETs (0.25 µM of (+/−) 8(9)-EET, (+/−) 11(12)-EET and (+/−) 14(15)-EET) (n = 4 biologically independent experiments). **P = 0.0011 and *P = 0.0242. For panel (dg) data are presented as boxblot with median and interquartile range (25th and 75th). The whiskers represent minimal and maximal values. One-way ANOVA with Bonferroni’s multiple comparison test. Source data are provided as a Source Data file.

References

    1. Stockwell BR, et al. Ferroptosis: a regulated cell death nexus linking metabolism, redox biology, and disease. Cell. 2017;171:273–285. doi: 10.1016/j.cell.2017.09.021. - DOI - PMC - PubMed
    1. Kagan VE, et al. Oxidized arachidonic and adrenic PEs navigate cells to ferroptosis. Nat. Chem. Biol. 2017;13:81–90. doi: 10.1038/nchembio.2238. - DOI - PMC - PubMed
    1. Seiler A, et al. Glutathione peroxidase 4 senses and translates oxidative stress into 12/15-lipoxygenase dependent- and AIF-mediated cell death. Cell Metab. 2008;8:237–248. doi: 10.1016/j.cmet.2008.07.005. - DOI - PubMed
    1. Magtanong L, Ko PJ, Dixon SJ. Emerging roles for lipids in non-apoptotic cell death. Cell Death Differ. 2016;23:1099–1109. doi: 10.1038/cdd.2016.25. - DOI - PMC - PubMed
    1. Ursini F, Maiorino M, Gregolin C. The selenoenzyme phospholipid hydroperoxide glutathione peroxidase. Biochim. Biophys. Acta. 1985;839:62–70. doi: 10.1016/0304-4165(85)90182-5. - DOI - PubMed

Publication types

MeSH terms

Substances