. 2020 Apr 14;7(1):115.
doi: 10.1038/s41597-020-0445-3.

A global database of Holocene paleotemperature records

Darrell Kaufman  1 Nicholas McKay  2 Cody Routson  2 Michael Erb  2 Basil Davis  3 Oliver Heiri  4 Samuel Jaccard  5 Jessica Tierney  6 Christoph Dätwyler  7 Yarrow Axford  8 Thomas Brussel  9 Olivier Cartapanis  5 Brian Chase  10 Andria Dawson  11 Anne de Vernal  12 Stefan Engels  13 Lukas Jonkers  14 Jeremiah Marsicek  15 Paola Moffa-Sánchez  16 Carrie Morrill  17 Anais Orsi  18 Kira Rehfeld  19 Krystyna Saunders  20 Philipp S Sommer  3   21 Elizabeth Thomas  22 Marcela Tonello  23 Mónika Tóth  24 Richard Vachula  25 Andrei Andreev  26 Sebastien Bertrand  27 Boris Biskaborn  26 Manuel Bringué  28 Stephen Brooks  29 Magaly Caniupán  30 Manuel Chevalier  3 Les Cwynar  31 Julien Emile-Geay  32 John Fegyveresi  2 Angelica Feurdean  33 Walter Finsinger  10 Marie-Claude Fortin  34 Louise Foster  35   36 Mathew Fox  37 Konrad Gajewski  38 Martin Grosjean  7 Sonja Hausmann  39 Markus Heinrichs  40 Naomi Holmes  41 Boris Ilyashuk  42 Elena Ilyashuk  42 Steve Juggins  35 Deborah Khider  43 Karin Koinig  42 Peter Langdon  44 Isabelle Larocque-Tobler  45 Jianyong Li  46 André Lotter  47 Tomi Luoto  48 Anson Mackay  49 Eniko Magyari  50 Steven Malevich  6 Bryan Mark  51 Julieta Massaferro  52 Vincent Montade  10 Larisa Nazarova  53 Elena Novenko  54 Petr Pařil  55 Emma Pearson  35 Matthew Peros  56 Reinhard Pienitz  57 Mateusz Płóciennik  58 David Porinchu  59 Aaron Potito  60 Andrew Rees  61 Scott Reinemann  62 Stephen Roberts  36 Nicolas Rolland  63 Sakari Salonen  64 Angela Self  65 Heikki Seppä  64 Shyhrete Shala  66 Jeannine-Marie St-Jacques  67 Barbara Stenni  68 Liudmila Syrykh  69 Pol Tarrats  70 Karen Taylor  60   71 Valerie van den Bos  61 Gaute Velle  72 Eugene Wahl  73 Ian Walker  74 Janet Wilmshurst  75 Enlou Zhang  76 Snezhana Zhilich  77
Affiliations

A global database of Holocene paleotemperature records

Darrell Kaufman et al. Sci Data. .

Erratum in

  • Publisher Correction: A global database of Holocene paleotemperature records.
    Kaufman D, McKay N, Routson C, Erb M, Davis B, Heiri O, Jaccard S, Tierney J, Dätwyler C, Axford Y, Brussel T, Cartapanis O, Chase B, Dawson A, de Vernal A, Engels S, Jonkers L, Marsicek J, Moffa-Sánchez P, Morrill C, Orsi A, Rehfeld K, Saunders K, Sommer PS, Thomas E, Tonello M, Tóth M, Vachula R, Andreev A, Bertrand S, Biskaborn B, Bringué M, Brooks S, Caniupán M, Chevalier M, Cwynar L, Emile-Geay J, Fegyveresi J, Feurdean A, Finsinger W, Fortin MC, Foster L, Fox M, Gajewski K, Grosjean M, Hausmann S, Heinrichs M, Holmes N, Ilyashuk B, Ilyashuk E, Juggins S, Khider D, Koinig K, Langdon P, Larocque-Tobler I, Li J, Lotter A, Luoto T, Mackay A, Magyari E, Malevich S, Mark B, Massaferro J, Montade V, Nazarova L, Novenko E, Pařil P, Pearson E, Peros M, Pienitz R, Płóciennik M, Porinchu D, Potito A, Rees A, Reinemann S, Roberts S, Rolland N, Salonen S, Self A, Seppä H, Shala S, St-Jacques JM, Stenni B, Syrykh L, Tarrats P, Taylor K, van den Bos V, Velle G, Wahl E, Walker I, Wilmshurst J, Zhang E, Zhilich S. Kaufman D, et al. Sci Data. 2020 Jun 15;7(1):183. doi: 10.1038/s41597-020-0515-6. Sci Data. 2020. PMID: 32541861 Free PMC article.
  • Author Correction: A global database of Holocene paleotemperature records.
    Kaufman D, McKay N, Routson C, Erb M, Davis B, Heiri O, Jaccard S, Tierney J, Dätwyler C, Axford Y, Brussel T, Cartapanis O, Chase B, Dawson A, de Vernal A, Engels S, Jonkers L, Marsicek J, Moffa-Sánchez P, Morrill C, Orsi A, Rehfeld K, Saunders K, Sommer PS, Thomas E, Tonello M, Tóth M, Vachula R, Andreev A, Bertrand S, Biskaborn B, Bringué M, Brooks S, Caniupán M, Chevalier M, Cwynar L, Emile-Geay J, Fegyveresi J, Feurdean A, Finsinger W, Fortin MC, Foster L, Fox M, Gajewski K, Grosjean M, Hausmann S, Heinrichs M, Holmes N, Ilyashuk B, Ilyashuk E, Juggins S, Khider D, Koinig K, Langdon P, Larocque-Tobler I, Li J, Lotter A, Luoto T, Mackay A, Magyari E, Malevich S, Mark B, Massaferro J, Montade V, Nazarova L, Novenko E, Pařil P, Pearson E, Peros M, Pienitz R, Płóciennik M, Porinchu D, Potito A, Rees A, Reinemann S, Roberts S, Rolland N, Salonen S, Self A, Seppä H, Shala S, St-Jacques JM, Stenni B, Syrykh L, Tarrats P, Taylor K, van den Bos V, Velle G, Wahl E, Walker I, Wilmshurst J, Zhang E, Zhilich S. Kaufman D, et al. Sci Data. 2020 Jul 16;7(1):246. doi: 10.1038/s41597-020-00584-1. Sci Data. 2020. PMID: 32678108 Free PMC article.
  • Publisher Correction: A global database of Holocene paleotemperature records.
    Kaufman D, McKay N, Routson C, Erb M, Davis B, Heiri O, Jaccard S, Tierney J, Dätwyler C, Axford Y, Brussel T, Cartapanis O, Chase B, Dawson A, de Vernal A, Engels S, Jonkers L, Marsicek J, Moffa-Sánchez P, Morrill C, Orsi A, Rehfeld K, Saunders K, Sommer PS, Thomas E, Tonello M, Tóth M, Vachula R, Andreev A, Bertrand S, Biskaborn B, Bringué M, Brooks S, Caniupán M, Chevalier M, Cwynar L, Emile-Geay J, Fegyveresi J, Feurdean A, Finsinger W, Fortin MC, Foster L, Fox M, Gajewski K, Grosjean M, Hausmann S, Heinrichs M, Holmes N, Ilyashuk B, Ilyashuk E, Juggins S, Khider D, Koinig K, Langdon P, Larocque-Tobler I, Li J, Lotter A, Luoto T, Mackay A, Magyari E, Malevich S, Mark B, Massaferro J, Montade V, Nazarova L, Novenko E, Pařil P, Pearson E, Peros M, Pienitz R, Płóciennik M, Porinchu D, Potito A, Rees A, Reinemann S, Roberts S, Rolland N, Salonen S, Self A, Seppä H, Shala S, St-Jacques JM, Stenni B, Syrykh L, Tarrats P, Taylor K, van den Bos V, Velle G, Wahl E, Walker I, Wilmshurst J, Zhang E, Zhilich S. Kaufman D, et al. Sci Data. 2020 Aug 12;7(1):271. doi: 10.1038/s41597-020-00611-1. Sci Data. 2020. PMID: 32788594 Free PMC article.

Abstract

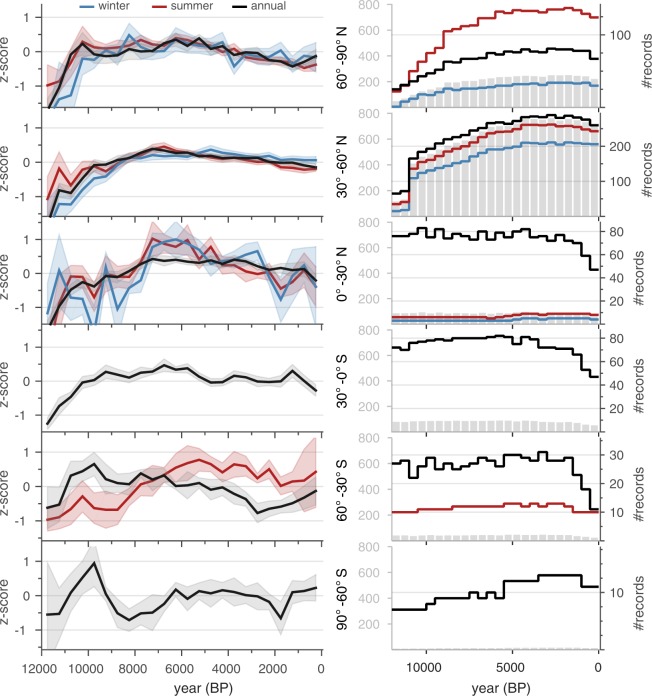
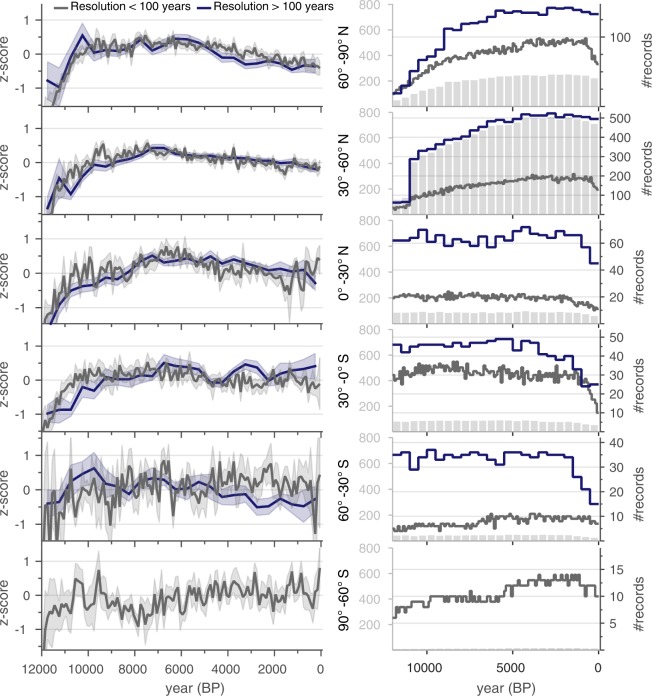
A comprehensive database of paleoclimate records is needed to place recent warming into the longer-term context of natural climate variability. We present a global compilation of quality-controlled, published, temperature-sensitive proxy records extending back 12,000 years through the Holocene. Data were compiled from 679 sites where time series cover at least 4000 years, are resolved at sub-millennial scale (median spacing of 400 years or finer) and have at least one age control point every 3000 years, with cut-off values slackened in data-sparse regions. The data derive from lake sediment (51%), marine sediment (31%), peat (11%), glacier ice (3%), and other natural archives. The database contains 1319 records, including 157 from the Southern Hemisphere. The multi-proxy database comprises paleotemperature time series based on ecological assemblages, as well as biophysical and geochemical indicators that reflect mean annual or seasonal temperatures, as encoded in the database. This database can be used to reconstruct the spatiotemporal evolution of Holocene temperature at global to regional scales, and is publicly available in Linked Paleo Data (LiPD) format.


Conflict of interest statement

The authors declare no competing interests.

Figures

Fig. 1
Fig. 1
Nomenclature used in this data descriptor. This example illustrates one study site where time series are available for three proxy types, each of which is used to infer temperatures for different seasonality. This example shows 1 site where three proxy time series represent five seasonality time series, which we collectively and generally call, records.
Fig. 2
Fig. 2
Spatiotemporal data availability of records in the Temperature 12k database (v. 1.0). (a) Geographical distribution of sites (n = 679) by proxy type, coded by color. (b) Temporal availability by proxy type, coded by colors as shown in (a). Proxy time series (Fig. 1) are represented by only one seasonal (or annual) record for each site, but all proxy types are counted (i.e., some sites include more than one proxy type for the same season; n = 816). Specific proxy types (Suppl. Table 1, ‘proxy’) are either grouped or treated separately (‘Proxy General’) depending on the number of records available. For example, ‘Proxy General’ = ‘other microfossils’ includes ‘Proxy Type’ = dinocysts, foraminifera, diatoms and radiolaria, which together comprise a small number of records and were grouped and separated from the more numerous pollen and chironomid records. ‘Proxy General’ = ‘other biomarkers’ includes TEX86, GDGT, BNA15, LDI, but not alkenones, which are treated separately. ‘Proxy General’ = ‘other ice’ includes boreholes, bubble frequency, gas diffusion, melt-layer frequency, etc., but not isotopes. Refer to Suppl. Table 1 for details. (c) Temporal availability of records by seasons (Suppl. Table 1, ‘Season General’). Both annual and seasonal records from the same site are included (n = 1319).
Fig. 3
Fig. 3
Latitudinal distribution of records. Frequency of records partitioned in 30° latitude bands according to their (a) archive type (Suppl. Table 1, ‘Archive Type’), and (b) temporal resolution (Suppl. Table 1, ‘Resolution’). Only one seasonal (or annual) record is counted for each proxy type from a site. Resolution calculated as the median spacing between consecutive proxy samples of each time series, back to 12,000 years.
Fig. 4
Fig. 4
Major trends according to proxy type. Composites of normalized time series (standard deviation units; includes small portion of uncalibrated, relative proxy records) over the Holocene subdivided by major proxy types (Suppl. Table 1, ‘Proxy Type’). For sites with both annual and seasonal paleotemperature time series, only the annual time series was used (‘Season General’ = ‘annual’ OR ‘summerOnly’ OR ‘winterOnly’). Shading indicates 95% bootstrap confidence intervals with 1000 replicates. Gray bars indicate the number of records per bin. Specific proxy types are combined or treated separately depending on the number of records available (Suppl. Table 1, ‘Proxy General’ and ‘Proxy Type’; see Fig. 2 for explanation).
Fig. 5
Fig. 5
Comparison among summer, winter and annual records. Composites of normalized time series (standard deviation units; includes small portion of uncalibrated, relative proxy records) over the Holocene subdivided by season, binned at 500 years, averaged on an equal-area grid and then averaged over 30° latitude bands. For sites with both annual and seasonal paleotemperature time series, only the annual time series was used (Suppl. Table 1, ‘Season General’ = ‘annual’ OR ‘summerOnly’ OR ‘winterOnly’). Shading indicates 95% bootstrap confidence intervals with 1000 replicates. The column on the right shows the temporal availability for individual time series comprising the composites for each latitude band. Included are the total number of records per bin (gray bars) plotted on the same y-axis scale (left side, gray) across all latitudes, as well as the number of records by category (colored lines) plotted on a variably zoomed y-axis scale (right side).
Fig. 6
Fig. 6
Comparison between records from terrestrial versus marine sites. Composite time series subdivided terrestrial versus marine archives. Marine sites include some terrestrially based proxy types, such as pollen and some biomarkers; these are represented by ‘Climate Variable Detail’ = ‘air@surface’ rather than ‘sea@surface’ (Suppl. Table 1). Symbols and procedures same as for Fig. 5.
Fig. 7
Fig. 7
Comparison between low- and high-resolution records. Composite time series (standard deviation units; left side y-axis) for high-resolution versus low-resolution records binned at 100 and 500 year intervals, respectively. Cut-off between high and low resolution was set as 100 years (median difference between consecutive observations). Symbols and procedures as in Fig. 5.
Fig. 8
Fig. 8
Comparison between calibrated versus uncalibrated records. Composite time series subdivided by records that are either calibrated to temperature (Suppl. Table 1, ‘Units’ = ‘degC’) or uncalibrated (n = 43; standard deviation units). Two calibrated composites are shown: black = annual records only (n = 612); purple = annual plus either summer or winter records for sites where annual records are not available (n = 816). The calibrated composites were placed on a temperature scale (left x-axis) by aligning the mean of each composite with the mean of the global temperature reconstruction from the PAGES 2k Consortium, both over the period 500 and 1500 CE. Red = median of the PAGES 2k multi-method ensemble global mean surface temperature reconstruction binned at 500 years (bold red line) and with 30-year smoothing of annually resolved data (fine red line; data from www.ncdc.noaa.gov/paleo/study/21171). No instrumental data are shown. Symbols and procedures same as for Fig. 5.
Fig. 9
Fig. 9
Zonal representativeness of the proxy network based on instrumental temperature. Scatterplots showing the relation between decadal mean temperature at the proxy locations versus the average of the entire 30° latitudinal zone using gridded instrumental-based temperature reanalysis products: (a) HadCRUT4 dataset,, (www.metoffice.gov.uk/hadobs/hadcrut4) and (b) ERA20C dataset (www.ecmwf.int/en/forecasts/datasets/reanalysis-datasets/era-20c). In the instrumental dataset, the mean temperature at the proxy locations explain between 93% and 100% of the temperature variance in the latitudinal bands. The spread in data represents the overall temperature trend over the 20th century.
Fig. 10
Fig. 10
Zonal representativeness of the proxy network based on modelled temperature. Mid-Holocene minus preindustrial (MH − PI) annual temperature averaged for the proxy locations (y-axis) versus the annual temperature averaged over an entire 30°-wide latitudinal band (x-axis) from 12 PMIP3 climate models (symbols), shown for six latitudinal bands (colors). The proxy network sampled in the models captures the same mid-Holocene annual temperature anomalies as represented by the latitudinal averages. Global-mean values, calculated as the area-weighted mean of the six latitude bands, are shown in the inset. Linear regression of the global-mean values has an R2 of 0.98 and a slope of 0.99. PMIP3 model output is available at esgf-node.llnl.gov/projects/esgf-llnl.

References

    1. Mauri A, Davis BAS, Collins PM, Kaplan JO. The climate of Europe during the Holocene: a gridded pollen-based reconstruction and its multiproxy evaluation. Quat. Sci. Rev. 2015;112:109–127.
    1. Harrison SP, et al. Climate model benchmarking with glacial and mid-Holocene climates. Clim. Dyn. 2014;43:671–688.
    1. Bartlein PJ, et al. Pollen-based continental climate reconstructions at 6 and 21 ka: A global synthesis. Clim. Dyn. 2011;37:775–802.
    1. Viau, A. E., Gajewski, K., Sawada, M. C. & Fines, P. Millennial-scale temperature variations in North America during the Holocene. J. Geophys. Res. Atmospheres111 (2006).
    1. Marcott SA, Shakun JD, Clark PU, Mix AC. A reconstruction of regional and global temperature for the past 11,300 years. Science. 2013;339:1198. - PubMed

Publication types