. 2020 Apr 14;10(1):6423.
doi: 10.1038/s41598-020-62724-2.

Resolving challenges in deep learning-based analyses of histopathological images using explanation methods

Affiliations

Resolving challenges in deep learning-based analyses of histopathological images using explanation methods

Miriam Hägele et al. Sci Rep. .

Abstract

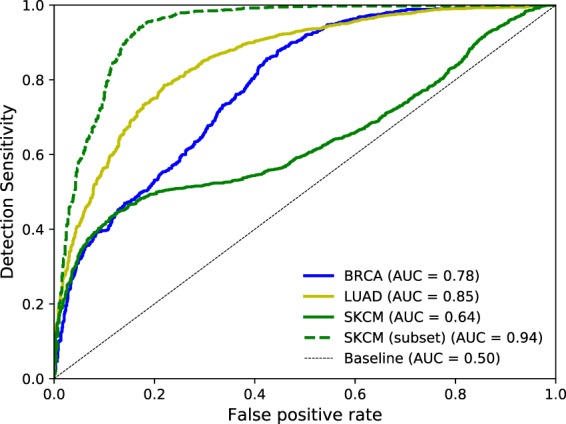
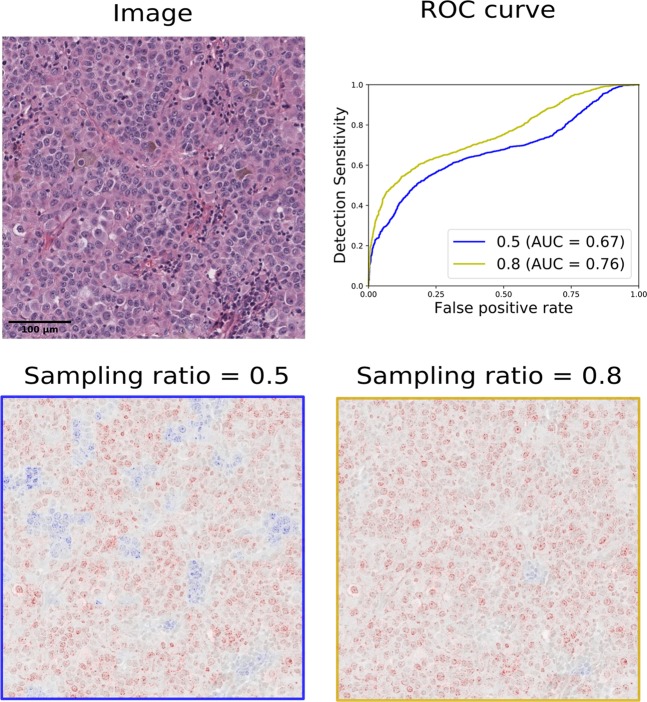
Deep learning has recently gained popularity in digital pathology due to its high prediction quality. However, the medical domain requires explanation and insight for a better understanding beyond standard quantitative performance evaluation. Recently, many explanation methods have emerged. This work shows how heatmaps generated by these explanation methods allow to resolve common challenges encountered in deep learning-based digital histopathology analyses. We elaborate on biases which are typically inherent in histopathological image data. In the binary classification task of tumour tissue discrimination in publicly available haematoxylin-eosin-stained images of various tumour entities, we investigate three types of biases: (1) biases which affect the entire dataset, (2) biases which are by chance correlated with class labels and (3) sampling biases. While standard analyses focus on patch-level evaluation, we advocate pixel-wise heatmaps, which offer a more precise and versatile diagnostic instrument. This insight is shown to not only be helpful to detect but also to remove the effects of common hidden biases, which improves generalisation within and across datasets. For example, we could see a trend of improved area under the receiver operating characteristic (ROC) curve by 5% when reducing a labelling bias. Explanation techniques are thus demonstrated to be a helpful and highly relevant tool for the development and the deployment phases within the life cycle of real-world applications in digital pathology.


Conflict of interest statement

The authors declare no competing interests.

Figures

Figure 1
Figure 1
(A) Exemplary visual explanations (superimposed on grey-scaled H&E stain) for the three studied tumour entities. Red denotes positive relevance, i.e. in favour for the prediction of class cancer, while blue denotes negative relevance, i.e. contradicting the prediction of class cancer. Corresponding annotations can be found in Supplemental Fig. 2–4 (blue boxes). The image details illustrate the high-resolution of the computed heatmaps. (B) Corresponding colourbar for the relevance distribution of cancerous tissue classification, which is used throughout the paper.
Figure 2
Figure 2
Quantitative evaluation of heatmaps: ROC curves for single cell recognition, quantified by their area under the curve (AUC). More specifically, we evaluate the presence of positive relevance on task specific structures (i.e. cancer cells). For more details, please see Section Experiments (Verifying learned features).
Figure 3
Figure 3
Investigating the influence of fixed class sampling ratios in mini-batches on explanation heatmaps, in particular, sampling ratios of 0.5 and 0.8 in favour of class cancer. Heatmaps of the classifier with uniform sampling depicts positive and negative relevance (left) whereas the one of tumour tissue oversampling depicts almost only and slightly more positive relevance. Thus, the higher recall on patch level is also reflected in the heatmaps as additionally demonstrated quantitatively in the ROC curve.
Figure 4
Figure 4
Illustration of the effects of the three studied types of biases on high-resolution explanation heatmaps. These are contrasted against heatmaps of models which are not affected by the biases (right). Dataset bias. This dataset is characterised by a label bias which results from determining the label solely from the patch’s centre cell (yellow mark). The heatmap demonstrates how the network therefore learns to focus on the centre of the patch. Class-correlated bias. Detection of a class related bias in form of a small artificial corruption. The heatmap reveals that the model has based its decision on the bias instead of relevant biological features. High-resolution heatmaps are able to identify these class-correlated biases in a single example and to accurately pinpoint to even very small artefacts. Sample bias. Demonstrating the effect of sampling biases by training a classifier on a dataset lacking examples of necrosis. The presented exemplary tile presents, apart from necrotic tissue (yellow annotations), also cancer cells to show the correct classification of the target class in both cases while the assessment of necrotic tissue differs between the classifiers.
Figure 5
Figure 5
Different granularity levels of visual explanations—from patch level (middle left) to pixel-wise heatmaps (right). The H&E image is split into 9 patches and explanation heatmaps for class cancer are generated by different methods, namely probability map, Grad-CAM and LRP.

References

    1. LeCun Y, Bengio Y, Hinton GE. Deep learning. Nature. 2015;521:436–444. doi: 10.1038/nature14539. - DOI - PubMed
    1. Schmidhuber J. Deep learning in neural networks: An overview. Neural Networks. 2015;61:85–117. doi: 10.1016/j.neunet.2014.09.003. - DOI - PubMed
    1. Szegedy, C. et al. Going deeper with convolutions. In Proceedings of the IEEE conference on computer vision and pattern recognition (CVPR), 1–9 (2015).
    1. Krizhevsky, A., Sutskever, I. & Hinton, G. E. Imagenet classification with deep convolutional neural networks. In Advances in Neural Information Processing Systems (NeurIPS), 1097–1105 (2012).
    1. Litjens G, et al. Deep learning as a tool for increased accuracy and efficiency of histopathological diagnosis. Sci. Rep. 2016;6:26286. doi: 10.1038/srep26286. - DOI - PMC - PubMed

Publication types