

Dried blood spot self-sampling at home is a feasible technique for hepatitis C RNA detection
- PMID: 32287293
- PMCID: PMC7156069
- DOI: 10.1371/journal.pone.0231385
Dried blood spot self-sampling at home is a feasible technique for hepatitis C RNA detection
Abstract
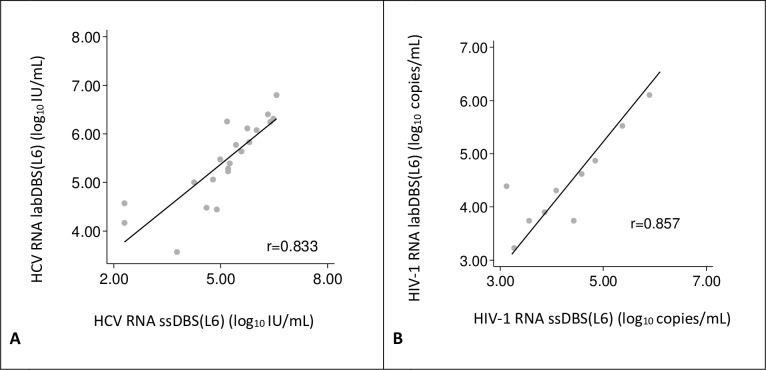
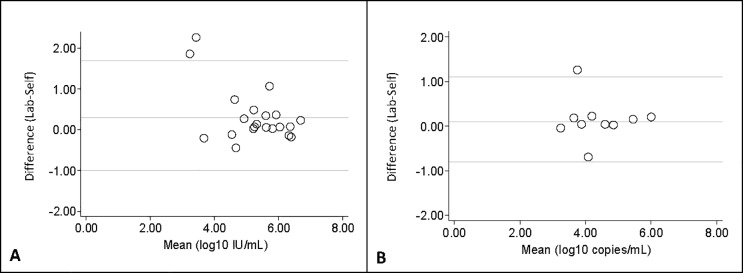
To facilitate HCV diagnosis, we developed an HCV-RNA testing service, which involved home-sampled dried blood spots (DBS). The main objective of this study was to evaluate the feasibility of self-sampling at home. Furthermore, to optimise the processing of DBS samples for RNA detection, we evaluated two elution buffers: phosphate-buffered saline (PBS) and L6-buffer. 27 HCV-RNA and 12 HIV-1 RNA positive patients were included. Laboratory spotted DBS (LabDBS) were made by a technician from blood samples drawn at inclusion. Patients received a DBS home-sampling kit and were requested to return their self-sampled DBS (ssDBS) by mail. We compared the RNA load of PBS and L6-eluted labDBS, and of L6-eluted ssDBS, L6-eluted labDBS and plasma. LabDBS load measurements were repeated after 7-13 and 14-21 days to evaluate RNA stability. All 39 plasma samples provided quantifiable RNA loads. In 1/39 labDBS sample, RNA could not be detected (plasma HCV load: 2.98 log10 IU/ml). L6-eluted samples gave a 0.7 log10 and 0.6 log10 higher viral load for HCV and HIV-1 respectively, compared to PBS-eluted samples. Strong correlations were found between labDBS and ssDBS HCV RNA (r = 0.833; mean difference 0.3 log10 IU/mL) and HIV-1 RNA results (r = 0.857; mean difference 0.1 log10 copies/mL). Correlations between labDBS and plasma values were high for HCV (r = 0.958) and HIV-1 (r = 0.844). RNA loads in DBS remained stable over 21 days. Our study demonstrates that self-sampling dried blood spots at home is a feasible strategy for the detection of HCV and HIV-1 RNA. This could facilitate one-step diagnostics and treatment monitoring in communities with high HCV prevalence.
Conflict of interest statement
I have read the journal's policy and the authors of this manuscript have the following competing interests:TP, FZ and MP report speaker fees and grants from: Gilead Sciences, MSD and AbbVie paid to their institute. AB reports grants from ANRS and SIDACTION, outside the submitted work. SR has no relevant conflicts of interest to report. MvdV’s institute received grants and speaker fees from: Abbvie, Gilead, Johnson & Johnson, MSD, ViiV, outside the submitted work. JS reports nonfinancial support from ROCHE Diagnostics, during the conduct of the study and grants from: Gilead Sciences, MSD, Abbvie, outside the submitted work. This does not alter our adherence to PLOS ONE policies on sharing data and materials.
Figures


References
-
- Grady BP, Vanhommerig JW, Schinkel J, Weegink CJ, Bruisten SM, Lindenburg CE, et al. Low incidence of reinfection with the hepatitis C virus following treatment in active drug users in Amsterdam. European journal of gastroenterology & hepatology. 2012;24(11):1302–7. - PubMed
-
- de Vos AS, van der Helm JJ, Matser A, Prins M, Kretzschmar ME. Decline in incidence of HIV and hepatitis C virus infection among injecting drug users in Amsterdam; evidence for harm reduction? Addiction (Abingdon, England). 2013;108(6):1070–81. - PubMed
-
- Slurink I, van Aar F, Op de Coul E, Heijne J, van Wees D, Hoenderboom B, et al. Sexually transmitted infections including HIV, in the Netherlands in 2018. Bilthoven: National Institute for Public Health and the Environment (RIVM) 2019. Report No.: 2019–0007.
-
- van de Laar TJ, Matthews GV, Prins M, Danta M. Acute hepatitis C in HIV-infected men who have sex with men: an emerging sexually transmitted infection. AIDS (London, England). 2010;24(12):1799–812. - PubMed
Publication types
MeSH terms
Substances
LinkOut - more resources
Full Text Sources
Other Literature Sources
Medical
