. 2018 Sep 1:332:437-448.
doi: 10.1016/j.amc.2018.03.050. Epub 2018 Apr 10.

Coupling dynamics of epidemic spreading and information diffusion on complex networks

Affiliations

Coupling dynamics of epidemic spreading and information diffusion on complex networks

Xiu-Xiu Zhan et al. Appl Math Comput. .

Abstract

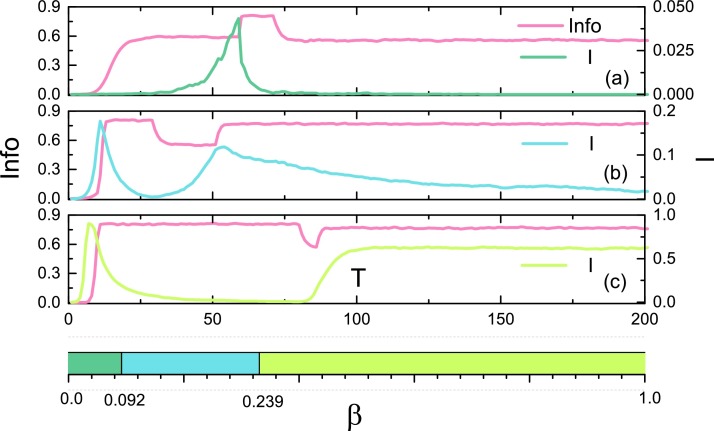
The interaction between disease and disease information on complex networks has facilitated an interdisciplinary research area. When a disease begins to spread in the population, the corresponding information would also be transmitted among individuals, which in turn influence the spreading pattern of the disease. In this paper, firstly, we analyze the propagation of two representative diseases (H7N9 and Dengue fever) in the real-world population and their corresponding information on Internet, suggesting the high correlation of the two-type dynamical processes. Secondly, inspired by empirical analyses, we propose a nonlinear model to further interpret the coupling effect based on the SIS (Susceptible-Infected-Susceptible) model. Both simulation results and theoretical analysis show that a high prevalence of epidemic will lead to a slow information decay, consequently resulting in a high infected level, which shall in turn prevent the epidemic spreading. Finally, further theoretical analysis demonstrates that a multi-outbreak phenomenon emerges via the effect of coupling dynamics, which finds good agreement with empirical results. This work may shed light on the in-depth understanding of the interplay between the dynamics of epidemic spreading and information diffusion.

Keywords: Coupling dynamics; Epidemic spreading; Information diffusion.


Figures

Fig. 1
Fig. 1
Evolution of the number of infected cases (blue circles) and informed cases (pink diamonds) for disease: (a) H7N9; (b) Dengue fever. (b1) and (b2) are details of partial enlargement of dengue fever). The figure shows a high correlation between the spread of disease and the disease information diffusion. (For interpretation of the references to color in this figure legend, the reader is referred to the web version of this article.)
Fig. 2
Fig. 2
Illustration of the spreading model used to interpret the coupling effect between disease and disease information. The horizontal shows the model of the disease and the longitudinal shows the disease information diffusion process. The symbols of the parameters are detailed described in Table 1.
Fig. 3
Fig. 3
The change of infected density (I) of disease with time (T) when using different values of α. The main figure shows that the increase of α slows down the epidemic in both the outbreak size and the spreading speed. The inset shows the information level in the stationary state as a function of α. The other parameters are setting as β=0.3,σS=0.3,σI=0.6,δ=0.8,ɛ=1.5,λ=0.15 and γ=0.1.
Fig. 4
Fig. 4
The change of infected density (I) with time (T) by using different approaches: (a) simulation (pink circle); (b) pairwise analysis (green solid), and (c) mean-field analysis (blue dashed). The corresponding parameters are set as α=0.6,β=0.3,σS=0.3,σI=0.6,δ=0.8,ɛ=1.5,λ=0.15 and γ=0.1. Compared with the results of mean-field analysis, the evolution of infected density from the pairwise approach is more consistent with the simulation results. (For interpretation of the references to color in this figure legend, the reader is referred to the web version of this article.)
Fig. 5
Fig. 5
Comparison between pairwise analysis and simulation for the infected density in the stationary state (colors represent the fraction of infected individuals). (a) pairwise analysis; (b) simulation; (c) enlarged view of pairwise analysis for small value of β and α. The black dotted line in each figure shows the threshold point (βc, αc) for epidemic spreading. Results show that the infected density of the pairwise analysis in the stationary state is consistent with the simulation results. The other parameters are setting as σS=0.3,σI=0.6,δ=0.8,ɛ=1.5,λ=0.15 and γ=0.1.
Fig. 6
Fig. 6
Infection density as a function of β with the pairwise analysis. The inset is the infection density as a function of time with the theoretical analysis around the threshold. The other parameters are setting as α=0.6, σS=0.3,σI=0.6,δ=0.8,ɛ=1.5,λ=0.15 and γ=0.1.
Fig. 7
Fig. 7
Multi-outbreak phenomenon of epidemic spreading and information diffusion. (a) Case of the first epidemic outbreak size is smaller than the second one with Ihigh=0.05, Ilow=0.0003; (b) case of the first epidemic outbreak is larger than the second one with Ihigh=0.1, Ilow=0.001. The parameter β=0.18>βc=0.0067. Info represents the density of informed individuals, and I is the density of infected individuals in the network. The other parameters are setting as α=0.6, σS=0.3,σI=0.6,δ=0.8,ɛ=1.5,λ=0.15 and γ=0.1.
Fig. 8
Fig. 8
Evolution pattern of the density of informed and infected with different values of β: (a) β=0.05; (b) β=0.2; (c) β=0.8. The bottom is an interval indication of β, which corresponds to three phases of informed level: (i) healthy state for 0 ≤ β0.092; (ii) oscillatory state for 0.092 < β ≤ 0.239; (iii) unimodal for 0.239 < β ≤ 1. The result is obtained by 10,000 independent realizations, and we set α=0.6 in all the realizations. The other parameters are setting as α=0.6, σS=0.3,σI=0.6,δ=0.8,ɛ=1.5,λ=0.15 and γ=0.1.

References

    1. Pastor-Satorras R., Castellano C., Van Mieghem P., Vespignani A. Epidemic processes in complex networks. Rev. Mod. Phys. 2015;87(3):925.
    2. march

    1. Durrett R. Some features of the spread of epidemics and information on a random graph. Proc. Natl. Acad. Sci. USA. 2010;107(10):4491–4498. - PMC - PubMed
    1. Pastor-Satorras R., Vespignani A. Epidemic spreading in scale-free networks. Phys. Rev. Lett. 2001;86(14):3200. - PubMed
    1. Barthélemy M., Barrat A., Pastor-Satorras R., Vespignani A. Velocity and hierarchical spread of epidemic outbreaks in scale-free networks. Phys. Rev. Lett. 2004;92(17):178701. - PubMed
    1. Kuperman M., Abramson G. Small world effect in an epidemiological model. Phys. Rev. Lett. 2001;86(13):2909. - PubMed

LinkOut - more resources