. 2018 Dec 5:201:26-59.
doi: 10.1016/j.mee.2018.10.001. Epub 2018 Oct 5.

Diagnostic tools for tackling febrile illness and enhancing patient management

Affiliations

Diagnostic tools for tackling febrile illness and enhancing patient management

Konstantinos Mitsakakis et al. Microelectron Eng. .

Abstract

Most patients with acute infectious diseases develop fever, which is frequently a reason to visit health facilities in resource-limited settings. The symptomatic overlap between febrile diseases impedes their diagnosis on clinical grounds. Therefore, the World Health Organization promotes an integrated management of febrile illness. Along this line, we present an overview of endemic and epidemic etiologies of fever and state-of-the-art diagnostic tools used in the field. It becomes evident that there is an urgent need for the development of novel technologies to fulfill end-users' requirements. This need can be met with point-of-care and near-patient diagnostic platforms, as well as e-Health clinical algorithms, which co-assess test results with key clinical elements and biosensors, assisting clinicians in patient triage and management, thus enhancing disease surveillance and outbreak alerts. This review gives an overview of diagnostic technologies featuring a platform based approach: (i) assay (nucleic acid amplification technologies are examined); (ii) cartridge (microfluidic technologies are presented); (iii) instrument (various detection technologies are discussed); and at the end proposes a way that such technologies can be interfaced with electronic clinical decision-making algorithms towards a broad and complete diagnostic ecosystem.

Keywords: Disease surveillance; Electronic clinical decision algorithms; Febrile illness; Microfluidics; Nucleic acid amplification; Point-of-care diagnostics.


Conflict of interest statement

Conflicts of interest: none.

Figures

Unlabelled Image
Graphical abstract
Fig. 1
Fig. 1
Etiologies of unspecific febrile illness among outpatient children with febrile illness in east and central Tanzania. The figure excludes localized infections, i.e. acute respiratory infections, gastroenteritis, skin infections, meningitis and naso-pharyngeal infections (infections due to enterovirus, adenovirus or influenza, however presenting without any respiratory symptom). Source: figure provided by V. D'Acremont, adapted from [13].
Fig. 2
Fig. 2
Overlap among diseases of viral, bacterial, and parasitic origin identified in outpatient children with febrile illness in east and central Tanzania. Source: figure provided by V. D'Acremont, adapted from [13].
Fig. 3
Fig. 3
Schematic of an LFT and its components. Image source: reprinted from [45], Copyright © 2009, with permission from the open access article distributed by the journal under the Creative Commons Attribution License.
Fig. 4
Fig. 4
(a) A 4-module GeneXpert® (W × H × D: 27.9 × 30.5 × 29.7 cm; weight: 11.8 kg) with its cartridge. (b) A GeneXpert® Omni* (W × H × D: 7.6 × 23.1 × 10.6 cm; weight: 1 kg). Image sources: (a) used from [77]; (b) used from [78].
Fig. 5
Fig. 5
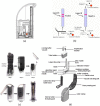
(a) Schematic of a GeneXpert® cartridge and its components. (b) Schematic of an I-CORE module that enables rapid PCR and detection of up to four target DNA sequences in <30 min. (c) The PCR reaction tube incorporated in the I-CORE. Image sources: (a) reprinted from [81], Copyright © 2011, with permission from Elsevier; (b,c) used from [82].
Fig. 6
Fig. 6
(a) The FilmArray® system (W × H × D: 25.4 × 16.5 × 39.3 cm; weight: 9.1 kg). (b) The Filmarray® cartridge. A: Fitment with freeze-dried reagents. B: Plungers to deliver reagents to blisters. C: Sample lysis and bead collection. D: Washing chamber. E: Magnetic bead collection blister. F: Elution chamber. G: Multiplex 1st stage PCR blister. H: Dilution blister prior to 2nd stage PCR. I: Nested PCR array (102 wells). Image sources: (a,b) reprinted from [84], Copyright © 2011, with permission from the open access article distributed by the journal under the Creative Commons Attribution License.
Fig. 7
Fig. 7
(a) The Alere™ i system (W × H × D: 20.7 cm × 14.5 cm × 19.4 cm; weight: 3.0 kg) and (b) set of cartridges. Image sources: (a,b) reprinted from [96], Copyright © 2015, with permission from the American Society for Microbiology.
Fig. 8
Fig. 8
(a,b) The Alere™ q system (W × H × D: 20.0 × 22.0 × 31.0 cm; weight: 7.8 kg) and cartridge. (c) An example of the detection output of the Alere™ q HIV-1/2 Detect system. Image sources: (a) used from [102]; (b) used from the Alere™ q HIV-1/2 Detect cartridge guide [103]; (c) reprinted from [101], Copyright © 2012, with permission from the open access article distributed by the journal under the Creative Commons Attribution License.
Fig. 9
Fig. 9
Single-module configuration of the Enigma® ML system (W × H × D for a single module: 31.5 × 35.5 × 43.0 cm; weight: 19.4 kg) indicating how the cartridge is inserted. Image source: reprinted from [106], Copyright © 2016, with permission from the American Society for Microbiology.
Fig. 10
Fig. 10
The Enigma® ML cartridge schematic (left) and real image (right). Image source: reprinted from [105] Copyright © 2015, by permission of the publisher Taylor & Francis Ltd., http://www.tandfonline.com.
Fig. 11
Fig. 11
The cobas® Liat cartridge and analyzer (W × H × D: 11.4 × 19.0 × 24.1 cm; weight: 3.7 kg). Image source: used from [111].
Fig. 12
Fig. 12
Scheme of cobas® Liat tube and sequential steps from sample inlet to PCR. Image source: reprinted from [113], Copyright © 2010, by permission of Oxford University Press.
Fig. 13
Fig. 13
The VerePLEX™ Biosystem consists of two main parts: (i) the temperature control system, which can process up to 5 cartridges independently and simultaneously, and supports multiplex PCR (middle in the above figure – W × H × D: 50.0 × 14.5 × 30.0 cm; weight: 10.0 kg); and (ii) the optical reader, which detects the microarray on the chip within seconds based on CCD imaging technology (right in the above figure – W × H × D: 18.0 × 31.0 × 18.0 cm; weight: 3.6 kg). A laptop/PC is also necessary for control and software handling. Image source: used from [118].
Fig. 14
Fig. 14
(a) The VereChip™ cartridge. (b) The silicon chip, which is the core of the system, with its different functional zones. (c) Some key components of the chip: (i) buried-channels in the sample inlet, (ii) microfluidic inlet/outlets, (iii) serpentine-shaped temperature sensor, (iv) metal heating electrodes or pads. (d) Cross-sectional view of the lab-on-a-chip device. Image sources: (a) used from [122]; (b,c,d) reprinted from [120] with permission from SPIE and the authors.
Fig. 15
Fig. 15
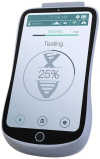
The Q-POC™ system (handheld, smartphone-sized). Image source: used from [125].
Fig. 16
Fig. 16
Operating principle of the SiNW label-free DNA sensor. Varying hybridization sites cause a variation of the field effect of the SiNW sensor. Reprinted with permission from [126]. Copyright © 2008 American Chemical Society.
Fig. 17
Fig. 17
Schematic of the Q-POC™ microfluidic chip. (a) Sample inlet. (b) Lysis chamber for releasing the DNA from the cells (or, with the use of appropriate membrane, for withholding the cells if circulating DNA is required for analysis). (c) Nucleic acid purification, by keeping all lysate components on a membrane. (d) Nucleic acid amplification area (continuous flow PCR). (e) Post-amplification and pre-analysis processing (its necessity depends on the application). (f) Connecting fluidic channel. (g) Metal contacts, providing the interface with the handheld device. (h) Sensitive SiNW arrays. (i) Meander-shaped microfluidic channel filled with reagents that are released at will to area (g)/(h). In particular, reagents may include various nucleotide mixtures and wash solutions, all separated by air bubble(s), in order to flow sequentially and in a well-controlled way. When nucleotides flow sequentially over a nanowire-immobilized single stranded oligonucleotide, then according to the hybridization sequence, the local charge changes, causing a resistance change in the SiNW. Image source: used from [129].
Fig. 18
Fig. 18
The EasyNAT™ cartridge from Ustar Biotechnologies (Hangzhou) Ltd. (handheld size). The integrated lateral flow test is visible. Image source: used from [133].
Fig. 19
Fig. 19
(a) Side view of the cartridge, indicating the positioning of the reaction tube (red bottom) and surrounding fluidics. (b) The detection principle based on Cross Priming Amplification products detected on an LFT strip. (c) Step-by-step loading and usage of the cartridge. The running buffer and the reaction tubes are visible in Step 1. (d) Exploded view of the cartridge components. Image sources: (a,b) used from [130]. (c) reprinted from [136], Copyright © 2018 with permission from Elsevier. (d) reprinted from [137], by permission of Oxford University Press.
Fig. 20
Fig. 20
(a) The Verigene® RP Flex System with the Reader and two identical Processors SP controlled by the Reader (Dimensions W × H × D: Reader: 29.8 × 31.5 × 52.1 cm; weight: 11.3 kg. Processor SP: 19.4 × 47.5 × 58.2 cm; weight: 17.2 kg). (b) The test cartridge reagent pack. (c) The glass support of the test cartridge, which carries the microarray, is inserted in the Reader of (a) for detection. Image sources: (a) used from [138]; (b,c) reprinted from [141], Copyright © 2009, with permission from Elsevier.
Fig. 21
Fig. 21
(a) Process steps for probe hybridization. (b) Example array and detection workflow using the AuNPs and NanoGrid technology. Image sources: (a) reprinted with Copyright © Zhao et al. [144]; licensee BioMed Central Ltd. 2010, with permission from the open access article distributed by the journal under the Creative Commons Attribution License; (b) reprinted from [145], Copyright © 2010, with permission from the American Society for Microbiology.
Fig. 22
Fig. 22
The DiagCORE® system (total, including the analytical and one operational module: W × H × D: 23.4 × 32.6 × 51.7 cm; weight: 21.0 kg) and cartridge from STAT-Dx. Image sources: (a,b) used from [146].
Fig. 23
Fig. 23
Indicative designs of some main fluidic areas of the DiagCORE® cartridge (a) and a close-up of the test fluidic unit (b). Image sources: (a,b) used from [149].
Fig. 24
Fig. 24
(a) Image of the LabDisk and corresponding processing device (W × H × D: 17.5 × 30.0 × 28.0 cm; weight: 2.0 kg). (b) Schematic of a typical LabDisk design for sample-to-answer nucleic acid analysis. The figure indicates the pre-storage of all necessary reagents. Image sources: (a) Hahn-Schickard, Bernd Müller Fotografie; (b) Hahn-Schickard, F. Stumpf.
Fig. 25
Fig. 25
Schematic process flow for the microthermoforming of polymer foils. (a) Fabrication of an elastomeric (PDMS) foil from a micromilled PMMA master. (b) Placement of the foil above the PDMS mold in a hot embossing machine; clamping of the foil in vacuum; air pressing against the heated foil and mold; the foil is shaped. (c) The foil is demolded after cooling, venting and opening of the process chamber. (d,e) Images of elastomeric and metal masters placed in respective holders prior to thermoforming. Image sources: (a–c): reproduced from [180] with permission of The Royal Society of Chemistry. (d,e): Hahn-Schickard, Germany.
Fig. 26
Fig. 26
(a,b) The GenePOC™ system (W × H × D: 40.0 × 33.0 × 24.0 cm; weight: 10.0 kg) and (c) cartridge. Image sources: (a) used from [183]; (b) used from [181]; (c) reprinted from [182], Copyright © 2016, with permission from the open access article distributed by the journal under the Creative Commons Attribution License.
Fig. 27
Fig. 27
(a) Liaison® MDX thermocycler (W × H × D: 21.0 × 31.0 × 31.0 cm; weight: 8.0 kg); (b) the Direct Amplification Disk; and (c) the 96-well Universal Disk. Image sources: used from [184].
Fig. 28
Fig. 28
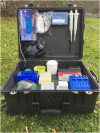
Assembly of the Diagnostics-in-a-Suitcase (W × H × D: 56.0 × 26.5 × 45.5 cm; weight: 8.0 kg). A PVC layer is placed on top of the foam to fill the bottom of the suitcase. The equipment is fixed to the PVC layer using hot glue. The suitcase includes a tube scanner, the box for the disinfection wipes, the waste container, the vortex, the pipette tips, the minicentrifuge, and two boxes of refill pipette tips. Also, electricity wires are stowed underneath the foam layer. Image sources: reprinted from [186], Copyright © 2015, with permission from the open access article distributed by the journal under the Creative Commons Attribution License.
Fig. 29
Fig. 29
The whole diagnostic test development process, from innovation, to validation and application. This development process is in reality a reiterative process that is more circular than linear. Source: V. D'Acremont.
Fig. 30
Fig. 30
Electronic decision making algorithm supported by a tablet connected to sensors, a NAAT POC test, and LFTs (through an LFT automated reader). Source: Valérie D'Acremont and Kristina Keitel.
Fig. 31
Fig. 31
Schematic representation of the potential integration of a mobile patient management system (eFever) and a centralized electronic disease surveillance system (eMergence). Source: Valérie D'Acremont.

References

    1. Liu L., Johnson H.L., Cousens S., Perin J., Scott S., Lawn J.E. Global, regional, and national causes of child mortality: an updated systematic analysis for 2010 with time trends since 2000. Lancet. 2012;379:2151–2161. - PubMed
    1. WHO . World Health Organization; Geneva, Switzerland: 2013. WHO Informal Consultation on Fever Management in Peripheral Health Care Settings: A Global Review of Evidence and Practice.http://www.who.int/malaria/publications/atoz/9789241506489/en/ Available at:
    1. Biggs H.M., Lester R., Nadjm B., Mtove G., Todd J.E., Kinabo G.D. Invasive Salmonella infections in areas of high and low malaria transmission intensity in Tanzania. Clin. Infect. Dis. 2014;58:638–647. - PMC - PubMed
    1. D'Acremont V., Kahama-Maro J., Swai N., Mtasiwa D., Genton B., Lengeler C. Reduction of anti-malarial consumption after rapid diagnostic tests implementation in Dar es Salaam: a before-after and cluster randomized controlled study. Malar. J. 2011;10:107. - PMC - PubMed
    1. Crump J.A. Typhoid fever and the challenge of nonmalaria febrile illness in Sub-Saharan Africa. Clin. Infect. Dis. 2012;54(8):1107–1109. - PubMed

LinkOut - more resources