Review
. 2012 Jul;55(4):221-235.
doi: 10.1016/j.infrared.2012.03.007. Epub 2012 Apr 13.

Medical applications of infrared thermography: A review

Affiliations
Review

Medical applications of infrared thermography: A review

B B Lahiri et al. Infrared Phys Technol. 2012 Jul.

Abstract

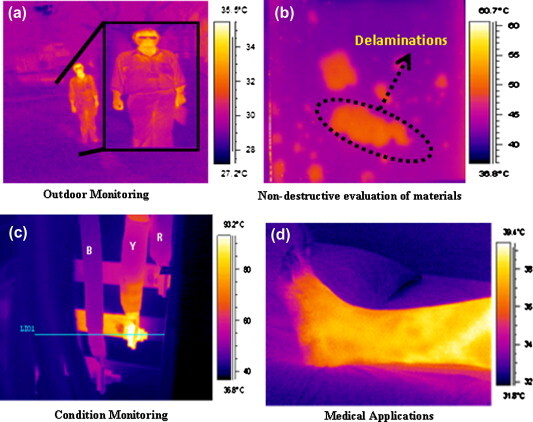
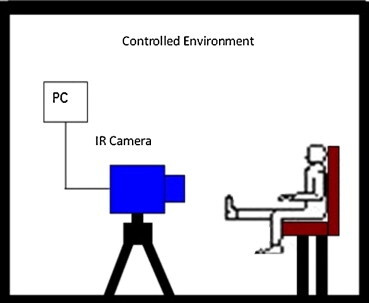
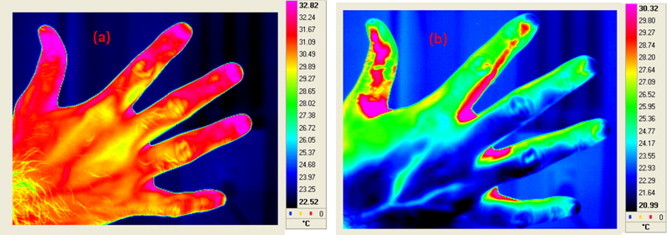
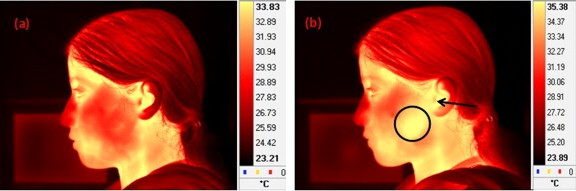
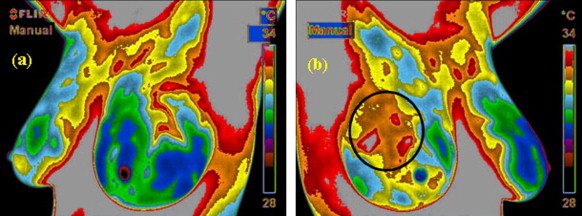
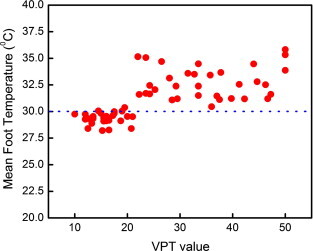
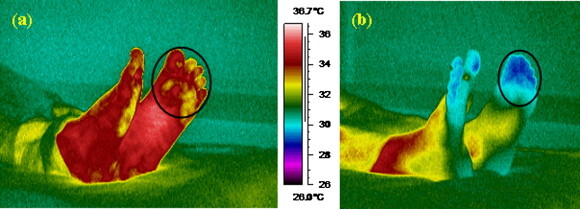
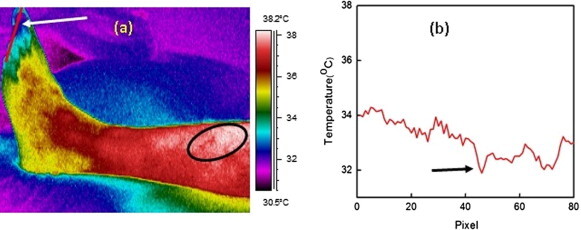
Abnormal body temperature is a natural indicator of illness. Infrared thermography (IRT) is a fast, passive, non-contact and non-invasive alternative to conventional clinical thermometers for monitoring body temperature. Besides, IRT can also map body surface temperature remotely. Last five decades witnessed a steady increase in the utility of thermal imaging cameras to obtain correlations between the thermal physiology and skin temperature. IRT has been successfully used in diagnosis of breast cancer, diabetes neuropathy and peripheral vascular disorders. It has also been used to detect problems associated with gynecology, kidney transplantation, dermatology, heart, neonatal physiology, fever screening and brain imaging. With the advent of modern infrared cameras, data acquisition and processing techniques, it is now possible to have real time high resolution thermographic images, which is likely to surge further research in this field. The present efforts are focused on automatic analysis of temperature distribution of regions of interest and their statistical analysis for detection of abnormalities. This critical review focuses on advances in the area of medical IRT. The basics of IRT, essential theoretical background, the procedures adopted for various measurements and applications of IRT in various medical fields are discussed in this review. Besides background information is provided for beginners for better understanding of the subject.

Keywords: Breast cancer; Dentistry; Diabetes; Fever screening; Infrared thermography; Medical thermography.


Figures

Fig. 1
Fig. 1
Various applications of infrared thermography: (a) Outdoor monitoring during night time. The objects could be easily visualized due to infrared emissions from the surfaces. (b) Non-destructive evaluation of materials, where delaminations appear as hot spots, in glass fiber reinforced polymer specimen. (c) Condition monitoring of three phase electrical panel. Here local hot spots are developed due to loose contact. (d) Medical application: thermal image of lower limb of a diabetic subject.
Fig. 2
Fig. 2
Schematic of a typical experimental set-up for medical thermography experiment. The temperature and humidity of the experiment-room is kept within a comfortable limit. The camera is placed normal to the observation surface to minimize geometrical errors in temperature measurement.
Fig. 3
Fig. 3
Typical thermal images of right hand of a normal subject (a) before cold stimulation and (b) 1 min after mild cold stimulation. Cold stimulation was applied by placing the hand on ice surface for 30 s. Application of such cold stimulations increases the sensitivity of the thermal images. Veins are clearly visible in the thermal image recorded after cold stimulation.
Fig. 4
Fig. 4
Typical thermal images of a subject talking on a hand-held mobile phone; (a) after 1 min of talking and (b) after 15 min of talking. After 15 min of talking the temperature of the encircled region increased from 30.56 to 35.15 °C, whereas the temperature of the ear region (indicated by an arrow) increased from 33.35 to 34.82 °C.
Fig. 5
Fig. 5
Typical thermal images of a female subject suffering from breast cancer ; (a) left breast thermogram and (b) right breast thermogram. The encircled region in the right breast thermogram shows higher temperature with respect to the surrounding normal regions. Later biopsy confirmed existence of cancer in the right breast.
Fig. 6
Fig. 6
Mean foot temperature (MFT) of diabetic subjects as a function of their VPT values . For non-neuropathic subjects with VPT values less than 20, MFT values are within 27–30 °C, whereas for neuropathic subjects with VPT values greater than 20, MFT values are within a temperature band 30–37 °C.
Fig. 7
Fig. 7
Typical thermal images of plantar region for two diabetic subjects ; (a) 44 year old neuropathic male subject with HbA1c value of 9.6% and (b) 67 year old non-neuropathic female subject with HbA1c value of 6.6%. Average temperature of the encircled regions in case of neuropathic and non-neuropathic subjects is 34.1 and 29.1 °C.
Fig. 8
Fig. 8
(a) Thermal image of left lower limb of a 28 year old male diabetic subject suffering from vascular disorder . The distal portion (indicated by an arrow) is at a lower temperature due to slow blood circulation and varicosity induced inadequate venous drainage. The encircled region is at 0.7–1 °C higher temperature with respect to the surrounding region. This elevated temperature is attributed to the presence of varicose veins, with probable mild inflammation. (b) Temperature profile along the line shown in Fig. 8a. The lowest temperature is indicated with an arrow.
Fig. 9
Fig. 9
(a) Thermal image of left eye of a normal subject, where the cornea region is clearly discernible. Cornea appears to be at a lower temperature compared to the surrounding region. (b) Temperature profile along the horizontal line shown in Fig. 9a. The line profile shows that, the temperature distribution across cornea is symmetric in normal subjects and the coolest spot is little shifted from the geometrical center of the cornea. This may be attributed to the flow of tear fluid, which causes a decrease in temperature of the cornea.

References

    1. Houdas Y., Ring E.F.J. Plenum Press; New York: 1982. Human Body Temperature.
    1. Ring E.F.J. The historical development of temperature measurement in medicine. Infrared Physics & Technology. 2007;49:297–301.
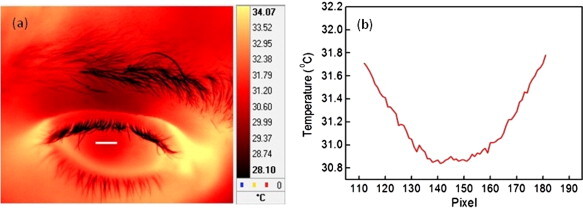
    1. Tan J.H., Ng E.Y.K., Acharya U.R., Chee C. Infrared thermography on ocular surface temperature: a review. Infrared Physics & Technology. 2009;52:97–108.
    1. Jones B.F. A reappraisal of the use of infrared thermal image analysis in medicine. IEEE Transactions on Medical Imaging. 1998;17:1019–1027. - PubMed
    1. Bouzida N., Bendada A., Maldague X.P. Visualization of body thermoregulation by infrared imaging. Journal of Thermal Biology. 2009;34:120–126.

LinkOut - more resources