. 2019 Jan:17:e00515.
doi: 10.1016/j.gecco.2018.e00515. Epub 2018 Dec 24.

Dealing in deadly pathogens: Taking stock of the legal trade in live wildlife and potential risks to human health

Affiliations

Dealing in deadly pathogens: Taking stock of the legal trade in live wildlife and potential risks to human health

Özgün Emre Can et al. Glob Ecol Conserv. 2019 Jan.

Abstract

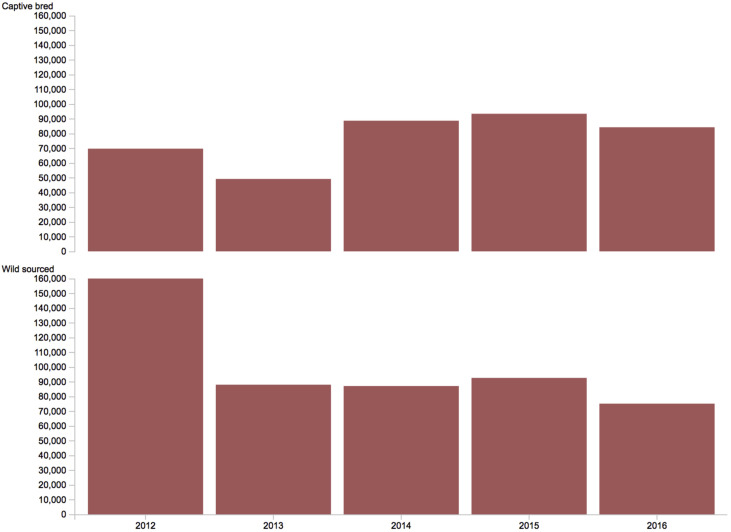
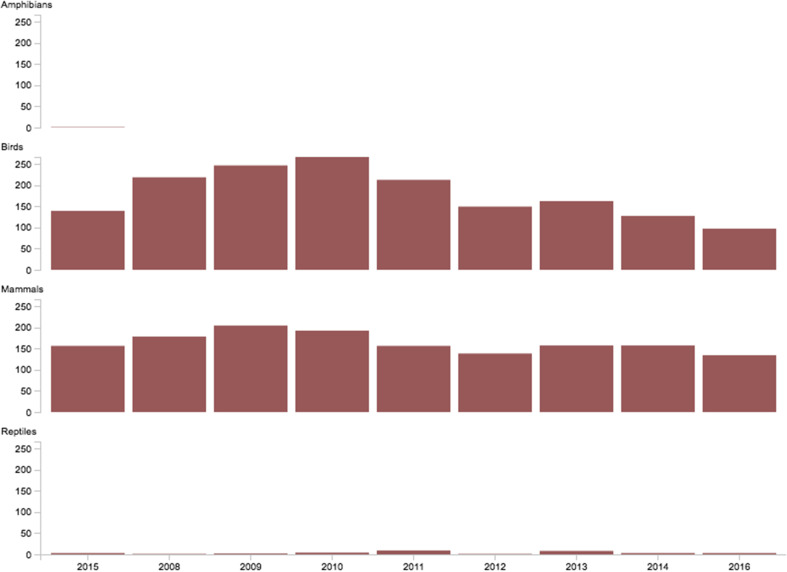
Zoonotic diseases cause millions of deaths every year. Diseases such as Ebola, severe acute respiratory syndrome (SARS), and avian influenza cause economic losses at the global level and jeopardize diplomatic relations between countries. As wildlife are the source of at least 70% of all emerging diseases and given the on-going concerns associated with wildlife trade as a disease transmission mechanism, we provide a 'global snapshot' of the legal trade in live wild animals and take stock of the potential health risks that it poses to global human health. Our analysis showed that 11,569,796 individual live wild animals, representing 1316 different species were exported from 189 different countries between 2012 and 2016. China was the largest exporter of live mammals (with 98,979 animals representing 58.7% of global trade). Nicaragua was the largest exporter of live amphibians (with 122,592 animals representing 53.8% of global trade). South Africa was the largest exporter of live birds (with 889,607 animals representing 39.2% of global trade). Peru was the largest exporter of live reptiles (with 1,675,490 animals representing 18.8% of global trade). Our analysis showed that mostly the USA and other high-income countries, the largest importers, drive the live animal trade. High-income countries and not the countries where wildlife diseases and pathogens are more likely to occur reported almost all of the disease reports to the World Organisation for Animal Health. Based on our findings, we discuss how maximising trade bans; working on human behaviour change and improving regulatory efforts to improve surveillance will decrease the risk of future pandemics, epidemics and outbreaks.

Keywords: Epidemics; Human health; Outbreaks; Pandemics; Wildlife trade; Zoonotic disease.


Figures

Fig. 1
Fig. 1
Breakdown of legal live animal trade carried out for commercial and personal use based on CITES data 2012–2016. The numbers of reported quantities of exported animals by exporter countries and reported quantities of imported animals by importing countries do not match because not all Parties submit complete reports or submits reports at all to the CITES Secretariat (UNEP-WCMC, 2013).
Fig. 2
Fig. 2
Photographs of species representing the top traded families in mammals, amphibians, birds and reptiles (Photographs: top left - Macaca cyclopis) by Kaur Jmeb [CC BY-SA 2.0 license], top right - Agalychnis callidryas by Pavel Kirillov [CC BY-SA 2.0 license], bottom left - Agapornis personatus by Epoulin10 [CC BY 3.0] license and bottom right - Podocnemis unifilis by http://opencage.info [ CC BY-SA 2.5 license] via Wikimedia Commons). Macaque species are mostly used for medical research (Southwick and Siddiqi, 1994; Carlsson et al., 2004; Lankau et al., 2014).
Fig. 3
Fig. 3
Magnitude of flow of the global live mammal trade (showing a total of 2147 trade records mapped according to class, order, family, genus, exporter and importer country codes in the CITES database) that occurred between 2012 and 2016. The thicknesses of coloured bands in the figure reflect the number of animals traded and the magnititude of trade between the countries.
Fig. 4
Fig. 4
Magnitude of flow of the global live amphibian trade (showing a total of 1818 trade records mapped according to class, order, family, genus, exporter and importer country codes in the CITES database) that occurred between 2012 and 2016. The thicknesses of coloured bands in the figure reflect the number of animals traded and the magnitutde of trade between the countries.
Fig. 5
Fig. 5
Magnitude of flow of the global live bird trade (showing a total of 29,351 trade records mapped according to class, order, family, genus, exporter and importer country codes in the CITES database) that occurred between 2012 and 2016. The thicknesses of coloured bands in the figure reflect the number of animals traded and the magnitutude of trade between the countries.
Fig. 6
Fig. 6
Magnitude of flow of the global live reptile trade (showing a total of 17,850 records mapped according to class, order, family, genus, exporter and importer country codes in the CITES database) that occurred between 2012 and 2016. The thicknesses of coloured bands in the figure reflect the number of animals traded and the magnitude of trade between the countries.
Fig. 7
Fig. 7
Number of mammals exported and their origin (caught from the wild vs captive bred) between 2012 and 2016.
Fig. 8
Fig. 8
Number of amphibians exported and their origin (caught from the wild vs captive bred) between 2012 and 2016.
Fig. 9
Fig. 9
Number of birds exported and their origin (caught from the wild vs captive bred) between 2012 and 2016.
Fig. 10
Fig. 10
Number of reptiles exported and their origin (caught from the wild vs captive bred) between 2012 and 2016.
Fig. 11
Fig. 11
Distribution of 108 articles that mention the health aspect of exotic pets.
Fig. 12
Fig. 12
Distribution of disease reports in OIE WAHIS-Wild database as they are reported by world's governments between 2008 and 2016.
Fig. 13
Fig. 13
Number of disease/infection reports according to animal classes for the period 2008–2016.
Fig. 14
Fig. 14
Distribution of disease reports per animal classes in OIE WAHIS database for the period of 2008–2016.
Fig. 15
Fig. 15
The distribution of hierarchical clustering of trade records for mammals according to taxonomic Order for the period 2012–2016. On the diagram each CITES record is represented by a line originating from the centre going through two nodes: the inner node represents the quantity of trade reported by the exporting country, the outer node represent the quantity of trade documented as received by the importer country. The sections (a-Rodentia, b-Chiroptera, c-Pholidota, d-Carnivora, e, f and g-Primates) on the graph indicate the mammalian Orders where quantities from the exporter country were null.

References

    1. Baker S.E., Cain R., Van Kesteren F., Zommers Z.A., D'cruze N., Macdonald D.W. Rough trade: animal welfare in the global wildlife trade. Bioscience. 2013;63(12):928–938.
    1. Ballou J. Assessing the risks of infectious diseases in captive breeding and reintroduction programs. J. Zoo Wildl. Med. 1993;24(3):327–335.
    1. Bernard S.M., Anderson S.A. Qualitative assessment of risk for monkeypox associated with domestic trade in certain animal species, United States. Emerg. Infect. Dis. 2006;12(12):1827–1833. - PMC - PubMed
    1. Bush E.R., Baker S.E., Macdonald D.W. Global trade in exotic pets 2006–2012. Conserv. Biol. 2014;28(3):663–676. - PubMed
    1. Can Ö.E., Macdonald D.W. Looking under the bonnet of conservation conflicts: can neuroscience help? Biodivers. Conserv. 2018;27(8):2087–2091. doi: 10.1007/s10531-018-1514-1. - DOI