. 2020 Jun 1;217(6):e20191212.
doi: 10.1084/jem.20191212.

Endothelial mTOR maintains hematopoiesis during aging

Affiliations

Endothelial mTOR maintains hematopoiesis during aging

Pradeep Ramalingam et al. J Exp Med. .

Abstract

Aging leads to a decline in hematopoietic stem and progenitor cell (HSPC) function. We recently discovered that aging of bone marrow endothelial cells (BMECs) leads to an altered crosstalk between the BMEC niche and HSPCs, which instructs young HSPCs to behave as aged HSPCs. Here, we demonstrate aging leads to a decrease in mTOR signaling within BMECs that potentially underlies the age-related impairment of their niche activity. Our findings reveal that pharmacological inhibition of mTOR using Rapamycin has deleterious effects on hematopoiesis. To formally determine whether endothelial-specific inhibition of mTOR can influence hematopoietic aging, we conditionally deleted mTOR in ECs (mTOR(ECKO)) of young mice and observed that their HSPCs displayed attributes of an aged hematopoietic system. Transcriptional profiling of HSPCs from mTOR(ECKO) mice revealed that their transcriptome resembled aged HSPCs. Notably, during serial transplantations, exposure of wild-type HSPCs to an mTOR(ECKO) microenvironment was sufficient to recapitulate aging-associated phenotypes, confirming the instructive role of EC-derived signals in governing HSPC aging.


Conflict of interest statement

Disclosures: The authors declare no competing interests exist.

Figures
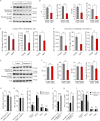
Figure S1.
Figure S1.
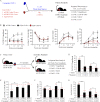
Aging is associated with decreased mTOR signaling within the BM microenvironment. (A) Representative immunoblot images demonstrating decreased expression of phospho-S6 and phospho-4EBP-1 in BM cells of aged mice compared with those of young mice. (B) Densitometry-based quantification of indicated proteins in the BM of aged mice compared with young mice (n = 6 mice per cohort). Expression of Actb was used for normalization. Data represent combined analysis of two independent experiments. (C and D) Quantification of mean fluorescent intensity (MFI) of phospho-mTOR (Ser2448), phospho-AKT (Ser473), and phospho-S6 (Ser235/236) by Phosphoflow cytometry in Lin CD45+ HSPCs (C) and Lin CD45CD31+VECAD+ BMECs (D; n = 5 mice per cohort). (E) Representative immunoblot images demonstrating decreased expression of phospho-S6 and phospho-4EBP-1 in BM cells of aged mice treated with Rapamycin. (F) Densitometry-based quantification of indicated proteins in the BM of aged mice treated with Rapamycin compared with aged control mice (n = 3 mice per cohort). Expression of Actb was used for normalization. (G–I) Analysis of wild-type cre- (n = 3) and Cdh5-creERT2+ (n = 3) mice revealed no significant differences in BM cellularity (G), HSC frequency (H), and peripheral blood lineage composition (I) indicating that endothelial-specific expression of the creERT2 transgene does not affect hematopoiesis. (J–L) Hematopoietic analysis of heterozygote mTORfl/+creERT2+ (n = 5) and mTOR(ECKO) (n = 5) demonstrated that unlike mTOR(ECKO) mice, the littermate heterozygote mTORfl/+creERT2+ mice do not manifest increased BM cellularity (J), increased HSC frequency (K), and myeloid-skewed peripheral blood lineage composition (L). All mice used in G–L were administered 200 mg/kg tamoxifen via intraperitoneal injection at a concentration of 30 mg/ml in sunflower oil on consecutive 3 d, followed by 3 d off, and an additional 3 d of injection. Note that the same regimen induces HSPC aging phenotypes in homozygote mTORfl/flcre-ERT2+ (Fig. 3 and Fig. 4), indicating that loss of both alleles of endothelial mTOR is essential to induce HSPC aging phenotypes. Error bars represent mean ± SEM. Statistical significance determined using Student’s t test. *, P < 0.05; **, P < 0.01; ***, P < 0.001. ns, not statistically significant; Rapa, Rapamycin.
Figure 1.
Figure 1.
Rapamycin adversely impacts hematopoiesis and HSPC activity in aged mice. (A) Experimental design to assess the impact of Rapamycin treatment (Rx) on aging hematopoiesis. (B) Bar graphs of peripheral blood counts demonstrating a decrease in WBC and platelets following Rapamycin treatment (n = 12 mice per cohort). (C) Lineage composition of peripheral blood CD45+ cells showing an increased frequency of myeloid cells in Rapamycin-treated aged mice (n = 8–10 mice per cohort). (D and E) Total hematopoietic cells (n = 12 mice per cohort; D) and the frequency of immunophenotypically defined HSCs per femur (n = 8 mice per cohort; E). (F) Methylcellulose-based colony assay by quantifying CFUs revealed a decrease in hematopoietic progenitor activity (n = 3 mice per cohort). Note that BFU-E denotes burst-forming unit–erythroid, whereas CFU-G, CFU-M, CFU-GM, and CFU-GEMM denote CFU-granulocyte, CFU-macrophage, CFU-granulocyte/macrophage, and CFU-granulocyte/erythroid/macrophage/megakaryocyte, respectively. Data in B–F represent combined analysis of two independent experiments. (G) Schematic of competitive WBM transplantation assay to assess HSPC activity within WBM cells following Rapamycin treatment. (H and I) Peripheral blood analysis 16 wk after transplantation revealed a decrease in long-term engraftment potential (H) and myeloid-biased lineage output at the expense of lymphopoiesis (I; n = 10 recipients per cohort), confirming that Rapamycin adversely impacts HSPC activity in aged mice. Data represent average engraftment following transplantation of cells derived from n = 3 independent donor mice per cohort. Error bars represent sample mean ± SEM. Statistical significance determined using Student’s t test. *, P < 0.05; **, P < 0.01; ***, P < 0.001.
Figure 2.
Figure 2.
Rapamycin impairs hematopoietic recovery following myelosuppressive injury. (A) Experimental design to assess the impact of Rapamycin on hematopoietic recovery following chemotherapy. (B) Peripheral blood counts demonstrate a delay in WBC, neutrophil (NEU), and platelet (PLT) recovery following chemotherapy (n = 6 mice per cohort). (C and D) Total hematopoietic cells per femur (n = 5 mice per cohort; C) and the frequency of HSCs per 106 femur cells (n = 5 mice per cohort; D) at day 28 following chemotherapy. (E) Methylcellulose-based colony assay to assess hematopoietic progenitor activity (n = 3 mice per cohort). Data in B–E represent combined analysis of two independent experiments. (F) Schematic of competitive WBM transplantation assay to determine HSPC recovery following chemotherapy. (G and H) Peripheral blood analysis 16 wk after transplantation revealed a loss of long-term engraftment potential (G) and normal lineage reconstitution (H; n = 6 recipients per cohort) in donor WBM cells derived from Rapamycin-treated mice. Data represent average engraftment following transplantation of WBM cells derived from n = 6 independent donor mice per cohort. (I) Experimental design to assess the impact of Rapamycin on hematopoietic recovery following myelosuppressive irradiation. (J) Peripheral blood counts demonstrate a delay in WBC and platelet recovery following radiation (n = 11 mice per cohort). (K and L) Total hematopoietic cells per femur (n = 5 mice per cohort; K) and the frequency of HSCs per 106 femur cells (n = 5 mice per cohort; L) at day 28 following irradiation. (M) Methylcellulose-based colony assay to assess hematopoietic progenitor activity (n = 3 mice per cohort). Data in J–M represent combined analysis of two independent experiments. (N) WBM transplantation assay. (O and P) Peripheral blood analysis 16 wk after transplantation revealed a complete loss of long-term engraftment potential (O) and multilineage reconstitution ability (P; n = 4–8 recipients per cohort) in donor WBM cells derived from Rapamycin-treated mice. Data represent average engraftment following transplantation of cells derived from n = 4 independent donor mice per cohort. Error bars represent sample mean ± SEM. Statistical significance determined using Student’s t test. *, P < 0.05; **, P < 0.01; ***, P < 0.001.
Figure 3.
Figure 3.
EC-specific deletion of mTOR in young mice leads to aging-related alterations in HSPCs. (A–C) To determine the effect of endothelial-specific mTOR deletion on HSPCs, hematopoietic analysis was performed on young mTORfl/fl (n = 8), mTOR(ECKO) (n = 10), and aged control mice (n = 5). (A and B) Endothelial-specific deletion of mTOR resulted in a significant increase in total hematopoietic cells (A) and the frequency of immunophenotypically defined long-term repopulating HSCs (LT-HSCs; B) per femur. (C) Lineage composition of CD45+ hematopoietic cells in the peripheral blood. (D) Methylcellulose-based colony assay was used to assess hematopoietic progenitor activity by quantifying CFUs (n = 3 mice per cohort). (E) Quantification of the frequency of polarized HSCs (n = 3 mice per cohort). (F) Representative images of α-Tubulin staining to evaluate HSC cellular polarity. (G) Quantification of number of γH2AX foci per HSC (n = 3 mice per cohort). (H) Representative images of γH2AX foci in HSC. Data in A–H represent combined analysis of two independent experiments. (I) Transcriptional profiling of HSCs by microarray in the indicated genotypes (n = 3 mice per cohort). Note: The phenotypes observed in mTOR(ECKO) mice closely mimic the phenotypes observed in aged control mice. (J) Venn diagram comparing genes showing significant changes between young and aged hematopoietic stem cells in the current study and in two previously published datasets. Genes listed demonstrate concordant changes in expression between the current study and published datasets (red, up-regulated in aged HSCs; green, down-regulated in aged HSCs). Genes in bold text were validated by RT-qPCR and represent an aged HSC expression signature. (K) RT-qPCR confirmation of microarray-identified aged HSC gene expression signature in mTOR(ECKO) and aged mice (n = 3 mice per cohort). Note: HSCs from mTOR(ECKO) mice share an aged HSC gene expression signature. Error bars represent mean ± SEM. Statistical significance determined using one-way ANOVA with Tukey’s correction for multiple comparisons. *, P < 0.05; **, P < 0.01; ***, P < 0.001.
Figure 4.
Figure 4.
HSCs from young mTOR(ECKO) mice display functional defects resembling aged HSCs. (A) Schematic of primary transplants. (B) Long-term multilineage repopulation capacity of HSCs (n = 10 recipients per cohort). CD45.2+ HSCs transplanted from young mTOR(ECKO) mice displayed diminished engraftment potential and a significant myeloid bias at the expense of lymphopoiesis. Data represent average engraftment following transplantation of cells derived from n = 3 independent donor mice per cohort. (C) Schematic of secondary transplants. WBM isolated from primary recipients was transplanted into either young mTORfl/fl control or young mTOR(ECKO) mice. Primary recipients that received aged HSCs were transplanted into young wild-type secondary-recipient mice and served as aged controls. (D–G) Quantification of multilineage engraftment in secondary transplant recipients. CD45.2+ peripheral blood engraftment (D) and myeloid (E), B cell (F), and T cell (G) lineage-committed contribution 24 wk after transplantation (n = 5–7 recipients per cohort). Data represent average engraftment following transplantation of cells derived from n = 5 independent donor mice per cohort. Error bars represent mean ± SEM. Statistical significance determined using Student’s t test. *, P < 0.05; **, P < 0.01; ***, P < 0.001. CNTL, control; LT-HSC, long-term repopulating HSC; n.s., not statistically significant.
Figure S2.
Figure S2.
Endothelial mTORC1 and mTORC2 play nonredundant roles in HSPC maintenance. (A) Representative immunoblot images demonstrating decreased expression of phospho-4EBP-1 and phospho-Akt in cultured BMECs transduced with lentiviral shRNA targeting Raptor and Rictor, respectively. (B–G) Densitometry-based quantification of indicated proteins. Expression of Tubulin was used for normalization. (H) Schematic of ex vivo co-culture assay. In short, HSPCs were co-cultured for 9 d with 50 ng/ml sKITL in serum-free media, followed by phenotypic and functional analyses (n = 3 independent co-cultures per genotype). (I) Total CD45+ hematopoietic cells estimated by flow cytometry after 9 d of co-culture (n = 3 expansions per genotype). (J) Day 9 expanded CD45 cells were FACS purified from feeders. 25,000 CD45+ cells were plated in methylcellulose and scored for CFUs after 8 d (n = 3 per genotype). Data in A–J represent combined analysis of three independent experiments. Error bars represent sample mean ± SEM. Statistical significance determined using Student’s t test. *, P < 0.05; **, P < 0.01; ***, P < 0.001. Cntl, control; ECKD, EC cell knockdown; ns, not statistically significant.
Figure S3.
Figure S3.
Loss of endothelial mTOR adversely impacts hematopoietic recovery following myelosuppressive injury. (A) Experimental design to assess hematopoietic recovery following radiation-induced myelosuppressive injury. (B) Peripheral blood counts demonstrate a significant delay in RBC, WBC, and platelet recovery in young mTOR(ECKO) mice following radiation (n = 5 mice per cohort). (C and D) Total hematopoietic cells per femur (C) and the frequency of HSCs per femur (D; n = 5 per cohort) 28 d after myelosuppressive injury. (E) Methylcellulose-based colony assay to assess hematopoietic progenitor activity (n = 3 mice per cohort). Data in B–E represent combined analysis of two independent experiments. (F) Schematic of competitive WBM transplantation assay to determine long-term engraftment potential and multilineage reconstitution ability of BM cells following myelosuppressive injury. (G and H) Peripheral blood analysis 16 wk after transplantation revealed a loss of long-term engraftment potential (G), along with impaired reconstitution of CD3+ cells (H), in donor BM cells derived from mTOR(ECKO) mice (n = 10 recipients per cohort). Data represent average engraftment following transplantation of cells derived from n = 5 independent donor mice per cohort. Error bars represent sample mean ± SEM. Statistical significance determined using Student’s t test. *, P < 0.05; **, P < 0.01; ***, P < 0.001. NEU, neutrophil; PLT, platelet.
Figure 5.
Figure 5.
Loss of endothelial mTOR recapitulates a subset of transcriptional changes observed during physiological aging. (A) Representative immunofluorescence images of femurs intravitally labeled with a vascular-specific VE-cadherin (VECAD) antibody (red) demonstrating normal vascular morphology in mTOR(ECKO) mice (n = 4 mice per cohort). Scale bar represents 100 µm. (B) Frequency of phenotypic BMECs per 106 femur cells assessed by flow cytometry (n = 7 mice per cohort). (C) Frequency of apoptotic BMECs (Annexin V+) assessed by flow cytometry (n = 7 mice per cohort). (D) Cell-cycle analysis of BMECs (Ki-67/Hoechst staining) assessed by flow cytometry (n = 7 mice per cohort). (E) Agarose gel electrophoresis image of RT-PCR amplicons for the indicated genes using RNA isolated from FACS-sorted BMECs and HSCs in the indicated genotypes (n = 3 mice per cohort). Data in A–E represent combined analysis of two independent experiments. (F) Transcriptional profiling of BMECs by microarray in the indicated genotypes (n = 3 mice per cohort). (G) Reactome Pathway analysis of genes differentially expressed in aged BMECs compared with young BMECs. (H) Venn diagram comparing genes showing significant changes between aged BMECs in the current study and a previously published meta-analysis. (I) Genes listed demonstrate concordant changes in expression between the current study and published dataset. (J) RT-qPCR evaluation of aging-signature genes in BMECs derived from mTOR(ECKO) and aged mice (n = 3 mice per cohort). Note: BMECs from mTOR(ECKO) mice demonstrate gene expression changes similar to those of aged BMECs. (K and L) RT-qPCR evaluation of genes identified to exhibit congruent expression in BMECs derived from mTOR(ECKO) and aged mice by microarray (n = 3 mice per cohort). (M) RT-qPCR evaluation of known angiocrine factors in BMECs derived from mTOR(ECKO) and aged mice (n = 3 mice per cohort). Error bars represent sample mean ± SEM. Statistical significance determined using Student’s t test. *, P < 0.05; **, P < 0.01; ***, P < 0.001. n.s., not statistically significant; NTC, no template control.

References

    1. Aranda, J.F., Reglero-Real N., Marcos-Ramiro B., Ruiz-Sáenz A., Fernández-Martín L., Bernabé-Rubio M., Kremer L., Ridley A.J., Correas I., Alonso M.A., and Millán J.. 2013. MYADM controls endothelial barrier function through ERM-dependent regulation of ICAM-1 expression. Mol. Biol. Cell. 24:483–494. 10.1091/mbc.e11-11-0914 - DOI - PMC - PubMed
    1. Armand, P., Kim H.T., Sainvil M.M., Lange P.B., Giardino A.A., Bachanova V., Devine S.M., Waller E.K., Jagirdar N., Herrera A.F., et al. . 2016. The addition of sirolimus to the graft-versus-host disease prophylaxis regimen in reduced intensity allogeneic stem cell transplantation for lymphoma: a multicentre randomized trial. Br. J. Haematol. 173:96–104. 10.1111/bjh.13931 - DOI - PMC - PubMed
    1. Balducci, L. 2003. Myelosuppression and its consequences in elderly patients with cancer. Oncology (Williston Park). 17(11, Suppl 11):27–32. - PubMed
    1. Baumgartner, C., Toifl S., Farlik M., Halbritter F., Scheicher R., Fischer I., Sexl V., Bock C., and Baccarini M.. 2018. An ERK-Dependent Feedback Mechanism Prevents Hematopoietic Stem Cell Exhaustion. Cell Stem Cell. 22:879–892.e6: E6. 10.1016/j.stem.2018.05.003 - DOI - PMC - PubMed
    1. Benedito, R., Roca C., Sörensen I., Adams S., Gossler A., Fruttiger M., and Adams R.H.. 2009. The notch ligands Dll4 and Jagged1 have opposing effects on angiogenesis. Cell. 137:1124–1135. 10.1016/j.cell.2009.03.025 - DOI - PubMed

Publication types

MeSH terms

Substances