. 2020 Aug;63(2):209-218.
doi: 10.1165/rcmb.2019-0339OC.

S1P1 Contributes to Endotoxin-enhanced B-Cell Functions Involved in Hypersensitivity Pneumonitis

Affiliations

S1P1 Contributes to Endotoxin-enhanced B-Cell Functions Involved in Hypersensitivity Pneumonitis

Carole-Ann Huppé et al. Am J Respir Cell Mol Biol. 2020 Aug.

Abstract

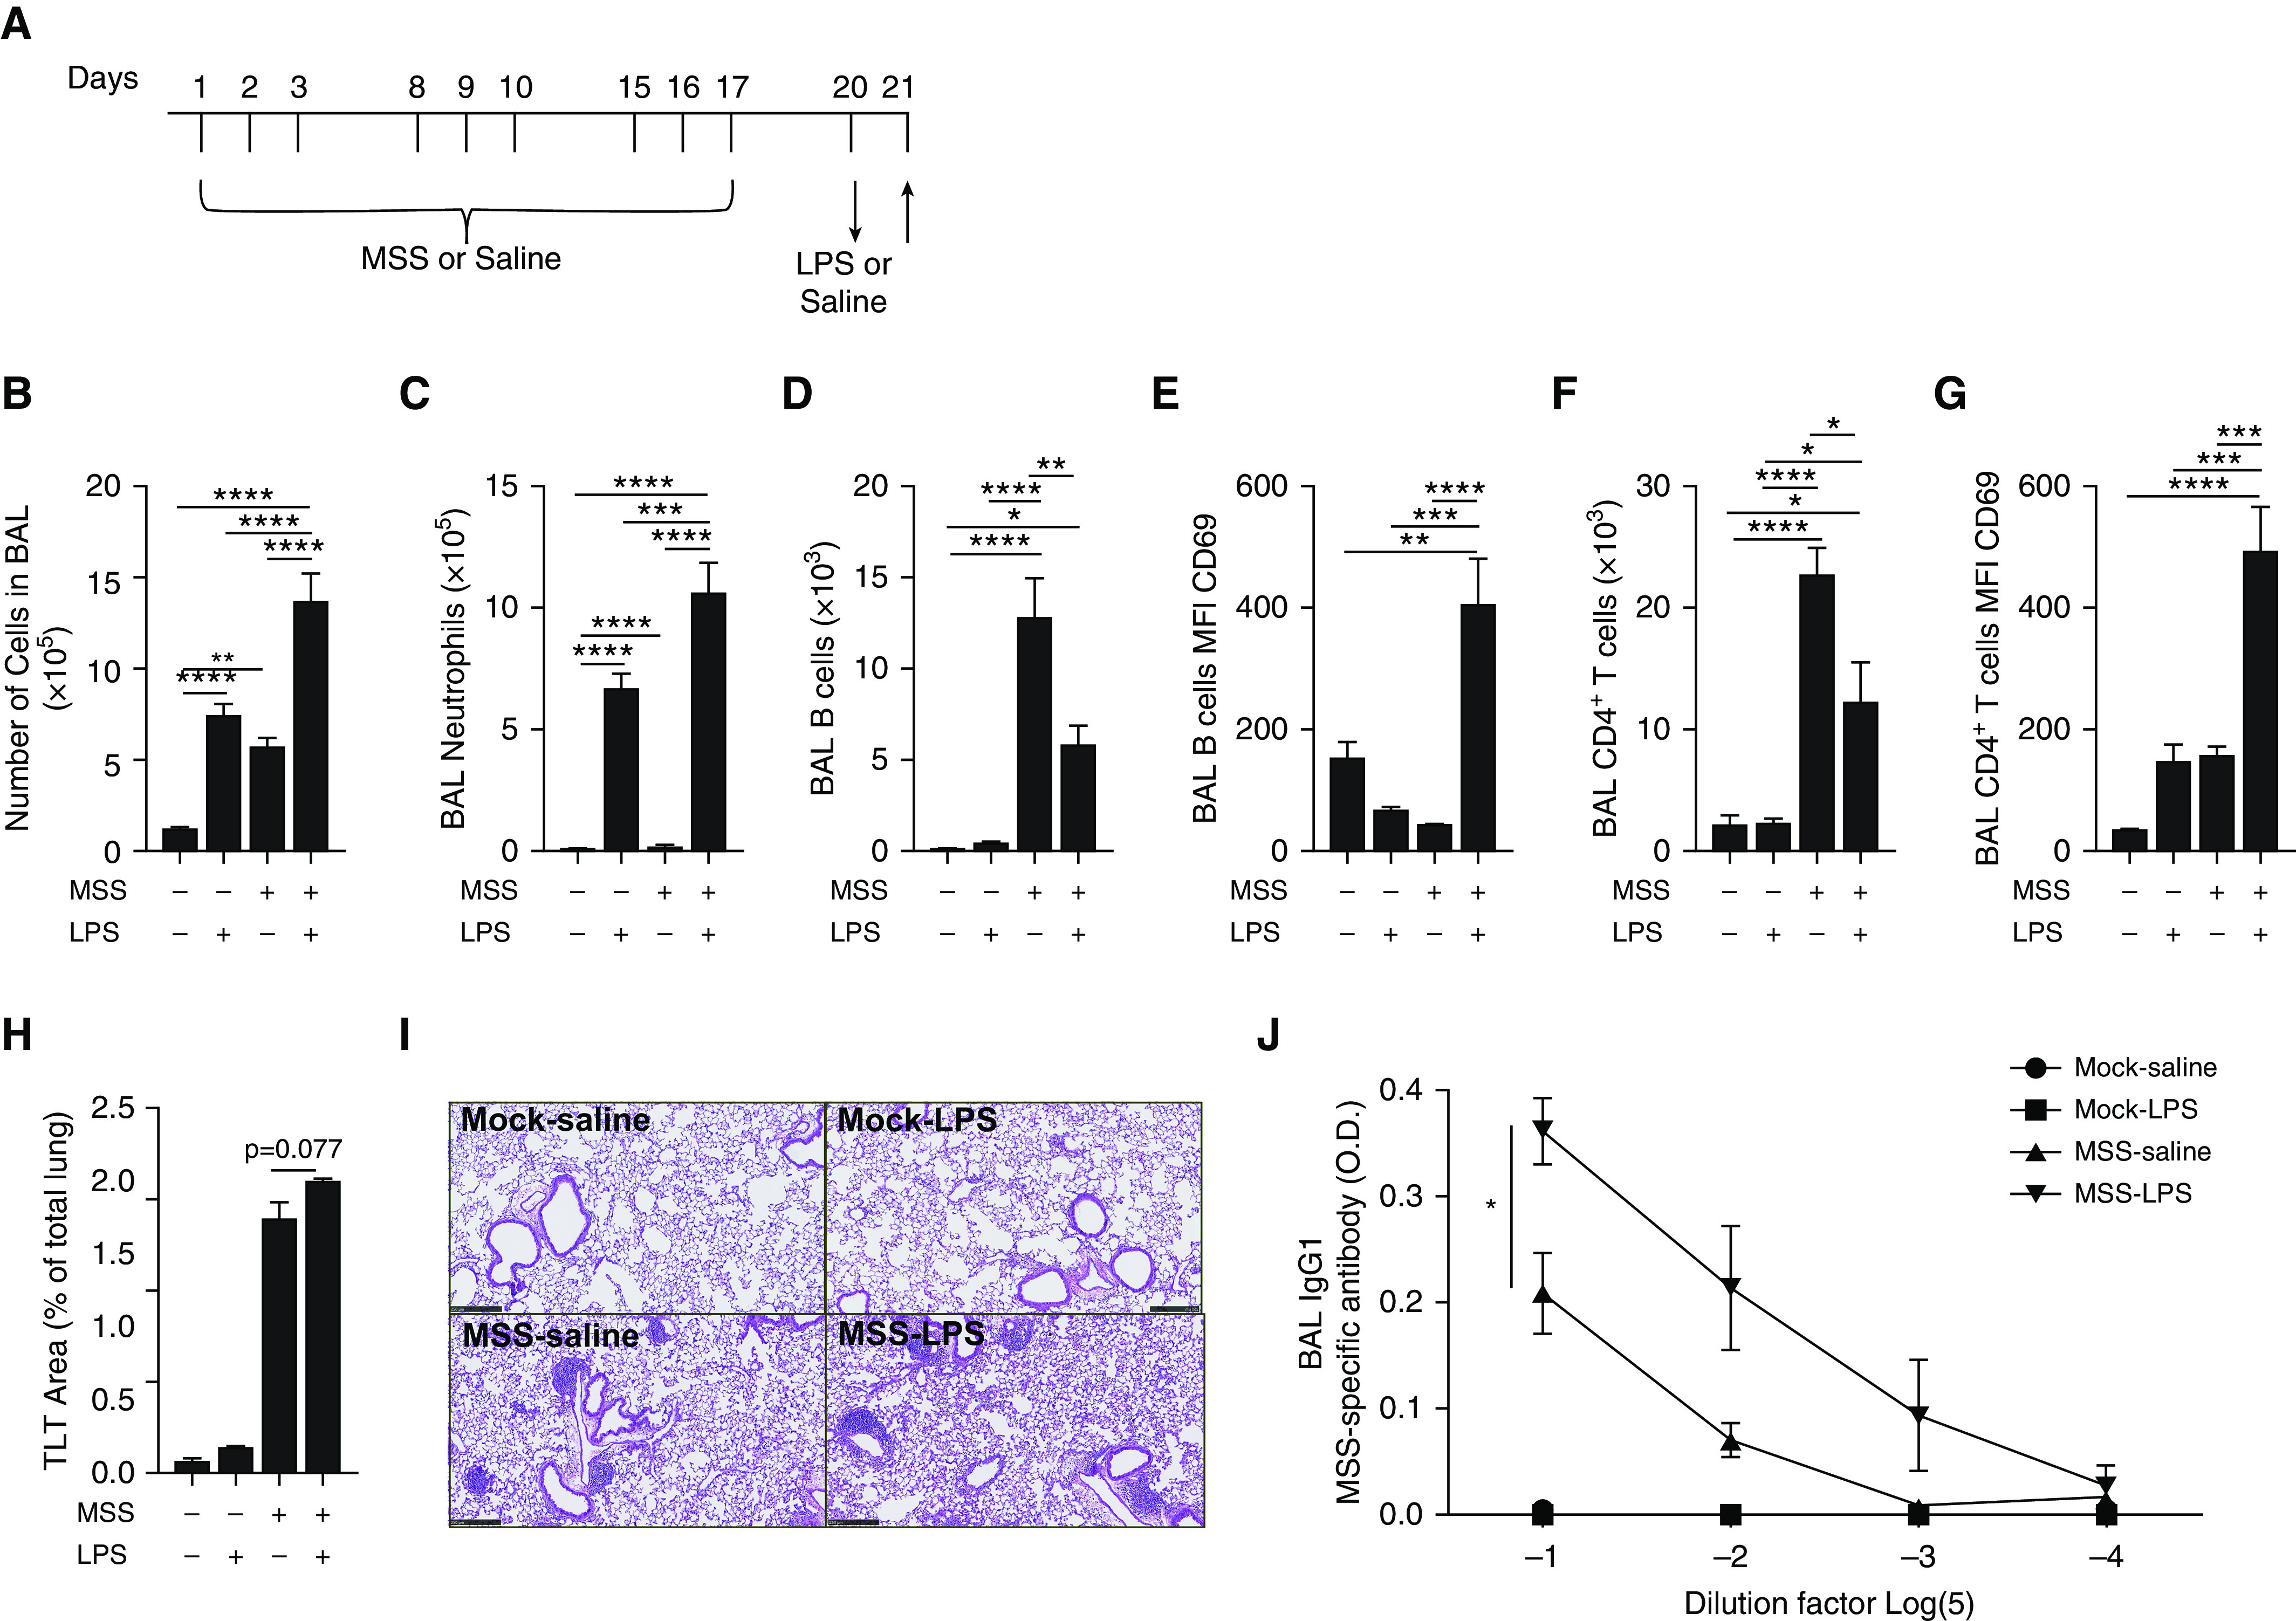
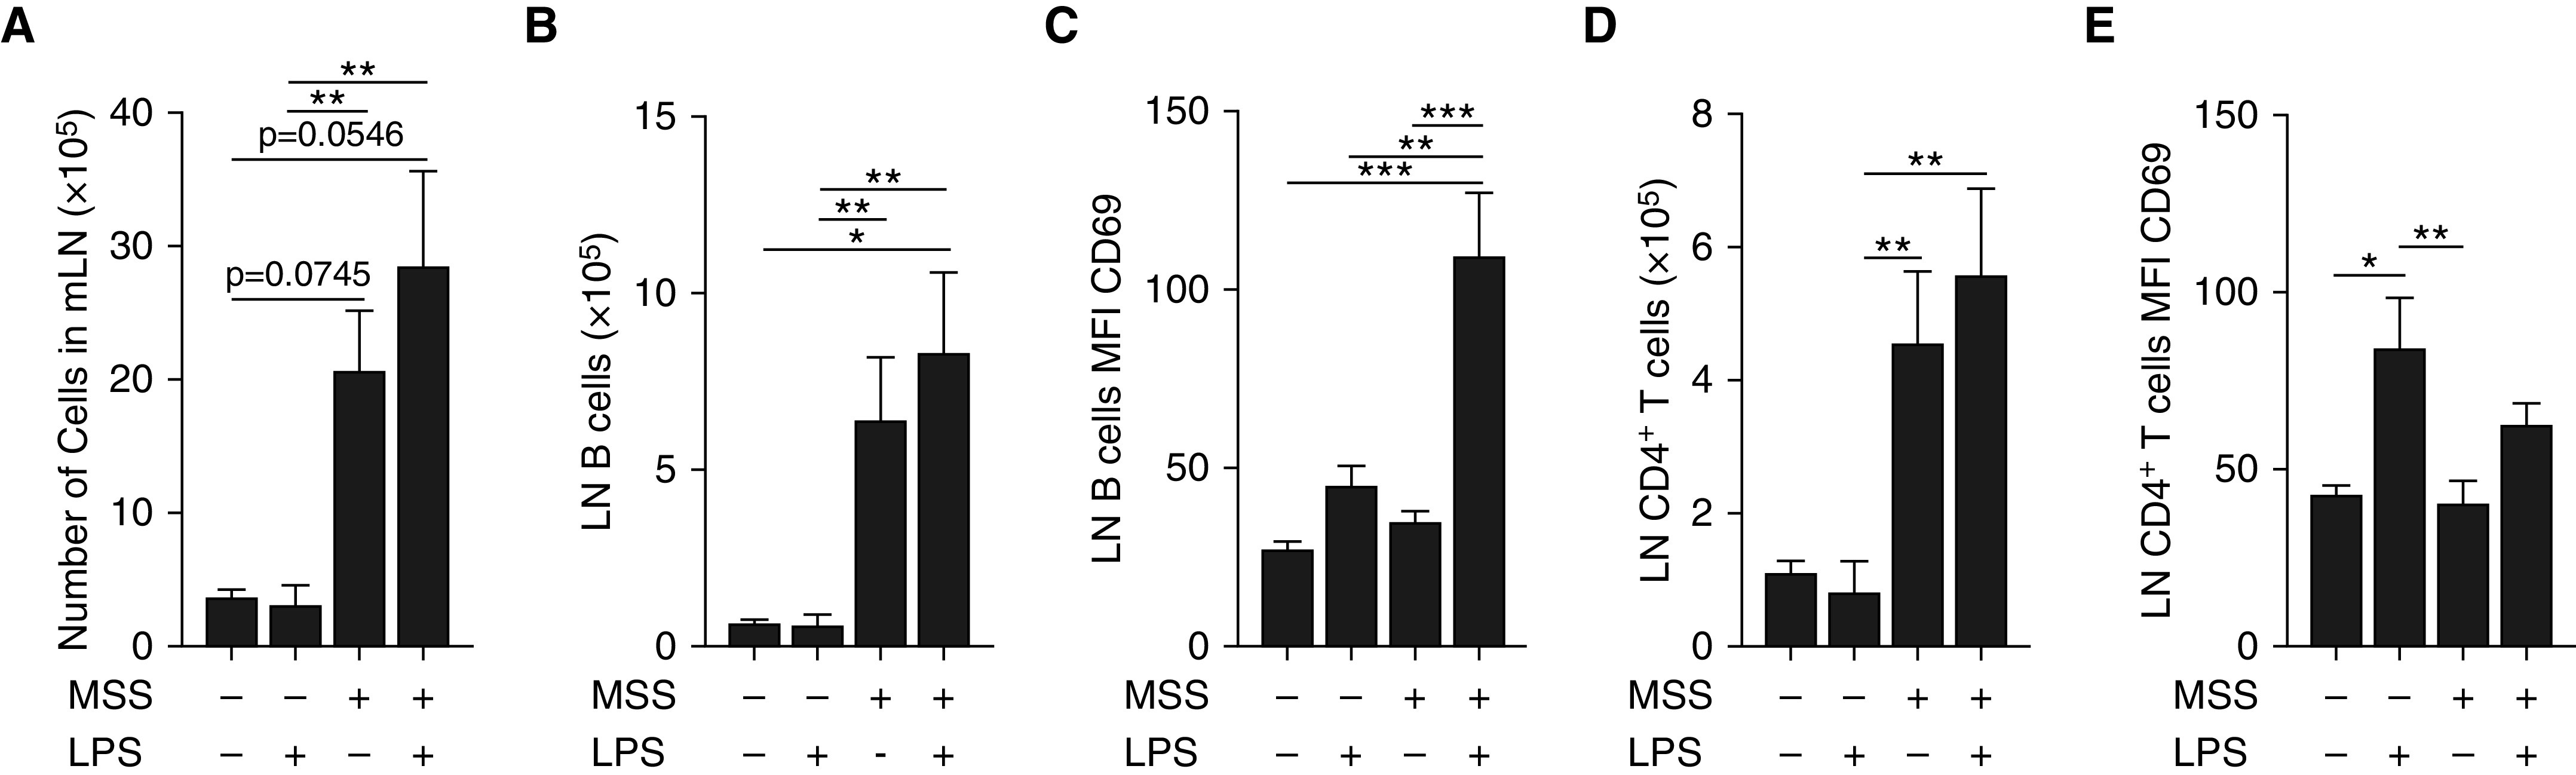
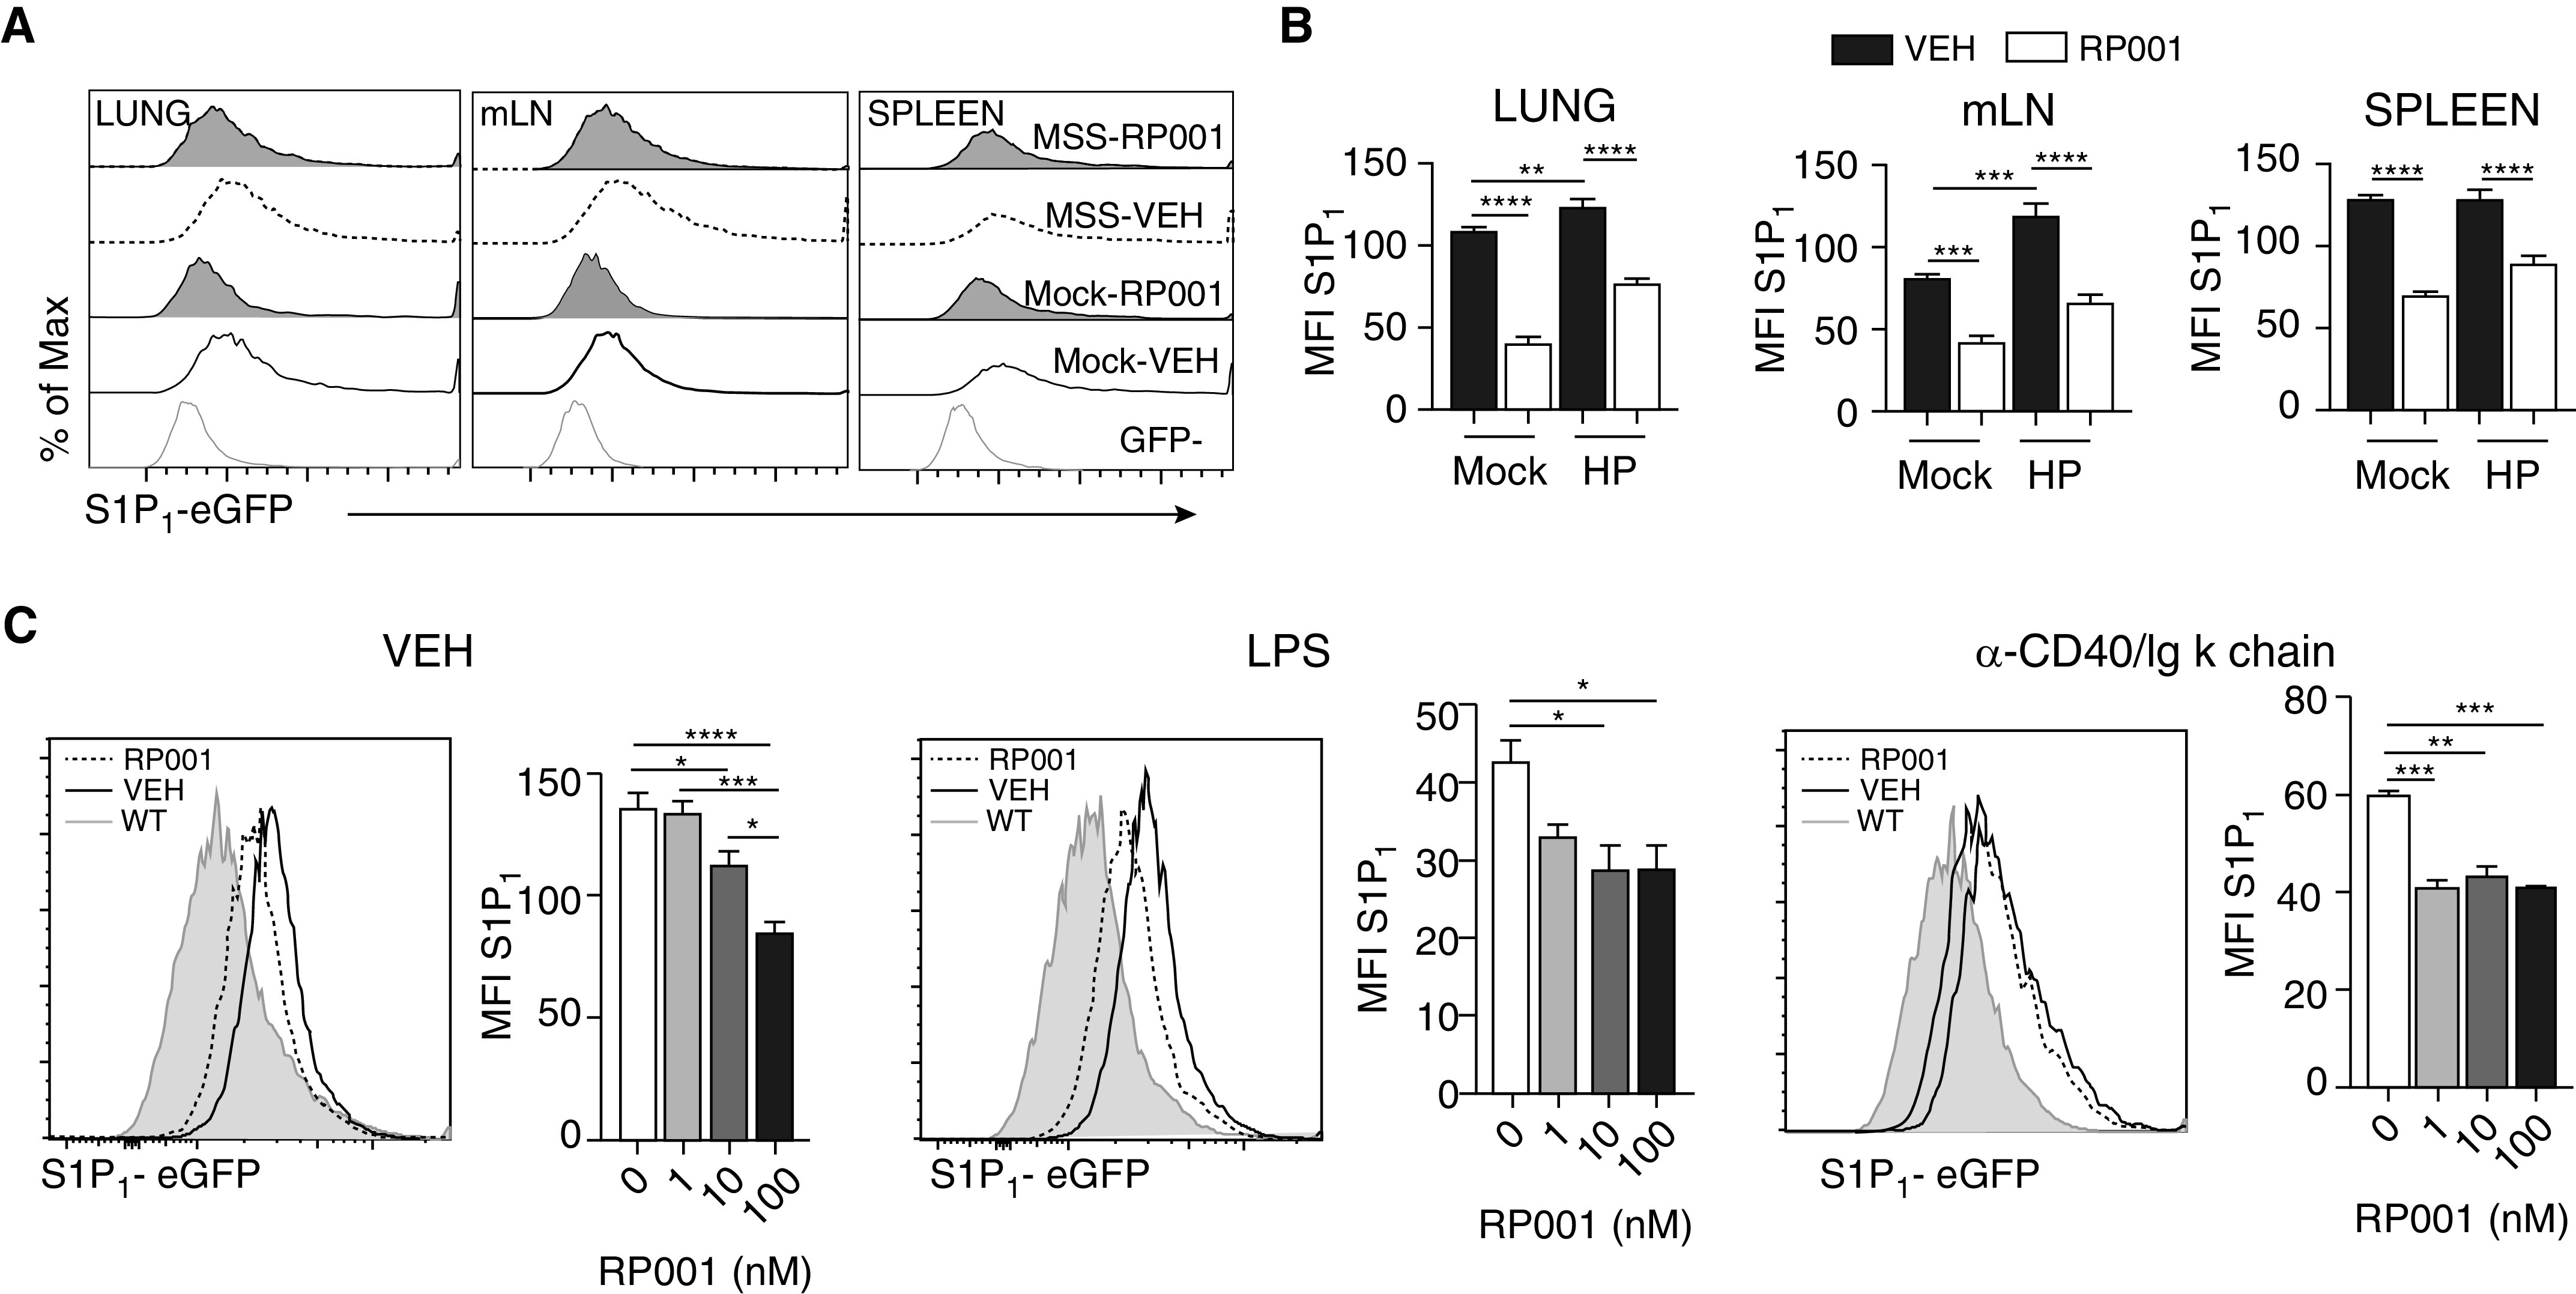
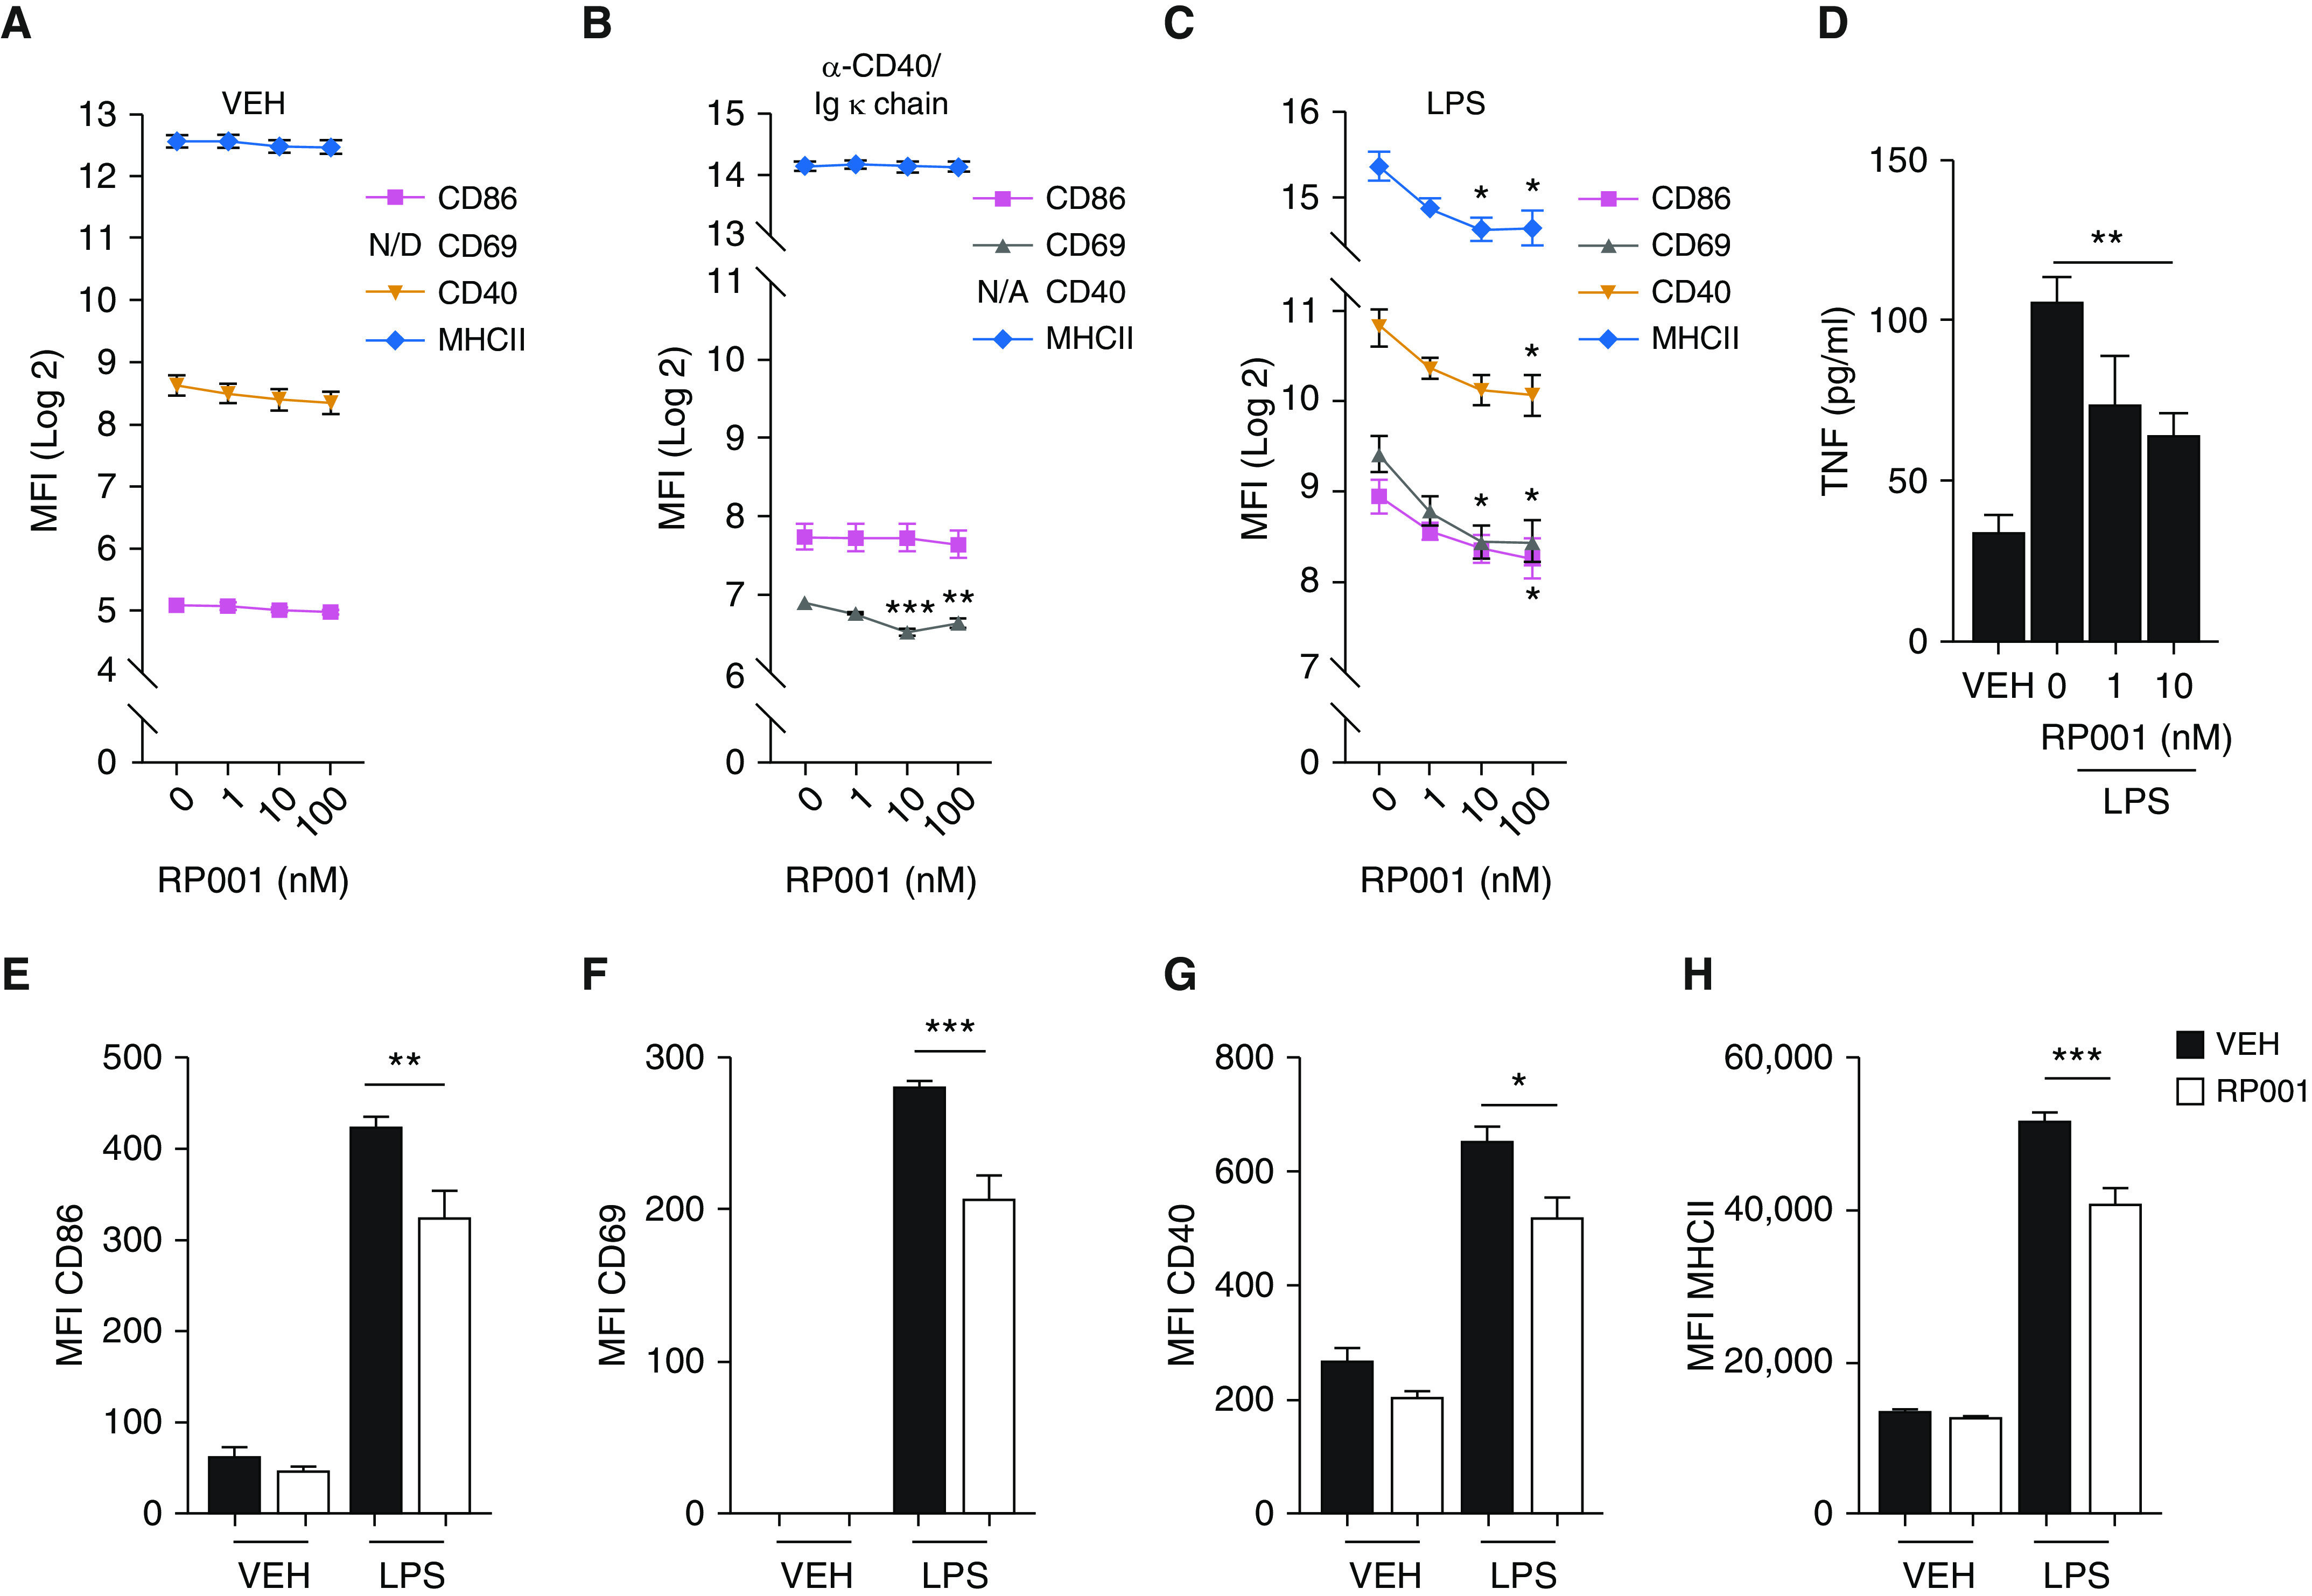
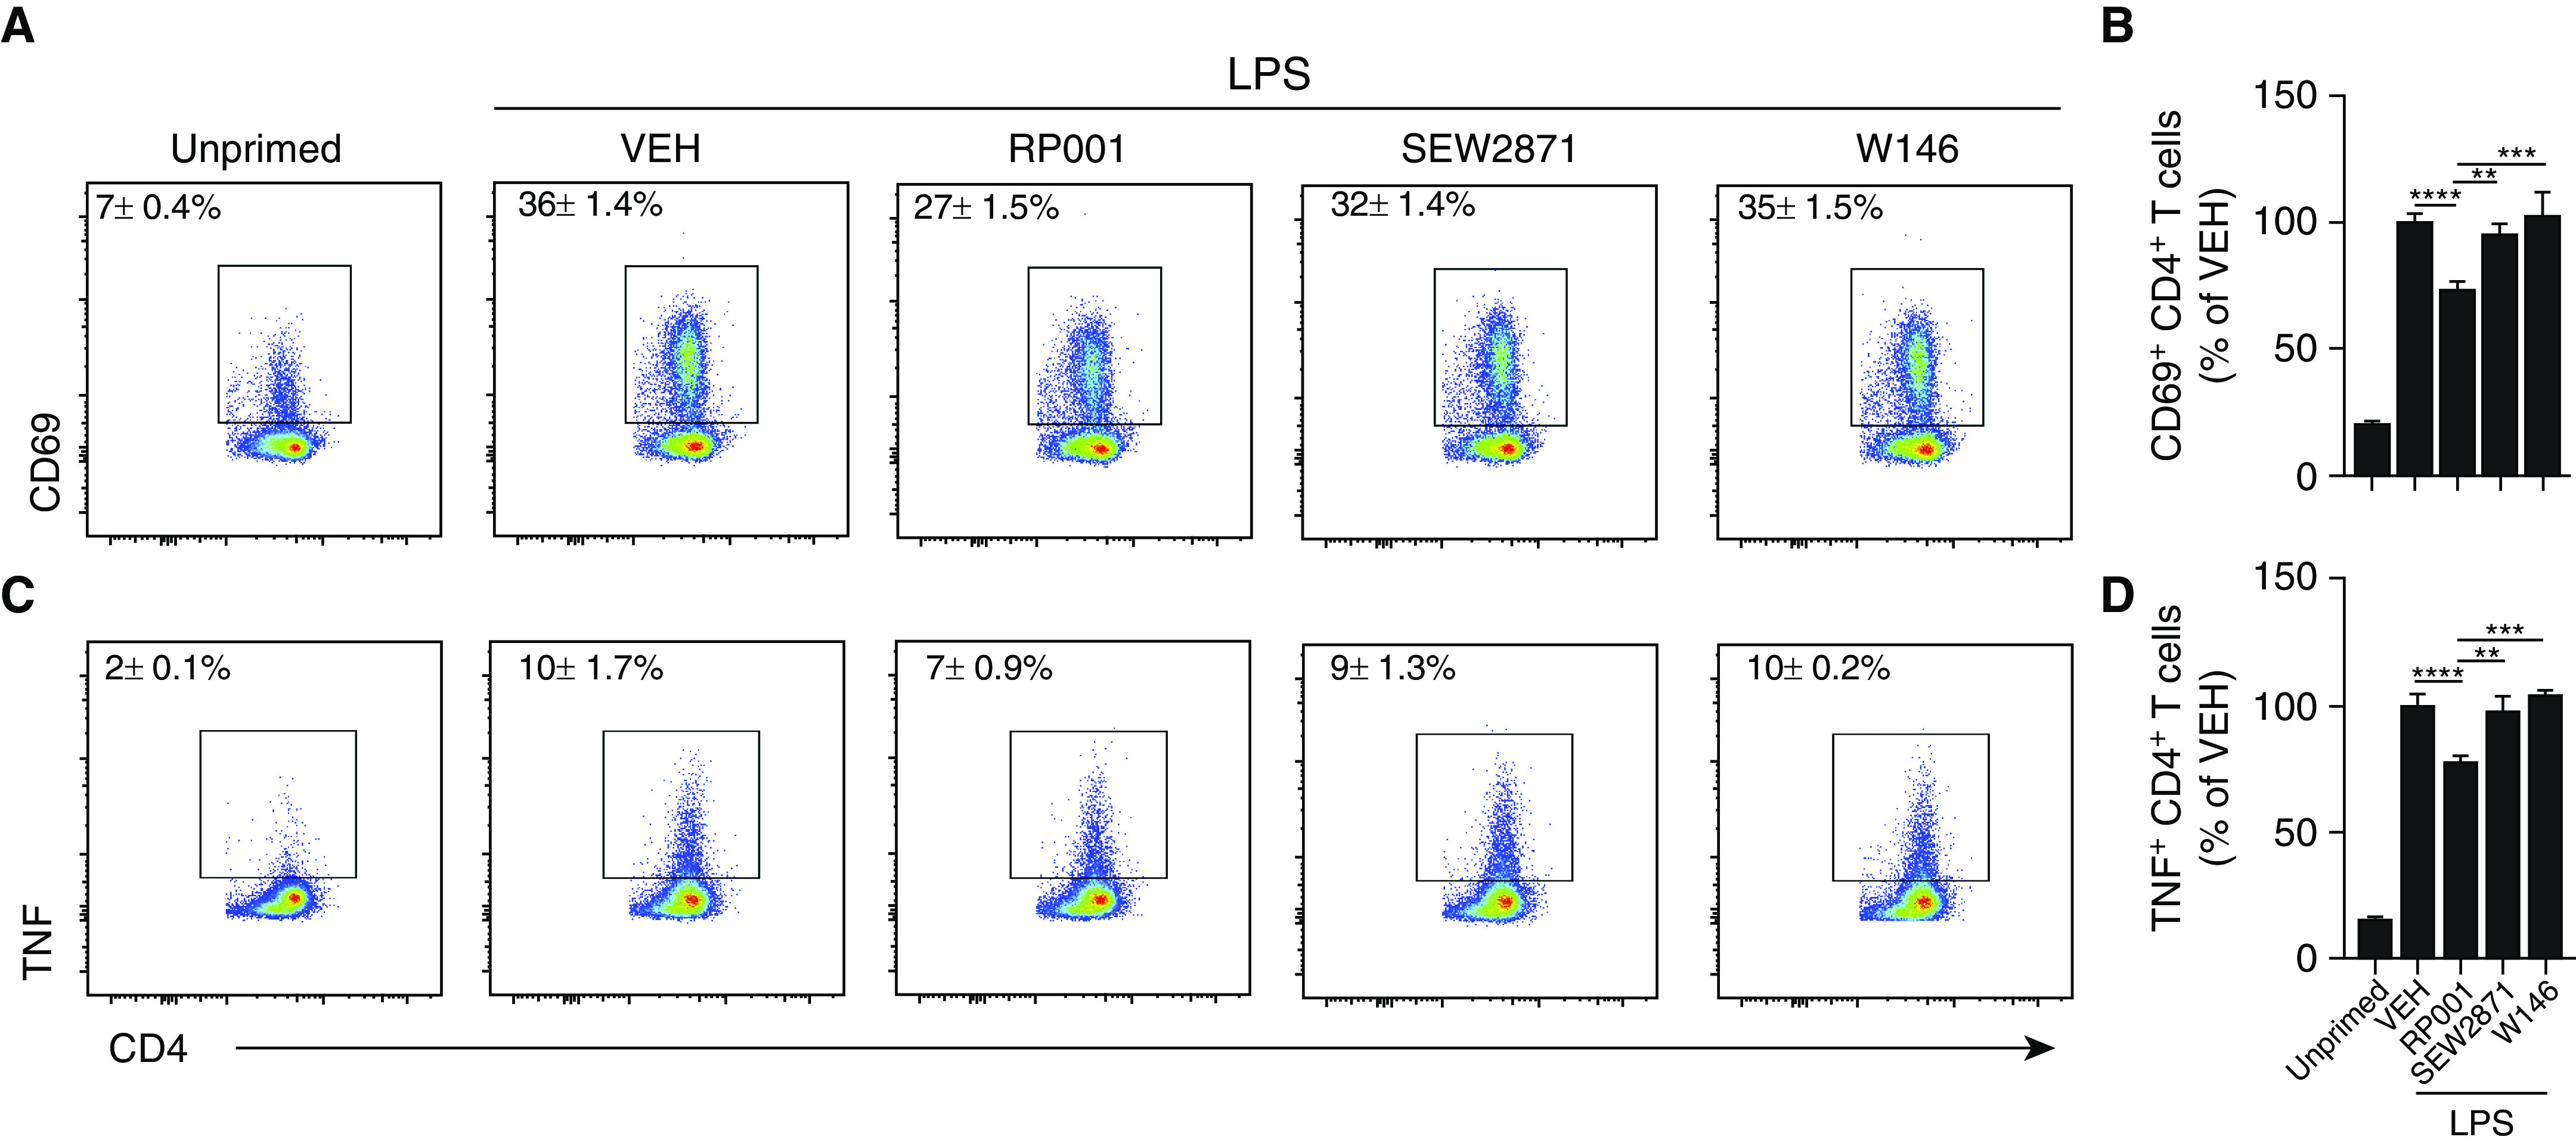
In a proportion of patients with hypersensitivity pneumonitis, the biological and environmental factors that sustain inflammation are ill defined, resulting in no effective treatment option. Bioaerosols found in occupational settings are complex and often include Toll-like receptor ligands, such as endotoxins. How Toll-like receptor ligands contribute to the persistence of hypersensitivity pneumonitis, however, remains poorly understood. In a previous study, we found that an S1P1 (sphingosine-1-phosphate receptor 1) agonist prevented the reactivation of antigen-driven B-cell responses in the lung. Here, we assessed the impact of endotoxins on B-cell activation in preexisting hypersensitivity pneumonitis and the role of S1P1 in this phenomenon. The impact of endotoxins on pre-established hypersensitivity pneumonitis was studied in vivo. S1P1 levels were tracked on B cells in the course of the disease using S1P1-eGFP knockin mice, and the role of S1P1 on B-cell functions was assessed using pharmacological tools. S1P1 was found on B cells in experimental hypersensitivity pneumonitis. Endotoxin exposure enhanced neutrophil accumulation in the BAL of mice with experimental hypersensitivity pneumonitis. This was associated with enhanced CD69 cell-surface expression on lymphocytes in the BAL. In isolated B cells, endotoxins increased cell-surface levels of costimulatory molecules and CD69, which was prevented by an S1P1 agonist. S1P1 modulators also reduced TNF production by B cells and their capacity to trigger T-cell cooperation ex vivo. An S1P1 ligand directly inhibited endotoxin-induced B-cell activation.

Keywords: TLR4; TNF; antibodies; extrinsic allergic alveolitis; ozanimod.


Figures

Figure 1.
Figure 1.
LPS challenge exacerbates preexisting experimental hypersensitivity pneumonitis (HP). (A) Mice were exposed to saline (Mock) or 100 μg of Methanosphaera stadtmanae (MSS) three times a week for 3 weeks (Days 1–3, 8–10, and 15–17) and challenged with saline or 5 μg of LPS (Day 20) 16 hours before euthanasia. Upward arrow indicates the time point when analyses were performed. (B and C) Total cell number (B) and neutrophil number (C) in the BAL were determined with hemocytometer count and differential staining. (D–G) Using flow cytometry, we quantified B cells (D), CD69 median fluorescence intensity (MFI) at the B-cell surface (E), CD4+ T cells (F), and CD69 MFI at the CD4+ T-cell surface (G). (H) The percentage of the lung area occupied by tertiary lymphoid tissues (TLTs) was determined on paraffin-embedded lung slices after hematoxylin and eosin staining. (I) Histology representative of the different experimental groups are shown. Scale bars, 250 μM. (J) MSS-specific IgG1s were quantified by indirect ELISA in BAL supernatant dilutions. Averages ± SEM. n = 6. *P < 0.05, **P < 0.01, ***P < 0.005, and ****P < 0.001. O.D. = optical density.
Figure 2.
Figure 2.
Impact of LPS challenge on lymphocyte subsets in mediastinal lymph nodes (mLNs). Mice were exposed to saline (Mock) or 100 μg of MSS three times a week for 3 weeks (Days 1–3, 8–10, and 15–17) and challenged with saline or 5 μg of LPS (Day 20) 16 hours before euthanasia. (A) Total cell numbers in mLNs were determined by direct cell count with a hemocytometer. (B–E) Using flow cytometry, we quantified B cells (B), CD69 MFI at the B-cell surface (C), CD4+ T cells (D), and CD69 MFI at the CD4+ T-cell surface (E). Averages ± SEM. n = 6. *P < 0.05, **P < 0.01, and ***P < 0.005.
Figure 3.
Figure 3.
S1P1-eGFP (sphingosine-1-phosphate receptor 1–eGFP) is increased on B cells during experimental HP. (A) S1P1-eGFP mice were exposed to 100 μg MSS (Days 1–3, 8–10, and 15–17) and euthanized on Days 2, 4, 18, 24, and 38 (indicated by upward arrows). (B) Gating strategy for CD45+CD90CD19+ B cells and CD45+CD90+CD19 T cells. (C) Representative flow cytometry scatterplots and histograms of S1P1-eGFP signal in B cells (left columns) and T cells (right columns) in naive S1P1-eGFP mice and on Days 18 and 38 in S1P1-eGFP mice exposed to MSS. In histograms, the gray area represents the signal distribution in wild-type (WT) mice and the black dotted line represents the peak of fluorescence in naive S1P1-eGFP mice. (D and E) The frequency of S1P1-eGFP+ cells and the MFI of S1P1-eGFP were quantified in both B cells (D) and T cells (E). For MFI, baseline fluorescence was removed using values from experimental condition-matched WT mice. Averages ± SEM. n = 3–7 mice per point. *P < 0.05, **P < 0.01, and ****P < 0.001. FSC-A = forward scatter area; SSC-A = side scatter area.
Figure 4.
Figure 4.
RP001 induces S1P1 downregulation in B cells. WT and S1P1-eGFP mice were exposed to saline (Mock) or MSS 100 μg three times a week for 3 weeks before intratracheal administration of RP001 1 mg/kg. The mice were euthanized 4 hours later. (A) Representative histograms of S1P1 on B cells are shown. (B) Quantification of S1P1-eGFP MFI on B cells from the lung, mLN, and spleen. (C) Isolated splenic B cells from naive S1P1-eGFP mice were incubated with vehicle (VEH), LPS, or an α-CD40/Igκ-chain cocktail for 72 hours, with increased concentrations of RP001. Representative histograms (left panel; 100 nM) and quantification of S1P1-eGFP MFI (right panel) are presented. Averages ± SEM. (A and B) n = 4–5 mice per group. (C) n = 6–12 replicates from two different experiments performed with similar results. For bar graphs, background fluorescence was removed using experimental conditions–matched WT mice. Averages ± SEM. *P < 0.05, **P < 0.01, ***P < 0.005, and ****P < 0.001.
Figure 5.
Figure 5.
RP001 reduces LPS-induced activation of B cells. (A–C) Splenic B cells were incubated with VEH (A), α-CD40 20 μg/ml and Igκ chain 8 μg/ml (B), or LPS 10 μg/ml (C) in the presence of increasing RP001 concentrations for 24 hours. MFI of CD86, CD69, CD40, and MHCII was determined by flow cytometry. CD69 was below the detection limit in the VEH group, and CD40 was not assessed in the group incubated with the α-CD40/Igκ chain. (D) TNF concentration was quantified by ELISA in culture supernatants after a 72-hour incubation with LPS. (EH) Pulmonary B cells from MSS-sensitized mice euthanized 4 days after the last MSS exposure (Day 21) were isolated and incubated with LPS 10 μg/ml and RP001 (10 nM), and the MFI of CD86 (E), CD69 (F), CD40 (G), and MHCII (H) was assessed. Averages ± SEM. Shown is one experiment representative of three to five independent experiments performed with similar results. Each point was minimally assessed in triplicate for each individual experiment. *P < 0.05, **P < 0.01, and ***P < 0.005. N/A = not applicable; N/D = not detected.
Figure 6.
Figure 6.
RP001 reduces the capacity of B cells to trigger antigen-specific T-cell activation in vitro. B cells isolated from the spleen of WT C57Bl/6j mice were primed overnight with LPS (10 μg/ml) or left unprimed. LPS-primed B cells were coincubated with VEH, RP001 (100 nM), SEW2871 (1 μM), or W146 (10 μM). Cells were then washed, incubated with ovalbumin-peptide (10 μg/ml) for 1 hour, and coincubated with OT-II CD4+ T cells for 12 hours. (A) Representative scatterplots of CD69+ T cells are presented. (B) Bar graph represents the normalized frequency of CD69+ T cells. (C) Representative scatterplots of TNF+ T cells. (D) Bar graph represents the normalized frequency of TNF+ T cells. Averages ± SEM. n = 3 independent experiments. Each point was minimally assessed in triplicate for each individual experiment. **P < 0.01, ***P < 0.005 and ****P < 0.001.

References

    1. Lacasse Y, Girard M, Cormier Y. Recent advances in hypersensitivity pneumonitis. Chest. 2012;142:208–217. - PubMed
    1. Suda T, Chida K, Hayakawa H, Imokawa S, Iwata M, Nakamura H, et al. Development of bronchus-associated lymphoid tissue in chronic hypersensitivity pneumonitis. Chest. 1999;115:357–363. - PubMed
    1. Hanak V, Golbin JM, Ryu JH. Causes and presenting features in 85 consecutive patients with hypersensitivity pneumonitis. Mayo Clin Proc. 2007;82:812–816. - PubMed
    1. Fernández Pérez ER, Kong AM, Raimundo K, Koelsch TL, Kulkarni R, Cole AL. Epidemiology of hypersensitivity pneumonitis among an insured population in the United States: a claims-based cohort analysis. Ann Am Thorac Soc. 2018;15:460–469. - PubMed
    1. Walters GI, Mokhlis JM, Moore VC, Robertson AS, Burge GA, Bhomra PS, et al. Characteristics of hypersensitivity pneumonitis diagnosed by interstitial and occupational lung disease multi-disciplinary team consensus. Respir Med. 2019;155:19–25. - PubMed

Publication types

MeSH terms