. 2020 Apr 13;37(4):551-568.e14.
doi: 10.1016/j.ccell.2020.03.015.

A Probabilistic Classification Tool for Genetic Subtypes of Diffuse Large B Cell Lymphoma with Therapeutic Implications

Affiliations

A Probabilistic Classification Tool for Genetic Subtypes of Diffuse Large B Cell Lymphoma with Therapeutic Implications

George W Wright et al. Cancer Cell. .

Abstract

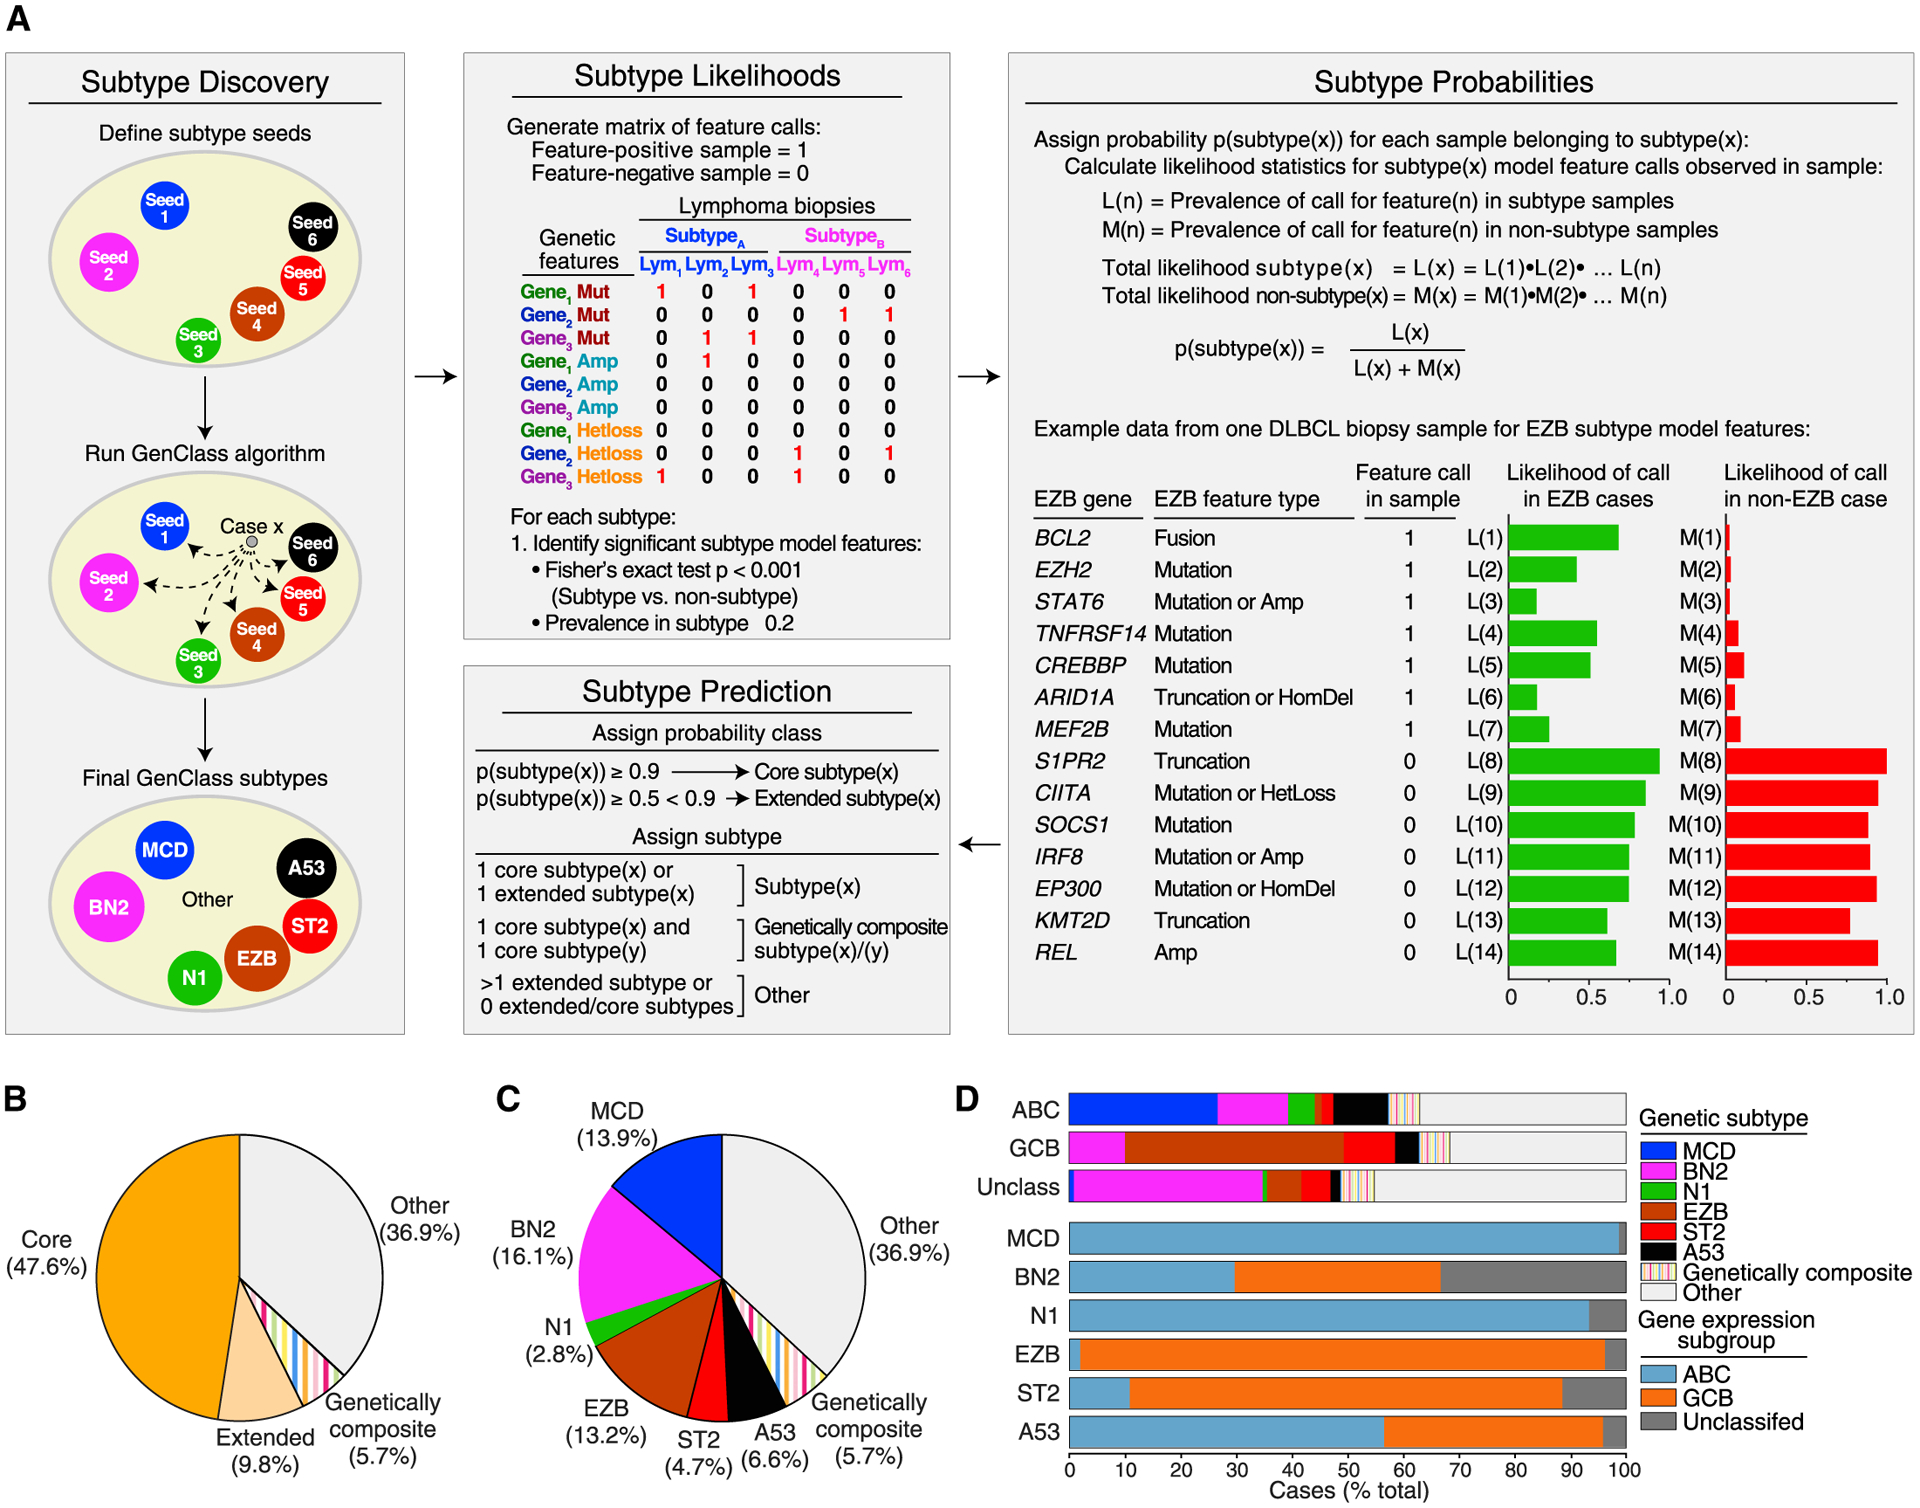
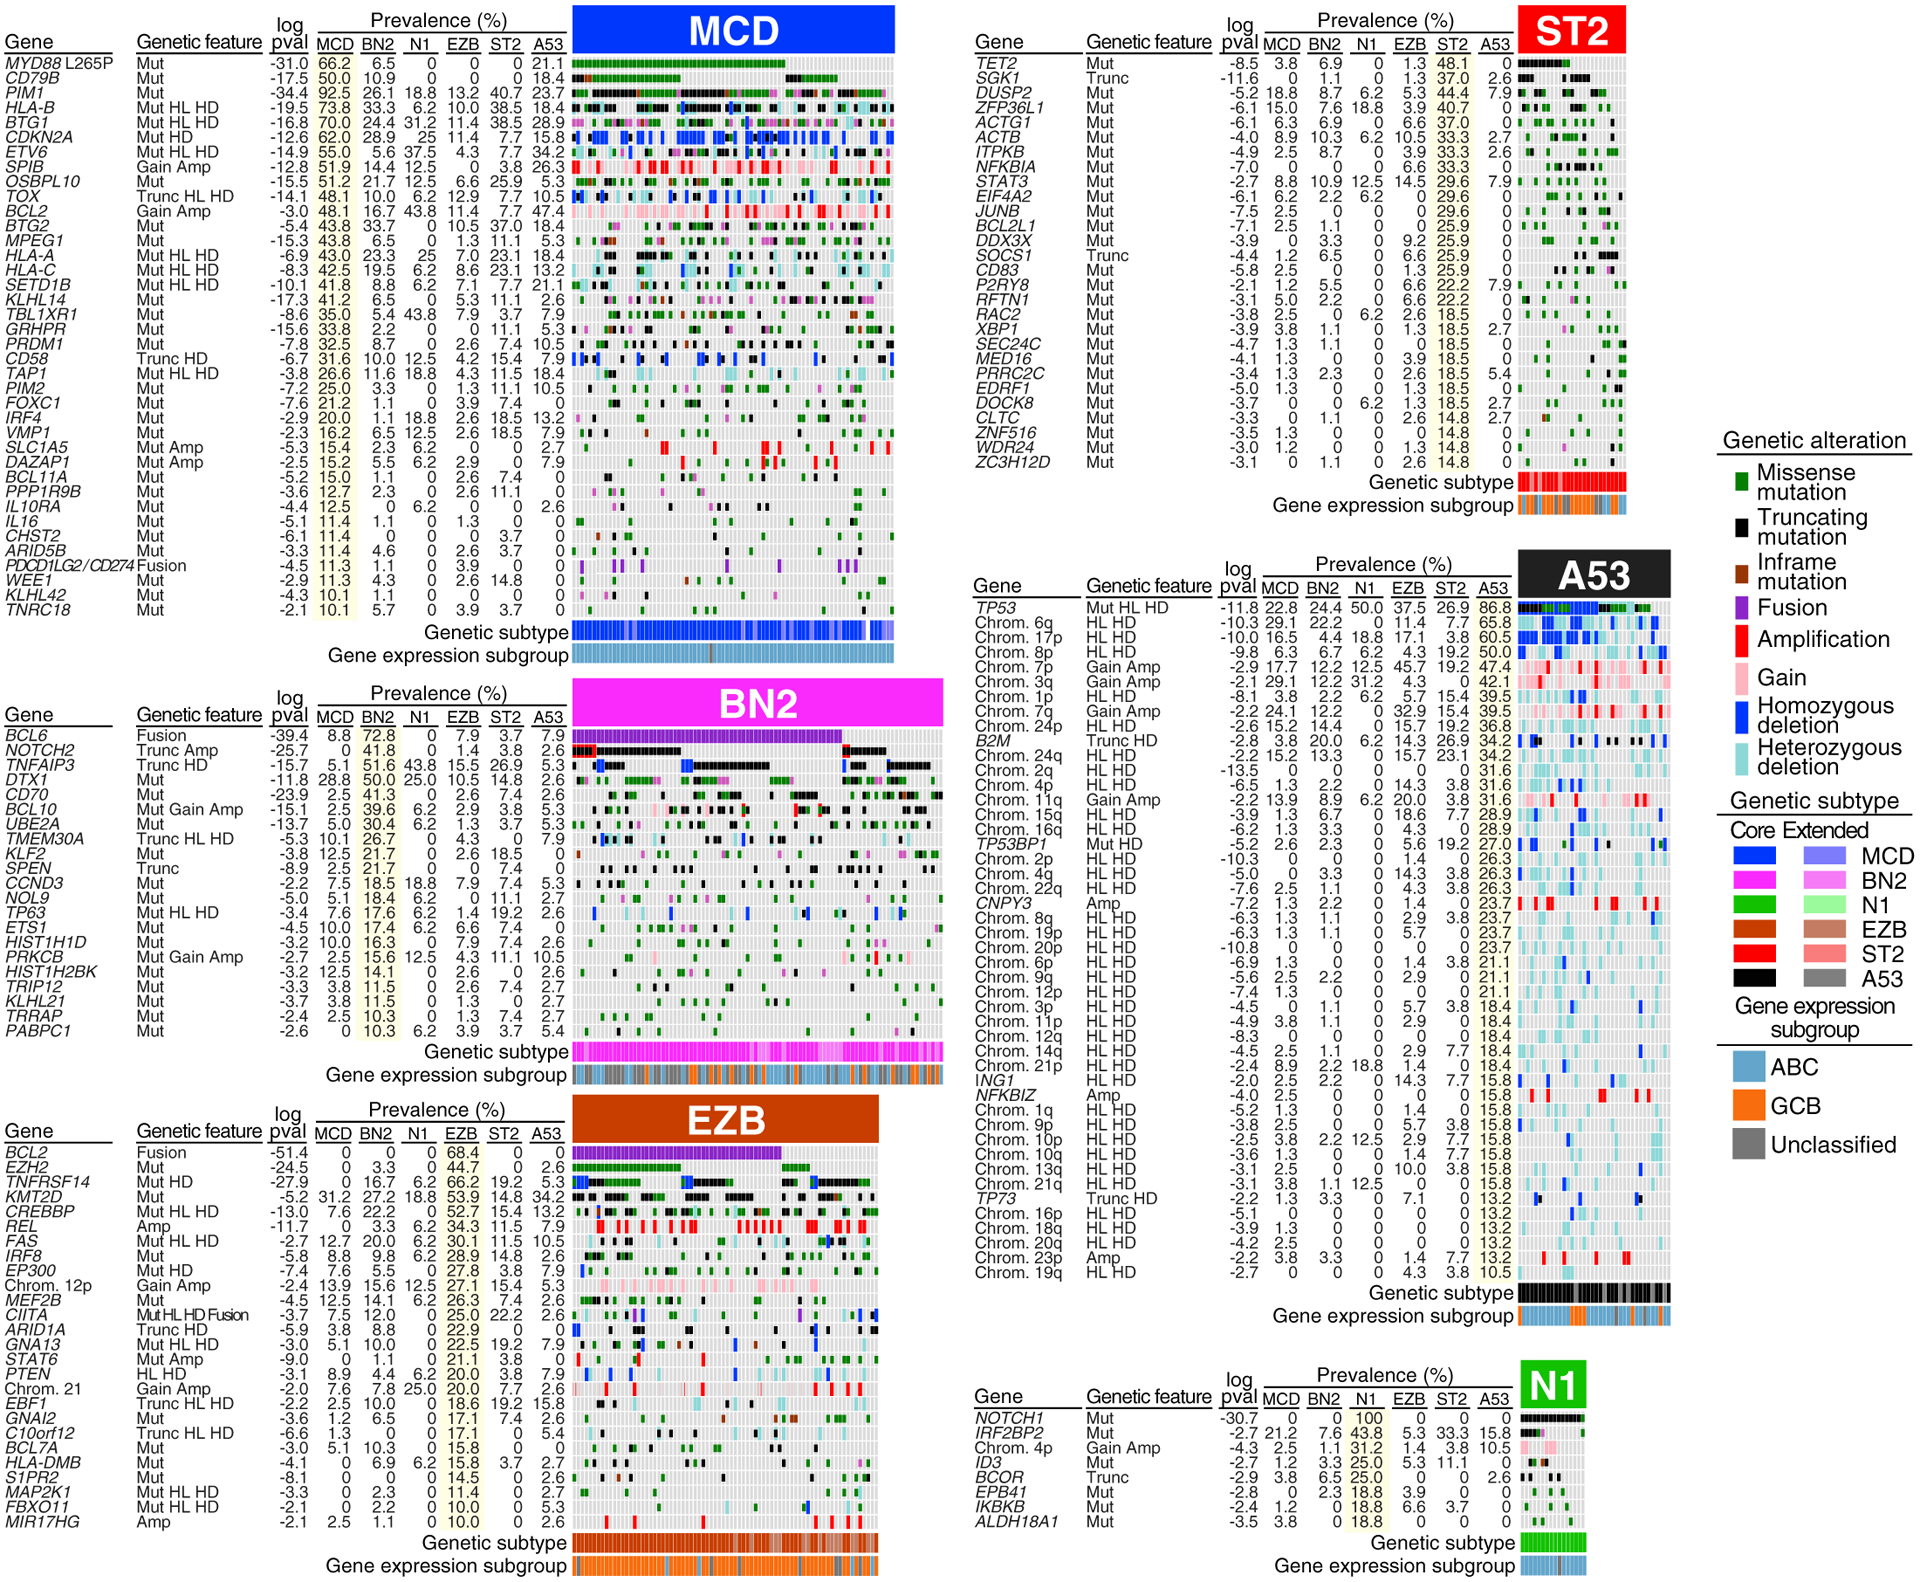
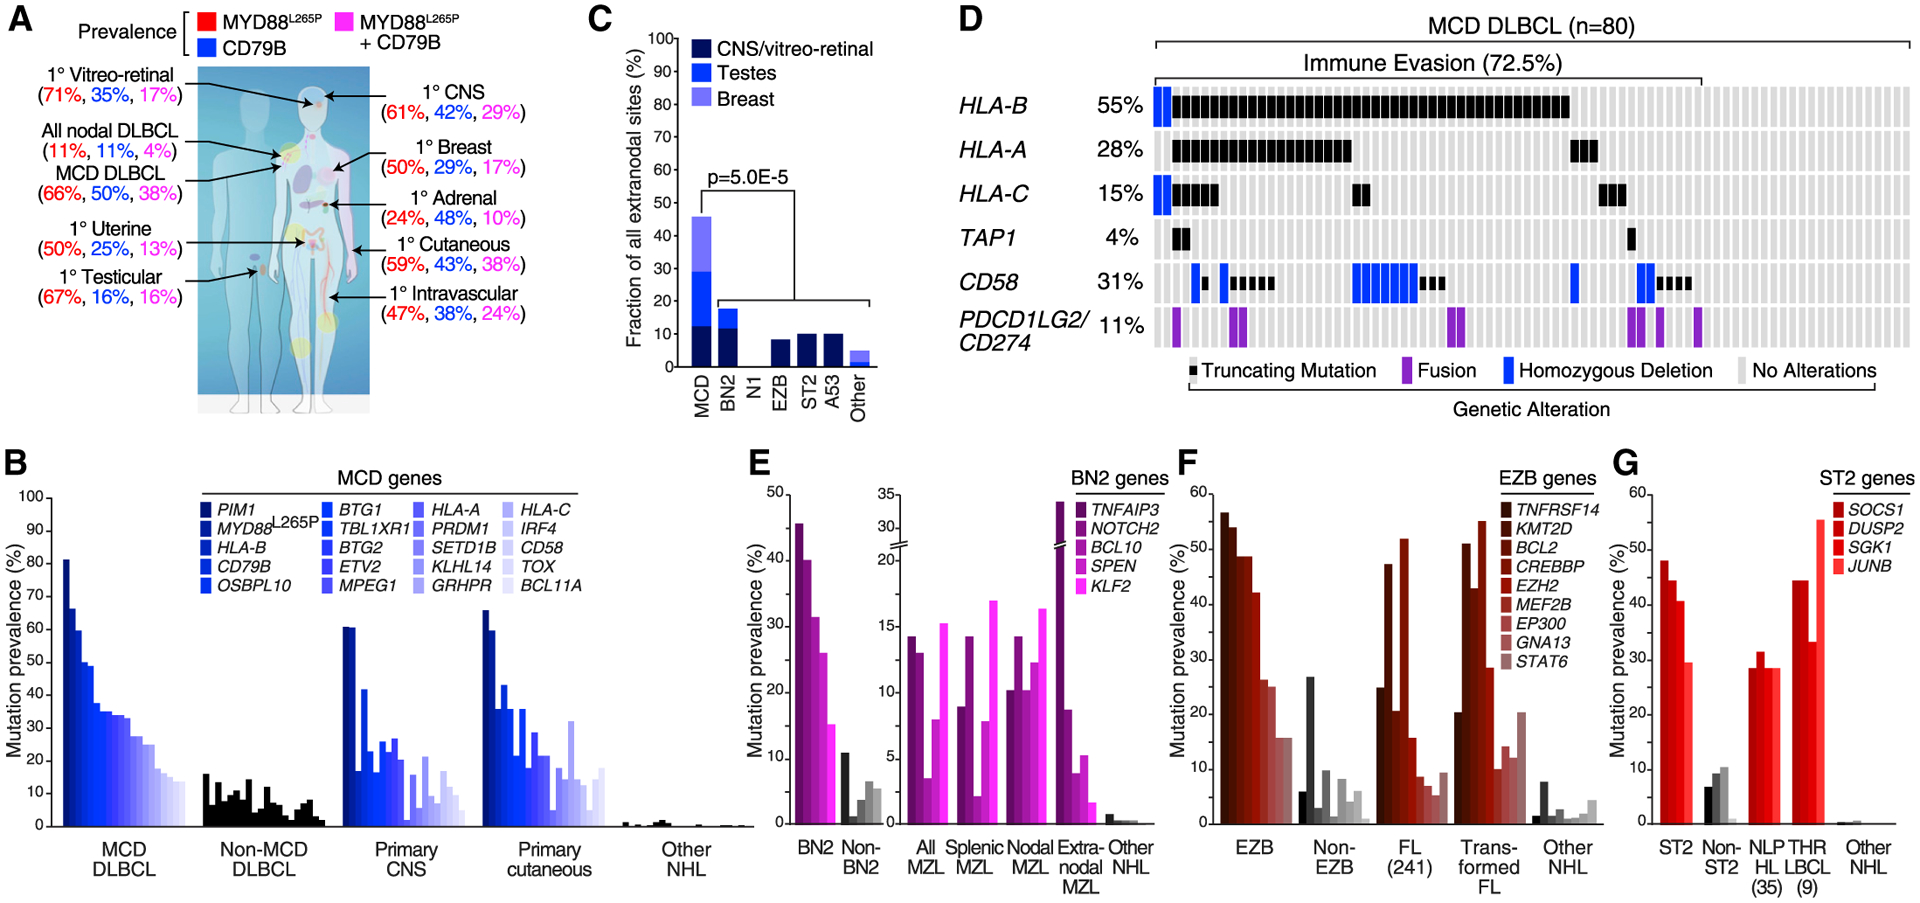
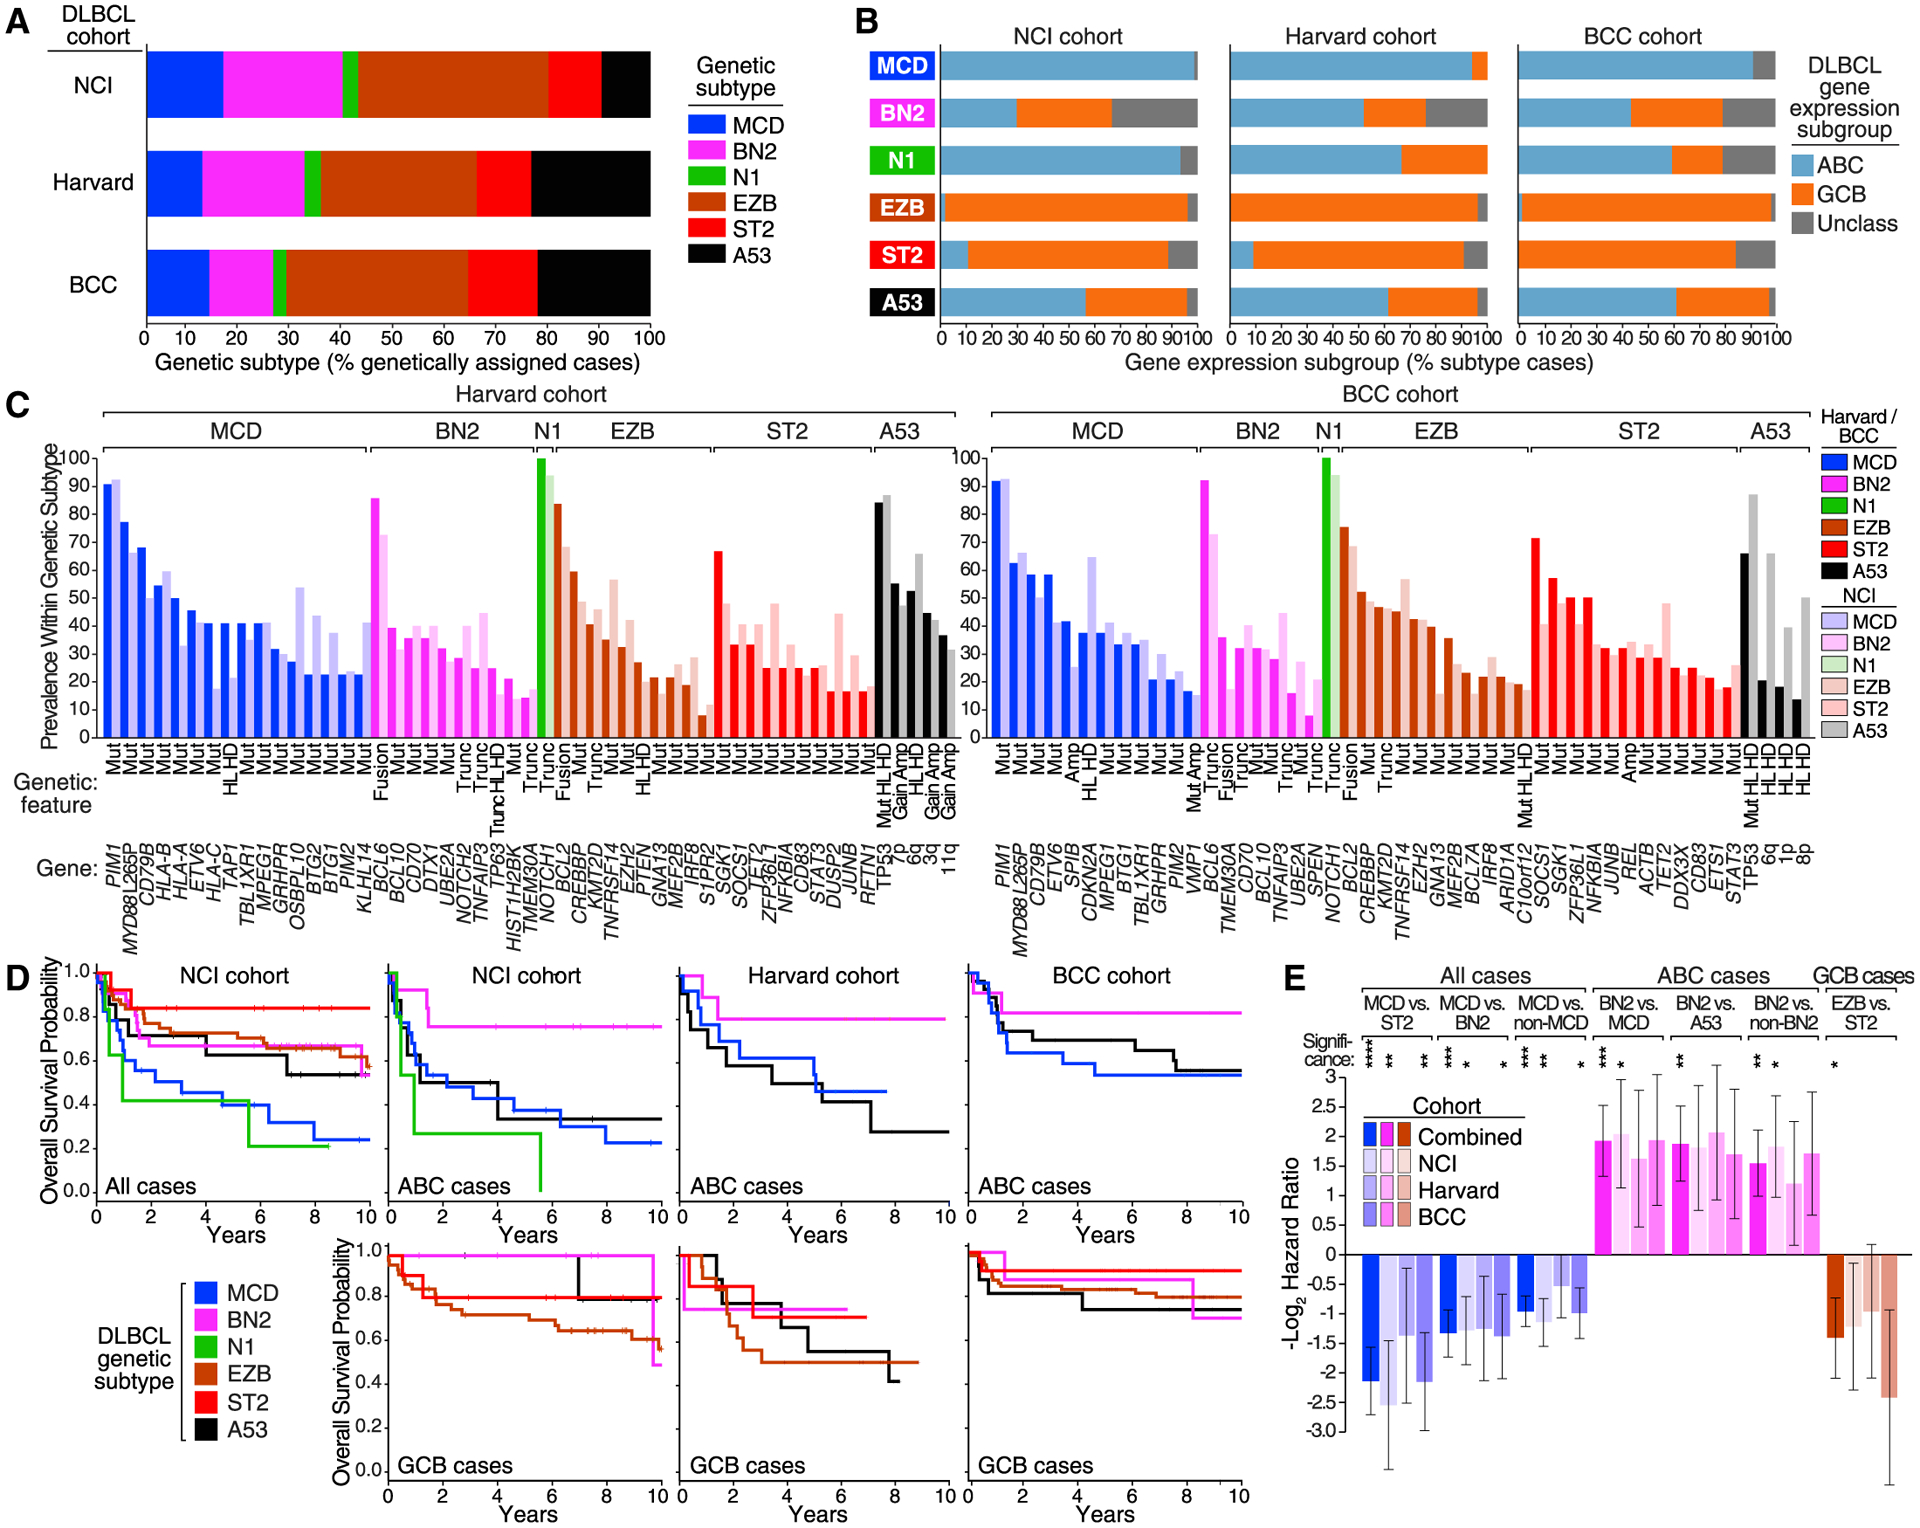
The development of precision medicine approaches for diffuse large B cell lymphoma (DLBCL) is confounded by its pronounced genetic, phenotypic, and clinical heterogeneity. Recent multiplatform genomic studies revealed the existence of genetic subtypes of DLBCL using clustering methodologies. Here, we describe an algorithm that determines the probability that a patient's lymphoma belongs to one of seven genetic subtypes based on its genetic features. This classification reveals genetic similarities between these DLBCL subtypes and various indolent and extranodal lymphoma types, suggesting a shared pathogenesis. These genetic subtypes also have distinct gene expression profiles, immune microenvironments, and outcomes following immunochemotherapy. Functional analysis of genetic subtype models highlights distinct vulnerabilities to targeted therapy, supporting the use of this classification in precision medicine trials.

Keywords: A53; BN2; DLBCL; EZB; LymphGen; MCD; N1; ST2; genomic classification; lymphoma; naive Bayes.


Conflict of interest statement

Declaration of Interests G.W.W., D.W.H., and L.M.S. are inventors on an NIH patent application that is based on the work presented herein. D.W.S. was a consultant for Abbvie, Celgene, and Janssen; received research funding from NanoString Technologies, Janssen, and Roche/Genentech. Authors are included on additional patents, some of which are licensed by NanoString Technologies.

Figures

Figure 1.
Figure 1.. Development of the LymphGen Classifier
(A) Cancer subtype discovery and prediction using the LymphGen algorithm. Shown at left is the discovery of cancer subtypes starting with “seed” sets of cases using the GenClass algorithm (Schmitz et al., 2018). The LymphGen algorithm uses prevalences of genetic features to estimate the likelihood that a feature is associated with a subtype and combines these likelihoods to calculate a probability that a tumor belongs to a genetic subtype. The example shows features associated with the EZB subtype as present (“1”) or absent (“0”) in an individual tumor sample, and the likelihoods that the tumor is EZB or non-EZB based on each feature. The final panel illustrates how LymphGen assigns a tumor using the subtype probabilities. (B) Frequency of cases with high probability (“Core”) or moderate probability (“Extended”) subtype assignments, genetically composite cases, and unassigned (Other) cases. (C) Prevalence of various genetic subtypes. (D) Top: prevalence of subtypes in DLBCL COO subgroups. Bottom: prevalence of COO subgroups within each genetic subtype. See also Figure S1.
Figure 2.
Figure 2.. Genetic Features of DLBCL Genetic Subtypes
Shown is the prevalence of the indicated genetic features in each DLBCL subtype. Log10 p value (pval) is based on the difference in prevalence in the indicated subtype versus all other samples. HL, heterozygous loss; HD, homozygous deletion; Gain, single-copy gain; Amp, amplification; Mut, mutation; Trunc, protein-truncating mutation: Fusion, chromosomal translocation. See also Figure S2.
Figure 3.
Figure 3.. Similarities of DLBCL Genetic Subtypes to Other Lymphoid Malignancies
(A) Prevalence of CD79B and MYD88L265P mutations in the indicated nodal and extranodal forms of DLBCL, shown according to the color code above. The percent prevalence of tumors with the indicated genotypes in each of the indicated lymphoma types is shown according to the color code. (B) Prevalence of MCD-defining mutations in primary CNS lymphoma and primary cutaneous lymphoma. Other NHL, other non-Hodgkin lymphomas (see STAR Methods). (C) Secondary extranodal involvement in genetic subtypes of DLBCL. p Value is based on Fisher’s exact test, (D) Genetic aberrations favoring immune escape in MCD DLBCL. (E) Prevalence of BN2-defining mutations in the indicated types of marginal-zone lymphoma (MZL) and in other NHLs. (F) Prevalence of EZB-defining mutations in follicular lymphoma (FL), transformed FL, and other NHLs. (G) Prevalence of ST2-defining mutations in nodular lymphocyte-predominant Hodgkin lymphoma (NLPHL), T cell/histiocyte-rich large B cell lymphoma (THRLBCL), and other NHLs. See also Figure S3.
Figure 4.
Figure 4.. Validation of the LymphGen Classification
(A) Prevalence of DLBCL subtypes classified by LymphGen. (B) Prevalence of COO subgroups within genetic subtypes. (C) Prevalence of the indicated genetic features within the genetic subtypes defined in the Harvard and BCC cohorts in comparison with the NCI cohort. (D) Kaplan-Meier plots of overall survival within the indicated DLBCL cohorts, in all cases, ABC cases, or GCB cases, as indicated. (E) Hazard ratios (−log2 transformed) for the indicated comparisons between LymphGen subtypes in the indicated DLBCL cohorts. Error bars denote SEM. Significance: ****p ≤ 0.0001; ***p ≤ 0.001; **p ≤ 0.01; *p ≤ 0.05. See also Figures S4 and S5; Tables S1, S2, and S3.
Figure 5.
Figure 5.. Genetic Analysis of the DHIT Signature
(A) Relative expression of DHIT in the indicated subtypes within GCB DLBCL. Error bars indicate SEM. (B) Prevalence of subtypes within DHIT+ GCB DLBCL. (C) Gene set enrichment analysis of DHIT versus the GCB-4 and MYCUp-4 signatures. Cases are ranked by T statistic, with high expression of the DHIT signature to the left. Kolmogorov-Smirnov p values are shown. (D) Correlation between the DHIT score and a linear model score derived using GCB-4 and MYCUp-4 signature averages. Each dot is an EZB case. A F-test p value with two degrees of freedom is shown. (E) Kaplan-Meier plots of survival for DHIT+ and DHIT cases among EZB (left) and non-EZB (right) GCB cases. p Values are calculated using a log rank test. (F) Genetic features that distinguish EZB-MYC+ (DHIT+) from EZB-MYC (DHIT) GCB DLBCL (top two panels), and features shared by EZB-MYC+ and EZB-MYC (bottom panel). Log10 p value (pval) is based on the difference in prevalence between EZB-MYC+ and EZB-MYC cases. ns, not significant. (G) Prevalence of genetic features that distinguish EZB-MYC+ from EZB-MYC in BL. See also Figure S6 and Table S4.
Figure 6.
Figure 6.. Gene Expression Signature Expression in DLBCL Subtypes
Shown is average log2 expression of signature genes in each subtype versus other DLBCL samples in the NCI cohort. Error bars denote SEM. See also Table S5.
Figure 7.
Figure 7.. Functional Genomics Using Models of DLBCL Genetic Subtypes
(A) Contribution of each genetic subtype to the indicated genetic aberrations in the BCR-dependent NF-κB pathway. The color bar associated with each gene illustrates the prevalences of each subtype, as indicated, estimated using the NCI cohort and adjusting for a population-based distribution of COO subgroups (see STAR Methods). (B) Fraction of DLBCL subtype cases with genetic alterations targeting the BCR-dependent NF-κB pathway or negative regulators of proximal BCR signaling. (C) Top: fraction of cases expressing the IgVH4–34 variable region or other IgVH regions. Bottom: fraction of cases expressing the indicated Ig heavy chain (IgH) constant regions. (D) CRISPR-mediated knockout of BCR and NF-κB-negative regulators promotes survival in models of MCD and BN2 DLBCL. Cas9+ cells expressing the indicated sgRNAs with GFP were cocultured with parental (GFP) cells for the indicated times in ibrutinib. Increasing values indicate relative ibrutinib resistance of the sgRNA+ cells. (E) Genome-wide CRISPR loss-of-function screens. The indicated Cas9+ models of MCD, BN2, and EZB were transduced with a genome-wide sgRNA library, and the sgRNA abundance was quantified before and after 3 weeks in culture. Asterisk: targeted by approved or investigational drugs. (F) Effect of BCR knockdown on signaling in a BN2 model. Riva cells were transduced with the indicated small hairpin RNAs (shRNA) and the effect on BCR signaling was assessed by immunoblotting for the indicated proteins. Ctrl, control. (G) Effect of ibrutinib on Riva xenograft growth. Following tumor establishment, mice (n = 5/group) were treated with the indicated ibrutinib doses or vehicle control. See also Figure S7; Tables S6 and S7.
Figure 8.
Figure 8.. Implications of the DLBCL Genetic Subtypes for Pathogenesis and Therapy
(A) Summary of the relationship between DLBCL COO subgroups and the genetic subtypes (left). The genetic themes, phenotypic attributes, clinical correlates, and treatment implications of each subtype are shown at right. Prevalences were estimated using the NCI cohort, adjusting for a population-based distribution of COO subgroups (see STAR Methods). dep., dependent; FDC, follicular dendritic cell; LZ, light zone; IZ, intermediate zone. (B) Models of selection for shared genetic features in DLBCL subtypes. (C) Models accounting for genetic attributes shared by DLBCL genetic subtypes and indolent NHLs. (D) Model of EZB-MYC+ and EZB-MYC evolution.

References

    1. Agarwal R, Chan YC, Tam CS, Hunter T, Vassiliadis D, Teh CE, Thijssen R, Yeh P, Wong SQ, Ftouni S, et al. (2019). Dynamic molecular monitoring reveals that SWI-SNF mutations mediate resistance to ibrutinib plus venetoclax in mantle cell lymphoma. Nat. Med 25, 119–129. - PubMed
    1. Alizadeh AA, Eisen MB, Davis RE, Ma C, Lossos IS, Rosenwald A, Boldrick JC, Sabet H, Tran T, Yu X, et al. (2000). Distinct types of diffuse large B cell lymphoma identified by gene expression profiling. Nature 403, 503–511. - PubMed
    1. Amin NA, Seymour E, Saiya-Cork K, Parkin B, Shedden K, and Malek SN (2016). A quantitative analysis of subclonal and clonal gene mutations before and after therapy in chronic lymphocytic leukemia. Clin. Cancer Res 22, 4525–4535. - PMC - PubMed
    1. Baeuerle PA, and Baltimore D (1988). I kappa B: a specific inhibitor of the NF-kappa B transcription factor. Science 242, 540–546. - PubMed
    1. Bea S, Colomo L, Lopez-Guillermo A, Salaverria I, Puig X, Pinyol M, Rives S, Montserrat E, and Campo E (2004). Clinicopathologic significance and prognostic value of chromosomal imbalances in diffuse large B cell lymphomas. J. Clin. Oncol 22, 3498–3506. - PubMed

Publication types

MeSH terms

Substances