. 2020 Apr 13;37(4):569-583.e5.
doi: 10.1016/j.ccell.2020.03.011.

Integrated Molecular and Clinical Analysis of 1,000 Pediatric Low-Grade Gliomas

Affiliations

Integrated Molecular and Clinical Analysis of 1,000 Pediatric Low-Grade Gliomas

Scott Ryall et al. Cancer Cell. .

Abstract

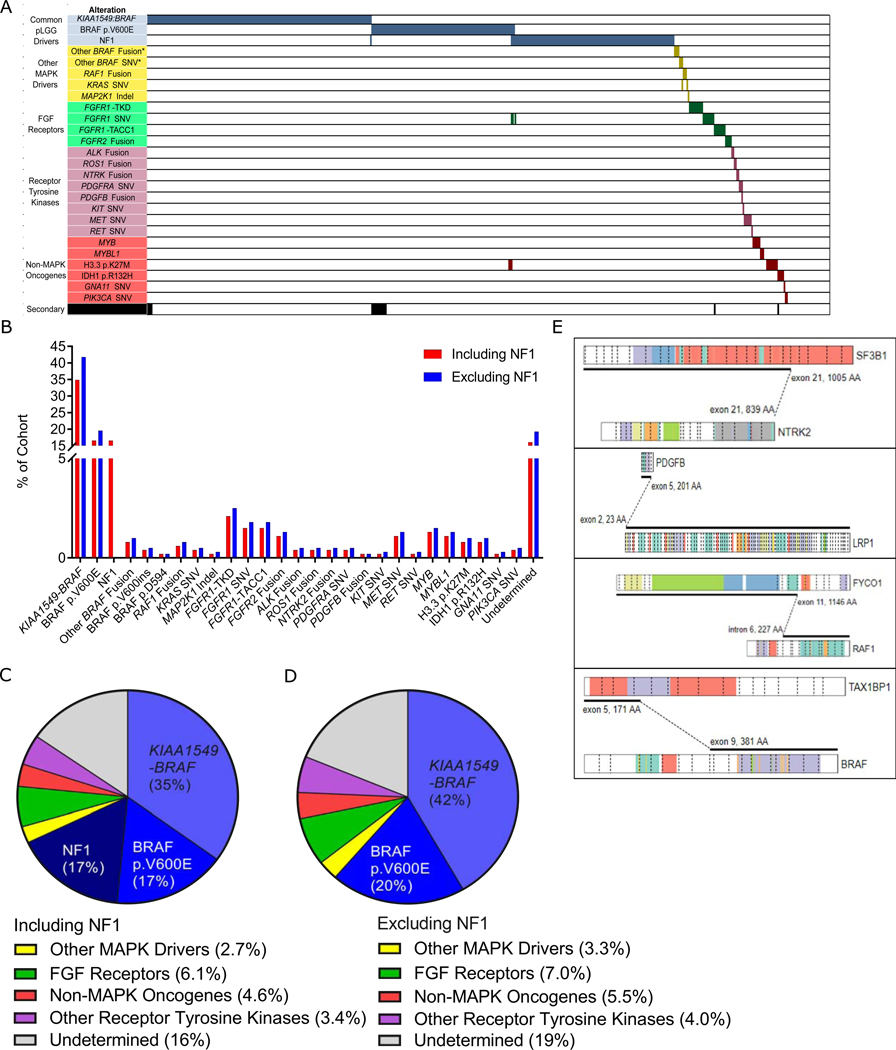
Pediatric low-grade gliomas (pLGG) are frequently driven by genetic alterations in the RAS-mitogen-activated protein kinase (RAS/MAPK) pathway yet show unexplained variability in their clinical outcome. To address this, we characterized a cohort of >1,000 clinically annotated pLGG. Eighty-four percent of cases harbored a driver alteration, while those without an identified alteration also often exhibited upregulation of the RAS/MAPK pathway. pLGG could be broadly classified based on their alteration type. Rearrangement-driven tumors were diagnosed at a younger age, enriched for WHO grade I histology, infrequently progressed, and rarely resulted in death as compared with SNV-driven tumors. Further sub-classification of clinical-molecular correlates stratified pLGG into risk categories. These data highlight the biological and clinical differences between pLGG subtypes and opens avenues for future treatment refinement.

Keywords: RAS/MAPK pathway; brain tumor; low-grade glioma; molecular diagnostics; neurooncology; pediatric; risk stratification.


Conflict of interest statement

Declaration of Interests The authors declare no competing interests.

Figures

Figure 1.
Figure 1.. pLGG Cohort Details
(A) Anatomical location of all pLGG within the cohort (n=976). (B) The histological spectrum of all non-NF1 pLGG (n=843). PA: pilocytic astrocytoma LGG, NOS: low grade glioma, not otherwise specified, GG: ganglioglioma, DNET: dysembryoplastic neuroepithelial tumor, PXA: pleomorphic xanthoastrocytoma, GNT: glioneuronal tumor, DA: diffuse astrocytoma, AG: angiocentric glioma, ODG: oligodendroglioma, DIA/DIG: Desmoplastic infantile astrocytoma/ganglioglioma. (C) Histological distribution of samples based on tumor location of all non-NF1 pLGG (n=843). (D) Boxplot showing age at diagnosis separated by tumor location of the entire pLGG cohort (n=976). The thick line within the box represents the median, the lower and upper limits of the box represent the first and third quartiles and the whiskers the min. and max. values. Adjusted p value for all pairwise comparisons, t-test.*<0.05, **<0.01, ***<0.001, ****<0.0001, NS=not significant. (E) Progression-free survival of the pLGG cohort segregated by tumor location. Adjusted p value, log-rank test. (F) Progression-free and overall survival of the entire pLGG cohort (n=976). p value calculated via the log-rank test. See also Figure S1, Table S1.
Figure 2.
Figure 2.. The Molecular Landscape of pLGG
(A) Oncoprint representation of the molecular alterations and their associated categories in 610 pLGG. Samples are arranged in columns with genes & gene categories labelled along the row. *denotes that these BRAF SNVs and fusions are not the canonical KIAA1549-BRAF or p.V600E. (B) Bar graph of all recurrent somatic mutations across all 477 cases diagnosed from 2000–2017 for which sufficient material for molecular testing was available, in order of frequency and colored based on the inclusion (blue) or exclusion (red) of NF1 patients. (C) Pie chart depicting the frequency of alterations per molecular category in a population-based cohort of pLGG diagnosed from 2000–2017 (n=477). (D) Pie chart depicting the frequency of alterations per molecular category in non-NF1 pLGG diagnosed from 2000–2017 (n=397). (E) Schematic representation of the rare and novel fusions identified in this study. Figures were derived using the Protein Paint feature of the St. Jude PeCan website (https://pecan.stjude.cloud/proteinpaint). See also Figures S2, S3, Table S2.
Figure 3.
Figure 3.. RAS/MAPK Pathway Up-regulation in Non-canonical and Molecularly Undetermined pLGG
(A) Boxplot showing the ppERK/ERK protein levels, separated by molecular alteration. The thick line within the box represents the median, the lower and upper limits of the box represent the first and third quartiles and the whiskers the min. and max. values. Adjusted p value for all pairwise comparisons, t-test.*<0.05, **<0.01, ***<0.001, ****<0.0001, NS=not significant. (B) Pre-ranked gene set enrichment analysis (GSEA) of the RAS/MAPK pathway activation signature in molecularly undetermined pLGG. NES: normalized enrichment score; FDR: false-discovery rate. (C) Single sample gene set enrichment analysis (ssGSEA) of RAS/MAPK activation for normal brain controls and molecularly undetermined pLGG. The thick line within the box represents the median, the lower and upper limits of the box represent the first and third quartiles and the whiskers the min. and max. values. Adjusted p value for all pairwise comparisons, Mann-Whitney test.*<0.05, **<0.01, ***<0.001, ****<0.0001, NS=not significant. (D) RAS/MAPK ssGSEA scores for known RAS/MAPK mutant and molecularly undetermined pLGG compared with normal brain. The thick line within the box represents the median, the lower and upper limits of the box represent the first and third quartiles and the whiskers the min. and max. values. Adjusted p value for all pairwise comparisons, t-test.*<0.05, **<0.01, ***<0.001, ****<0.0001, NS=not significant.
Figure 4.
Figure 4.. Rearrangement versus SNV-driven pLGG
(A) Pie charts depicting the molecular alteration breakdown of rearrangement (top) (n=265) and SNV (bottom)-driven (n=182) pLGG. (B) Rearrangement versus SNV-driven pLGG as compared across several clinical features. * Adjusted p < 0.05, Fisher’s exact test. GTR: gross total resection. (C) Kaplan-Meier plot of overall survival of cases separated by rearrangement- or SNV-driven status, p value calculated via the log-rank test. (D) Kaplan-Meier plot of progression-free survival of cases separated by rearrangement- or SNV-driven status, p value calculated via the log-rank test. See also Table S3.
Figure 5.
Figure 5.. Clinicopathologic Features of Rearrangement-driven pLGG
Schematic representation of key clinical features and outcomes for (A) KIAA1549-BRAF. (B) FGFR1-TACC1, (C) FGFR1 TKD, (D) FGFR2 Fusions, (E) MYB, and (F) MYBL1. PA: pilocytic astrocytoma LGG, NOS: low grade glioma, not otherwise specified, GG: ganglioglioma, DNET: dysembryoplastic neuroepithelial tumor, PXA: pleomorphic xanthoastrocytoma, GNT: glioneuronal tumor, DA: diffuse astrocytoma, AG: angiocentric glioma, ODG: oligodendroglioma, DIA/DIG: Desmoplastic infantile astrocytoma/ganglioglioma, Dx: diagnosis, GTR: gross total resection. See also Figure S4, S5, Table S4.
Figure 6.
Figure 6.. Clinicopathologic Features of SNV-Driven pLGG
Schematic representation of key clinical features and outcomes for (A) BRAF p.V600E, (B) FGFR1 SNVs, (C) IDH1 p.R132H, and (D) H3.3 p.K27M. PA: pilocytic astrocytoma LGG, NOS: low grade glioma, not otherwise specified, GG: ganglioglioma, DNET: dysembryoplastic neuroepithelial tumor, PXA: pleomorphic xanthoastrocytoma, GNT: glioneuronal tumor, DA: diffuse astrocytoma, AG: angiocentric glioma, ODG: oligodendroglioma, DIA/DIG: Desmoplastic infantile astrocytoma/ganglioglioma, Dx: diagnosis, GTR: gross total resection. See also Figure S6, S7.
Figure 7.
Figure 7.. Risk Stratification of pLGG
(A) Donut plot representing assigned risk portfolio of pLGG and their associated biomarkers. Risk assignment is based on the incidence of progression and/or death. In samples harboring multiple alterations, the highest potential risk group was assigned. Alterations appearing in <5 samples are not assigned a risk group. (B) Kaplan-Meier plot of overall survival of cases separated by risk, p value calculated via the log-rank test. (C) Kaplan-Meier plot of progression-free of cases separated by risk, p value calculated via the log-rank test. See also Figure S8 Table S5.

Comment in

References

    1. Aghajan Y, Levy ML, Malicki DM & Crawford JR. (2016) Novel PPP1CB-ALK fusion protein in a high-grade glioma of infancy. BMJ Case Rep. 16;2016. - PMC - PubMed
    1. Anders S, Pyl PT, & Huber W. (2015) HTSeq-A Python framework to work with high-throughput sequencing data. Bioinformatics. 31(2): 166–9. - PMC - PubMed
    1. Balss J1, Meyer J, Mueller W, Korshunov A, Hartmann C, von Deimling A. (2008). Analysis of the IDH1 codon 132 mutation in brain tumors. Acta Neuropathol. 116(6): 597–602. - PubMed
    1. Bandopadhayay P, Ramkissoon LA, Jain P, Bergthold G, Wala J, Zeid R, Schumacher SE, Urbanski L, O’Rourke R, Gibson WJ, et al. (2016). MYB-QKI rearrangements in angiocentric glioma drive tumorigenicity through a tripartite mechanism. Nat Genet. 48(3):273–82. - PMC - PubMed
    1. Banerjee A, Jakacki RI, Onar-Thomas A, Wu S, Nicolai des T, Young Poussaint T, Fangusaro J, Phillips J, Perry A, Turner D, et al. (2017). A phase I trial of the MEK inhibitor selumetinib (AZD6244) in pediatric patients with recurrent or refractory low-grade glioma: a Pediatric Brain Tumor Consortium (PBTC) study. Neuro Oncol. 19(8): 1135–1144. - PMC - PubMed

Publication types

MeSH terms