. 2020 Jul 15:215:116833.
doi: 10.1016/j.neuroimage.2020.116833. Epub 2020 Apr 11.

Modeling regional changes in dynamic stability during sleep and wakefulness

Affiliations

Modeling regional changes in dynamic stability during sleep and wakefulness

Ignacio Perez Ipiña et al. Neuroimage. .

Abstract

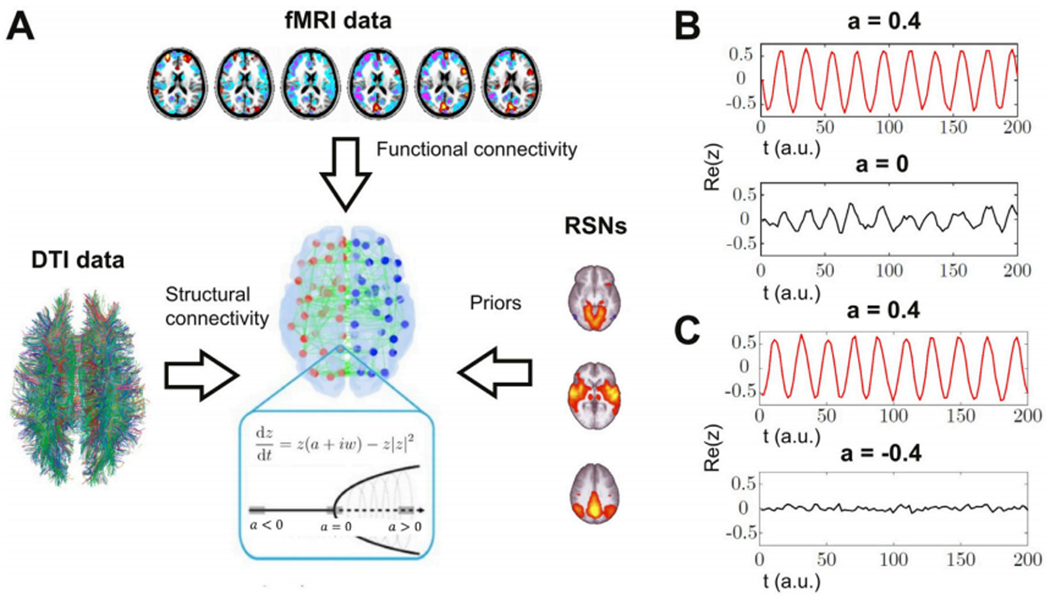
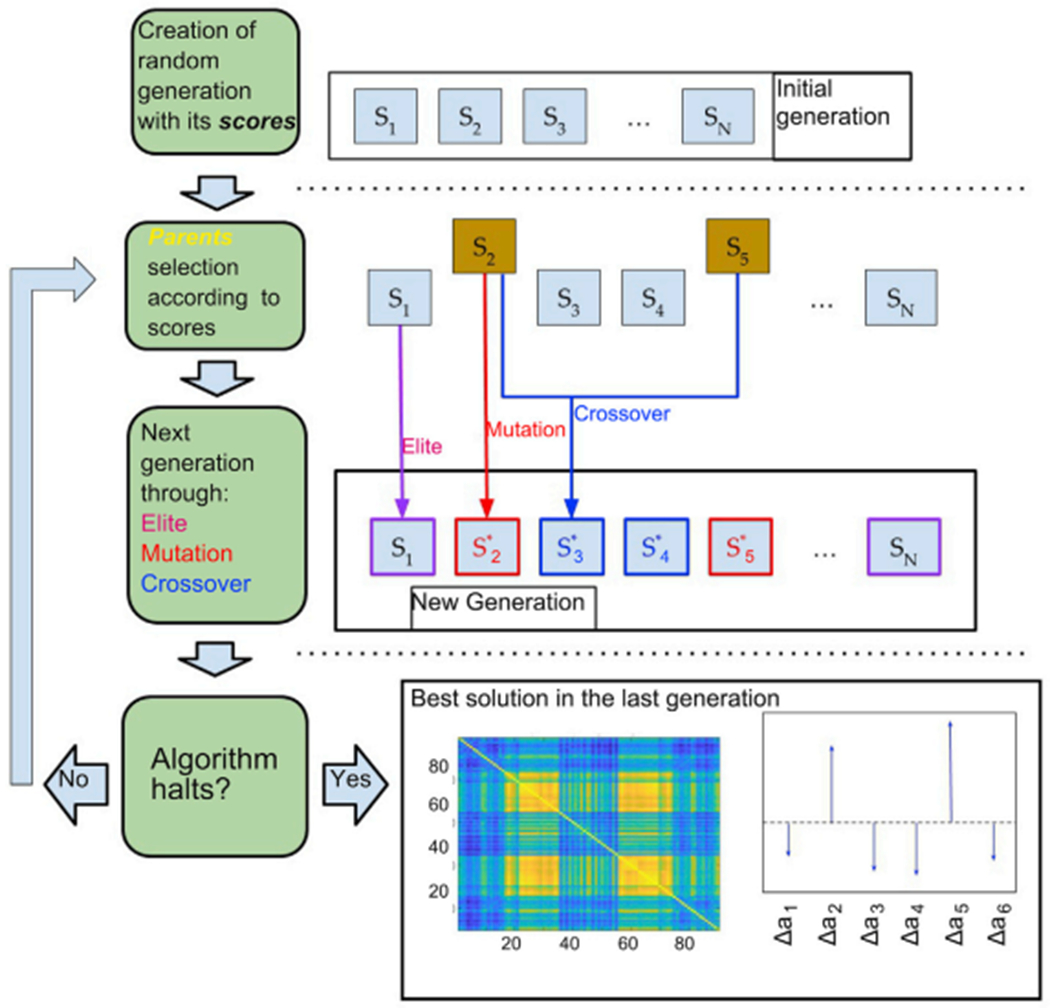
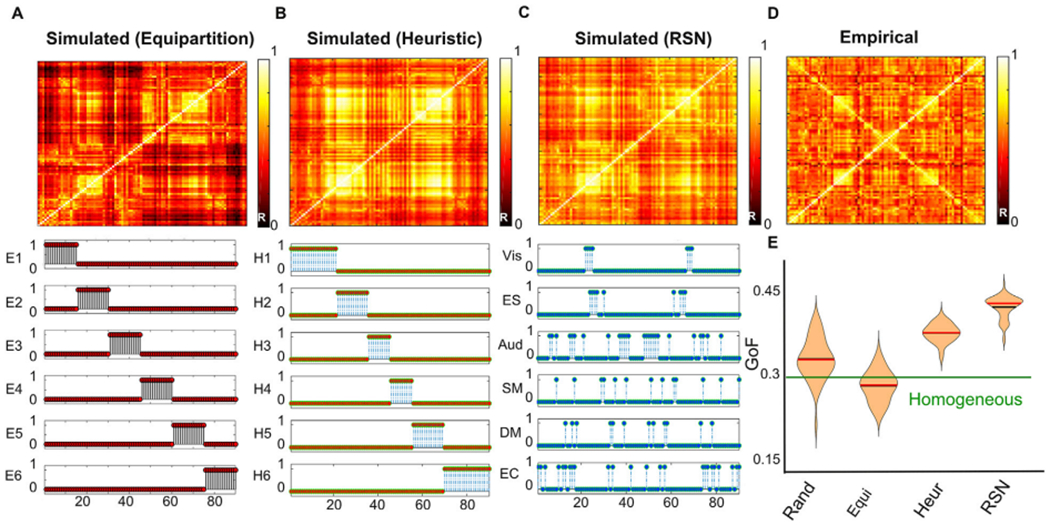
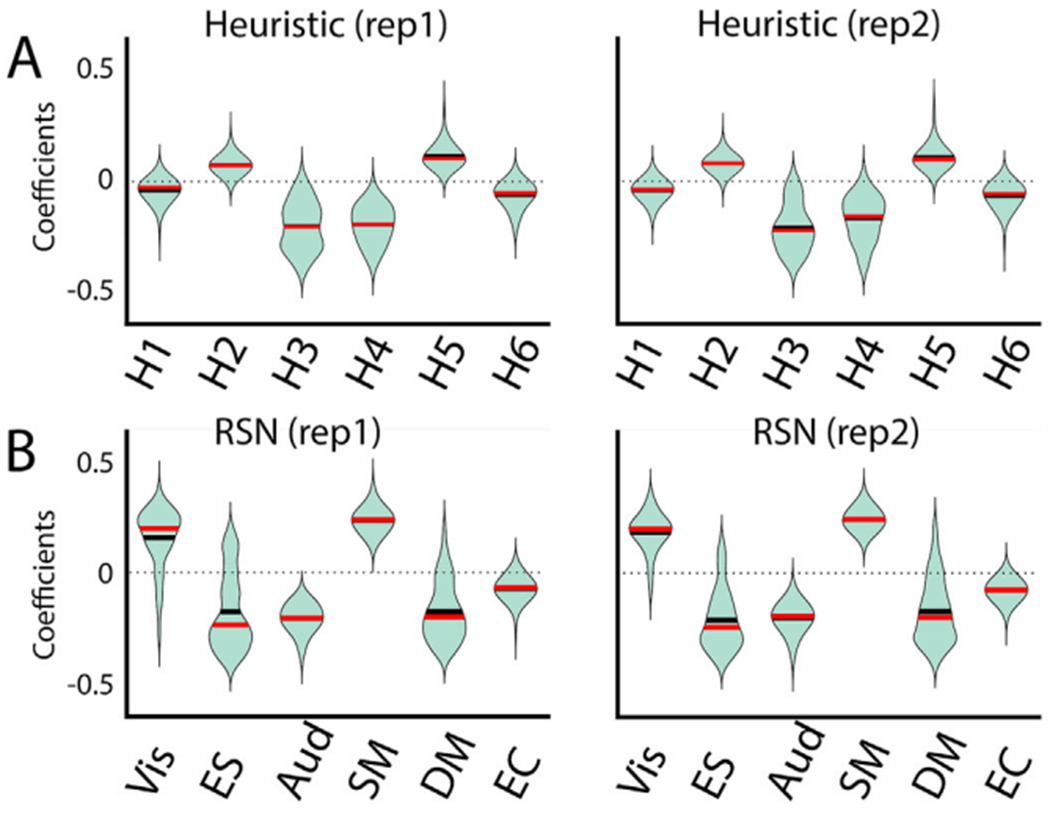
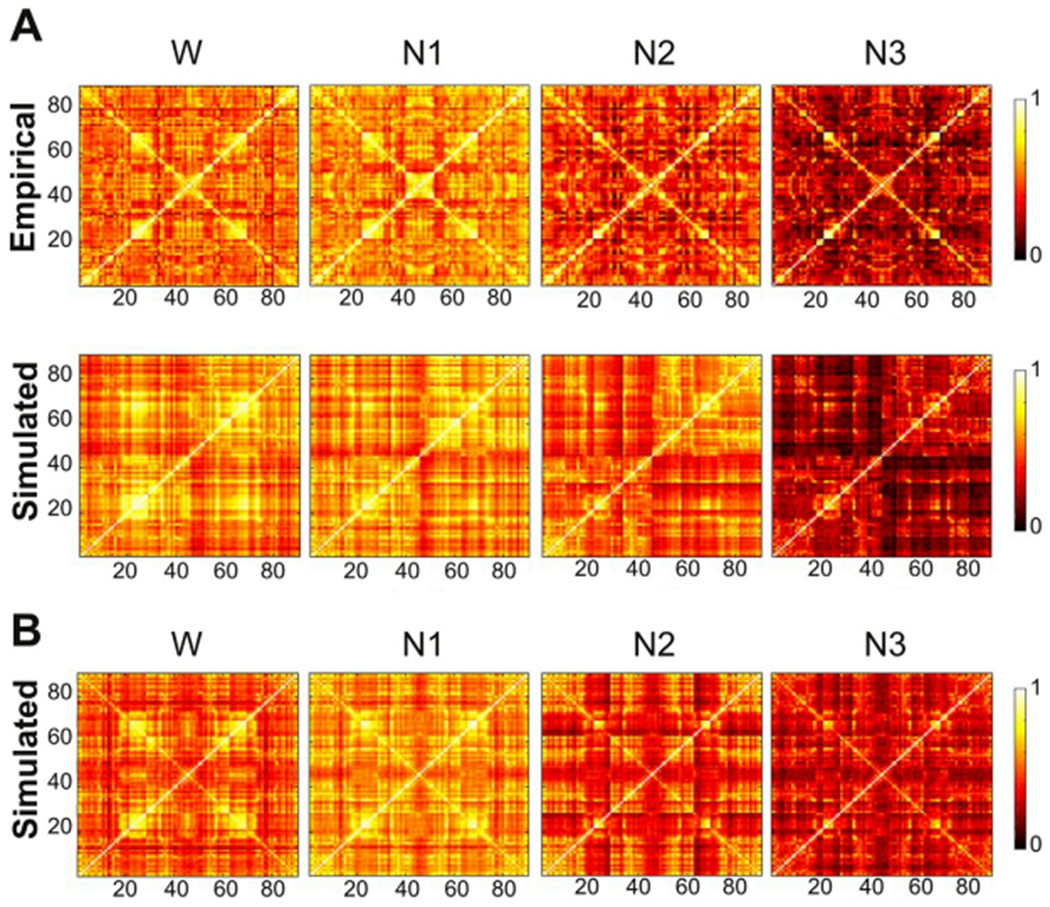
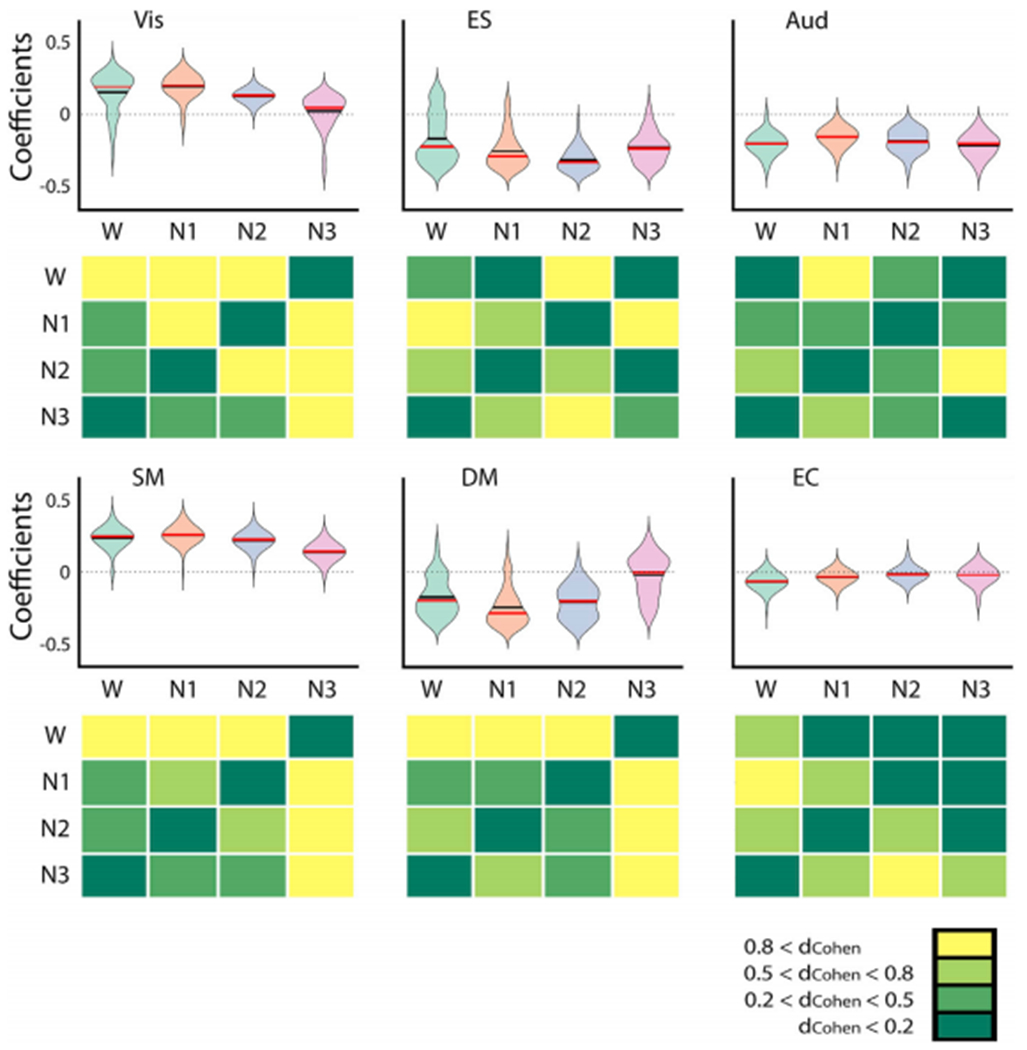
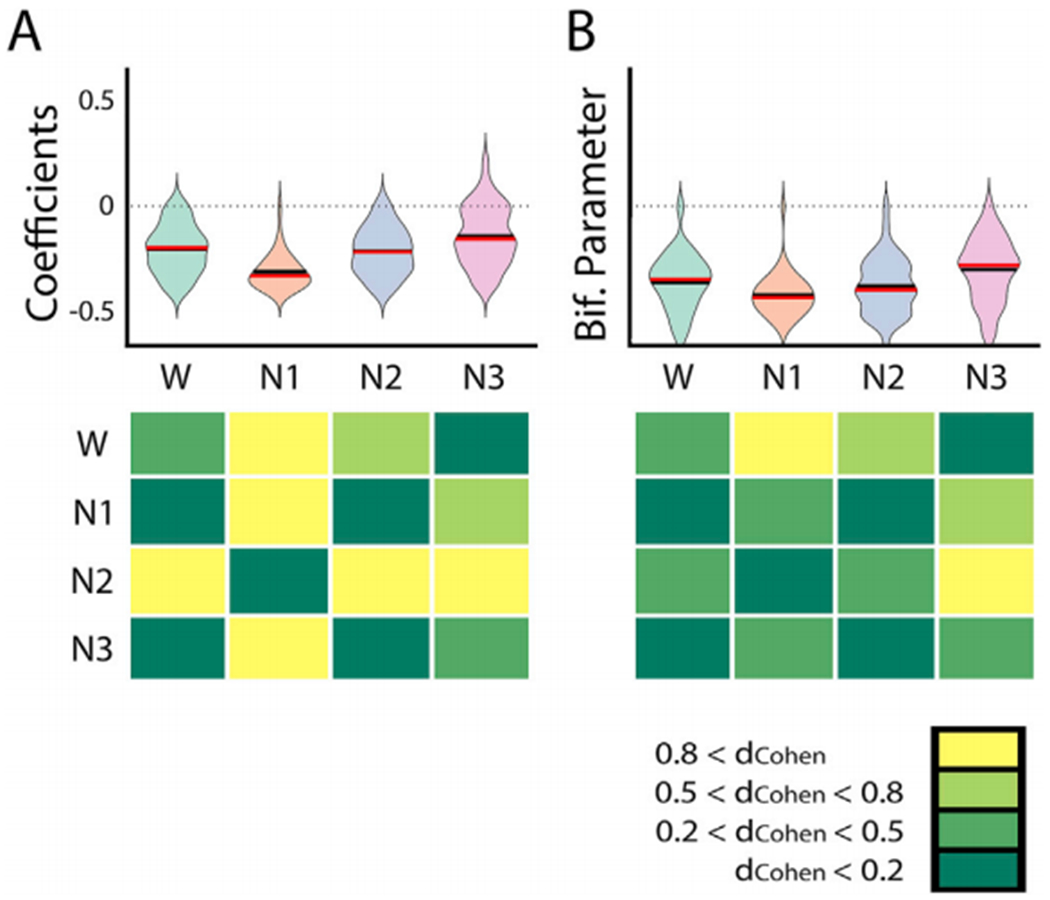
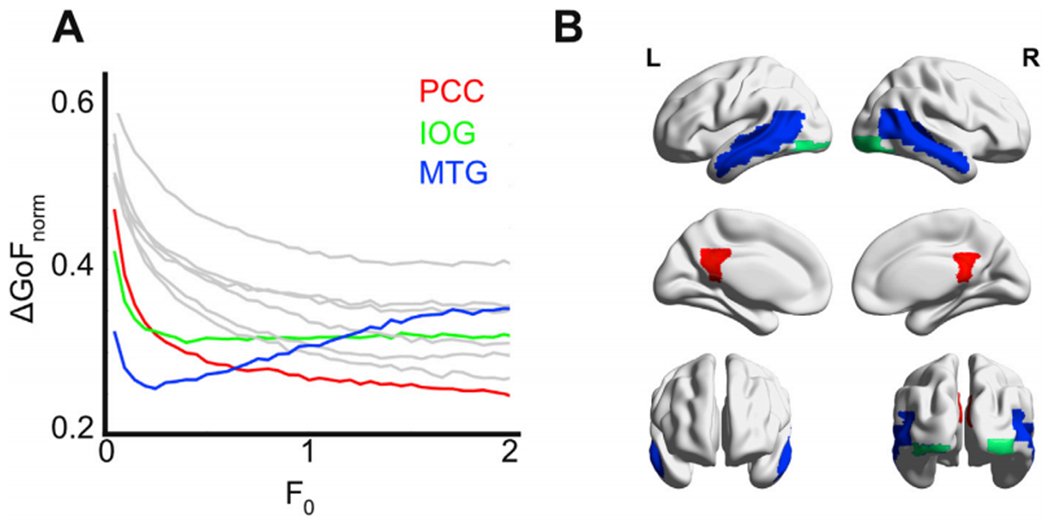
Global brain states are frequently placed within a unidimensional continuum by correlational studies, ranging from states of deep unconsciousness to ordinary wakefulness. An alternative is their multidimensional and mechanistic characterization in terms of different cognitive capacities, using computational models to reproduce the underlying neural dynamics. We explore this alternative by introducing a semi-empirical model linking regional activation and long-range functional connectivity in the different brain states visited during the natural wake-sleep cycle. Our model combines functional magnetic resonance imaging (fMRI) data, in vivo estimates of structural connectivity, and anatomically-informed priors to constrain the independent variation of regional activation. The best fit to empirical data was achieved using priors based on functionally coherent networks, with the resulting model parameters dividing the cortex into regions presenting opposite dynamical behavior. Frontoparietal regions approached a bifurcation from dynamics at a fixed point governed by noise, while sensorimotor regions approached a bifurcation from oscillatory dynamics. In agreement with human electrophysiological experiments, sleep onset induced subcortical deactivation with low correlation, which was subsequently reversed for deeper stages. Finally, we introduced periodic forcing of variable intensity to simulate external perturbations, and identified the key regions relevant for the recovery of wakefulness from deep sleep. Our model represents sleep as a state with diminished perceptual gating and the latent capacity for global accessibility that is required for rapid arousals. To the extent that the qualitative characterization of local dynamics is exhausted by the dichotomy between unstable and stable behavior, our work highlights how expanding the model parameter space can describe states of consciousness in terms of multiple dimensions with interpretations given by the choice of anatomically-informed priors.


Figures

Fig. 1.
Fig. 1.
Procedure followed to construct the whole-brain model and a simplified example of the dynamics of two coupled oscillators. A) The model incorporates DTI data to define the SC between the non-linear oscillators, fMRI data to determine the intrinsic oscillation frequency of each node and the empirical FC that is fitted in the simulations, and RSNs as an anatomical prior to define the groups of nodes that contribute independently to the local bifurcation parameters. Dynamics are given by the normal form of a supercritical Hopf bifurcation (the equations and bifurcation diagram are provided in the inset). B-C) Example of two coupled oscillators with different bifurcation parameters. Panel B shows how oscillatory dynamics (a > 0) can induce oscillations in a critical node (a = 0) due to their coupling, while panel C shows that noisy dynamics at the fixed point (a < 0) prevents the synchronization with the oscillating node (a > 0). Re(z) stands for the real part of the simulated time series, which corresponds to the modeled fMRI signal.
Fig. 2.
Fig. 2.
Schematic of the genetic algorithm implemented to optimize the group coefficients. A population of 10 individuals (i.e. sets of parameters) with their corresponding scores (TFF of the empirical vs. simulated FC) is first generated, followed by a selection of parents based on their scores. A new generation of individuals is then generated by elite selection, crossover from the parents and mutation. This step is iteratively applied until at least one of the halting criteria is met. When finished, the algorithm outputs the optimal coefficients together with the TFF and the simulated FC.
Fig. 3.
Fig. 3.
FC matrices obtained from the whole-brain model fitted to empirical FC using the equipartition prior (panel A), heuristic prior (panel B) and the RSN prior (panel C) present GoF value respectively GoFW,E = 0.29, GoFW,H = 0.38 and GoFW,RSN = 0.43 comparing with the empirical FC matrix (panel D). The bottom part of all panels shows the indicator function 1Gj (i) of Eq. (3), signaling the group membership of node i. The empirical FC matrix is displayed in panel D. As shown in panel E, the best TFF is obtained using the RSN prior, followed by the heuristic prior. Black and red horizontal lines indicate the mean and the median of the distribution. The horizontal green line stands for the best GoF obtained with the exhaustive homogeneous exploration.
Fig. 4.
Fig. 4.
Coefficient distributions for 100 independent runs of the optimization procedures, for each group of nodes yielding the optimal GoF between simulated and empirical FC for the heuristic prior (panel A) and the RSN prior (panel B). Two sets (left and right) of 100 runs of optimization algorithm and are shown to highlight the convergence of the model parameters along repetitions (see Fig S5 to more repetitions). Black and red horizontal lines indicate the mean and the median of the distribution.
Fig. 5.
Fig. 5.
Comparison of empirical and simulated FC matrices for wakefulness and all sleep stages. A) Empirical and simulated FC, optimal fit using the RSN prior without changes to the SC. The obtained GoF between the empirical and simulated FC for each state are: GoFW = 0.43, GoFN1 = 0.41, GoFN2 = 0.38and GoFN3 = 0.33 B) Simulated FC matrices for wakefulness and all sleep stages with an ad-hoc increment in the homotopic SC. The values of GoF obtained are: GoFW = 0.50, GoFN1 = 0.48, GoFN2 = 0.45and GoFN3 = 0.42.
Fig. 6.
Fig. 6.
The coefficient distributions corresponding to the six RSNs, estimated from the optimal fit to the empirical FC data recorded during wakefulness (W), N1, N2 and N3 sleep. The bottom panels on each row show Cohen’s d (dCohen) for all pairwise comparisons. Primary visual (Vis) and sensorimotor (SM) nodes contributed towards oscillatory dynamics during wakefulness, but this contribution progressively approached zero as the subjects transitioned towards N3 sleep. The opposite result was observed for default mode (DM) nodes. In Fig S8, the coefficient distributions corresponding to the six RSNs were obtained for 100 runs of the optimization procedure with 20 individuals per generations.
Fig. 7.
Fig. 7.
Changes in regional bifurcation parameters during sleep relative to wakefulness. Rendering of the regions associated with very large effect sizes (dCohen> 0.8) in the comparison of the bifurcation parameters corresponding to sleep (N1, N2, and N3) vs. wakefulness. Red and blue regions indicate dCohen> 0.8 for wakefulness < sleep and wakefulness > sleep, respectively. This implies that sleep transitions the dynamics towards a≈0, i.e. dynamics become more susceptible to external perturbations.
Fig. 8.
Fig. 8.
Changes in the coefficients (panel A) and bifurcation parameters (panel B) of subcortical nodes from wakefulness to deep sleep. The bottom panels show Cohen’s d (dCohen) for all pairwise comparisons.
Fig. 9.
Fig. 9.
In silico stimulation of the model fitted to deep sleep using an additive oscillatory forcing term. A) ΔGoFnorm against the forcing amplitude F0 for the 10 pairs of nodes leading to the lowest ΔGoFnorm values. B) Rendering of the three regions presenting the lowest ΔGoFnorm. The color code indicates three different qualitative behaviors as F0 is increased: ΔGoFnorm decreases as a function of F0 (posterior cingulate cortex [PCC], shown in red), ΔGoFnorm achieves an optimal value and then increases as a function of F0 (middle temporal gyrus [MTG], shown in blue), and ΔGoFnorm remains approximately constant as a function of F0 (inferior occipital gyrus [IOG], shown in green).

References

    1. Donnelly-Kehoe P, Saenger VM, Lisofsky N, Kühn S, Kringelbach ML, Schwarzbach J, et al., 2019. Reliable local dynamics in the brain across sessions are revealed by whole-brain modeling of resting state activity. Hum. Brain Mapp 10.1002/hbm.24572. - DOI - PMC - PubMed
    1. Achard S, Salvador R, Whitcher B, Suckling J, Bullmore ED, 2006. Aresilient, low-frequency, small-world human brain functional network with highly connected association cortical hubs. J. Neurosci 26 (1), 63–72. - PMC - PubMed
    1. Ali MM, Sellers KK, Fröhlich F, 2013. Transcranial alternating current stimulation modulates large-scale cortical network activity by network resonance. J. Neurosci 33 (27), 11262–11275. - PMC - PubMed
    1. Allen PJ, Polizzi G, Krakow K, Fish DR, Lemieux L, 1998. Identification of EEG events in the MR scanner: the problem of pulse artifact and a method for its subtraction. Neuroimage 8 (3), 229–239. - PubMed
    1. Baker AP, Brookes MJ, Rezek IA, Smith SM, Behrens T, Smith PJP, Woolrich M, 2014. Fast transient networks in spontaneous human brain activity. Elife 3, e01867. - PMC - PubMed