. 2020 Apr 24;23(4):101019.
doi: 10.1016/j.isci.2020.101019. Epub 2020 Apr 2.

Transcriptional Profiling of the Adult Hair Follicle Mesenchyme Reveals R-spondin as a Novel Regulator of Dermal Progenitor Function

Affiliations

Transcriptional Profiling of the Adult Hair Follicle Mesenchyme Reveals R-spondin as a Novel Regulator of Dermal Progenitor Function

Andrew Hagner et al. iScience. .

Abstract

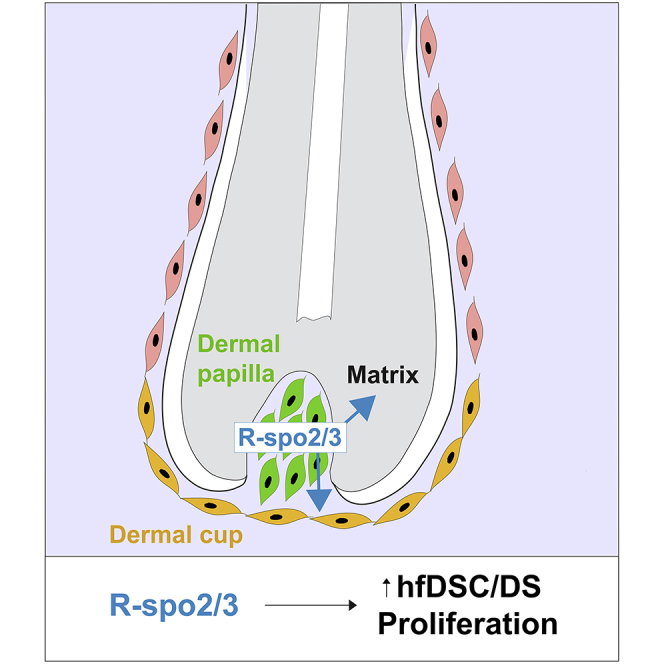
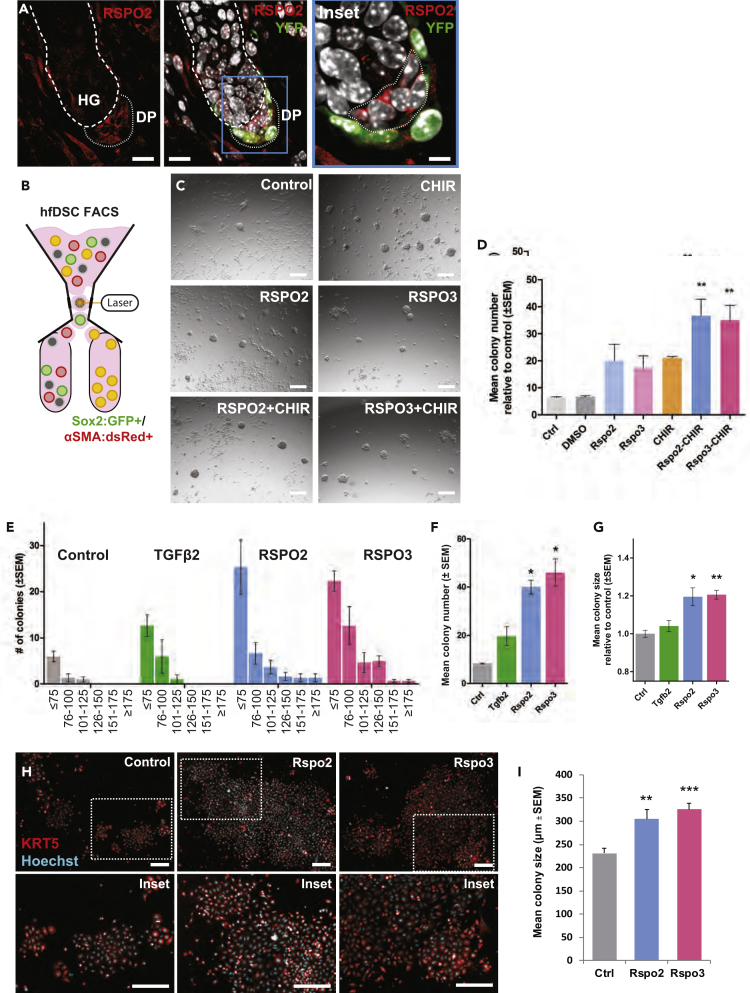
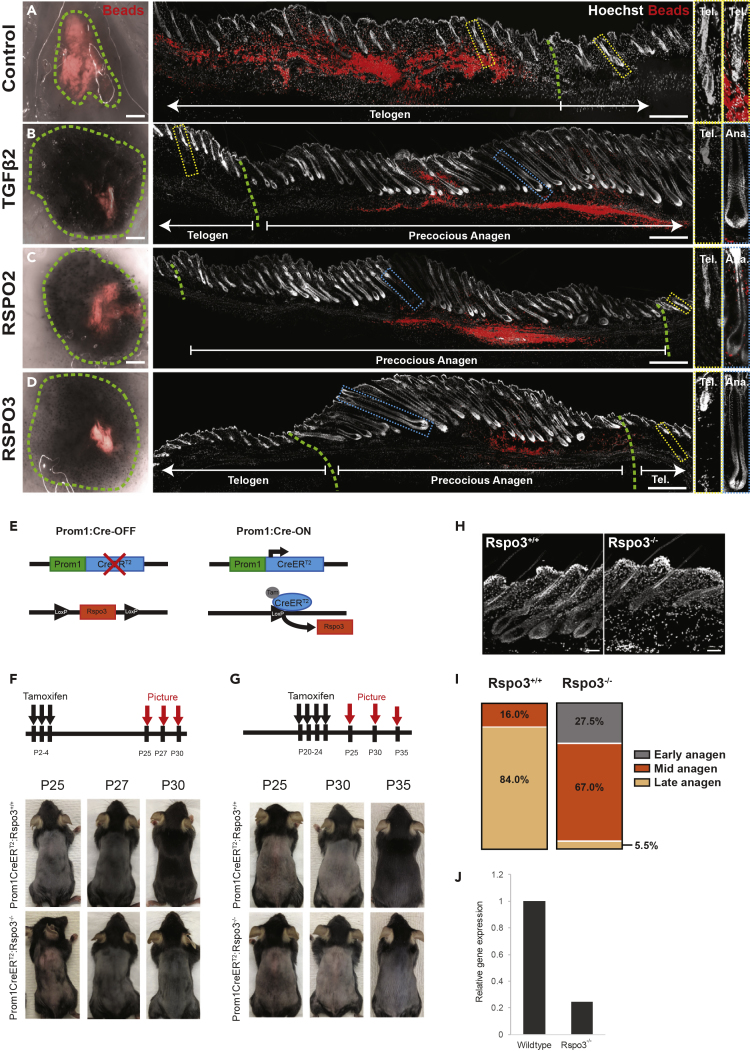
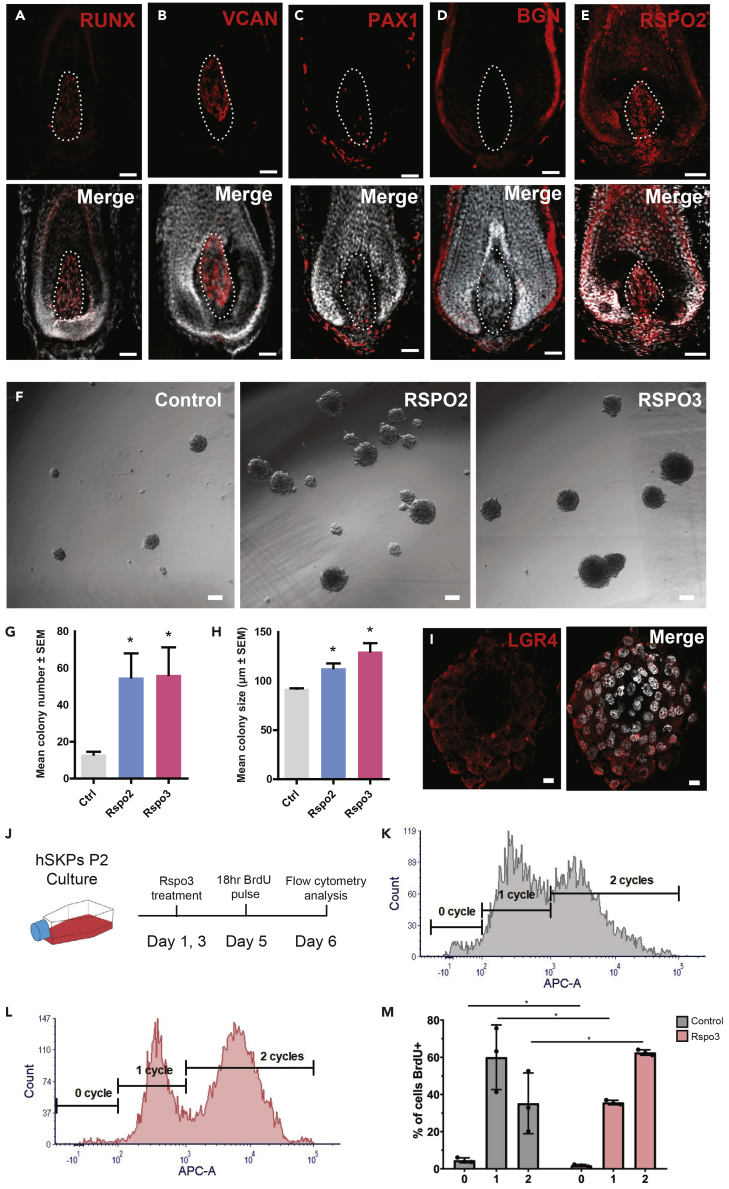
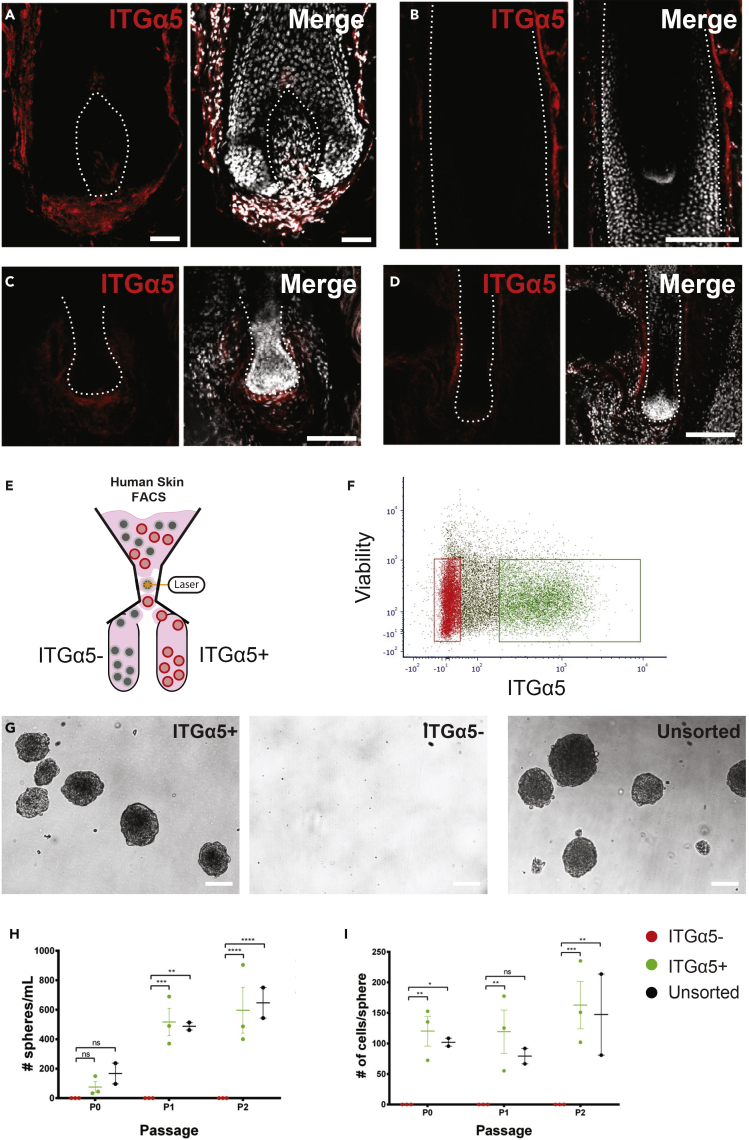
The adult hair follicle (HF) undergoes successive regeneration driven by resident epithelial stem cells and neighboring mesenchyme. Recent work described the existence of HF dermal stem cells (hfDSCs), but the genetic regulation of hfDSCs and their daughter cell lineages in HF regeneration remains unknown. Here we prospectively isolate functionally distinct mesenchymal compartment in the HF (dermal cup [DC; includes hfDSCs] and dermal papilla) and define the transcriptional programs involved in hfDSC function and acquisition of divergent mesenchymal fates. From this, we demonstrate cross-compartment mesenchymal signaling within the HF niche, whereby DP-derived R-spondins act to stimulate proliferation of both hfDSCs and epithelial progenitors during HF regeneration. Our findings describe unique transcriptional programs that underlie the functional heterogeneity among specialized fibroblasts within the adult HF and identify a novel regulator of mesenchymal progenitor function during tissue regeneration.

Keywords: Biological Sciences; Developmental Biology; Stem Cells Research.


Conflict of interest statement

Declaration of Interests The authors declare no competing interests.

Figures

None
Graphical abstract
Figure 1
Figure 1
Prospective Isolation and Transcriptomic Analysis of hfDSCs and Their Progeny within the Regenerating Adult Hair Follicle (A) Schematic of adult anagen hair follicle. Functionally distinct mesenchymal compartments are indicated by an identifiable name and color. (B) Images of early anagen hair follicle bulbs on adult αSMAdsRed:Sox2GFP double knockin mice stained with Hoechst (gray). Sox2GFP is expressed in the DP (green; upper arrow), whereas the DC (yellow; lower arrow) is both αSMAdsRed and Sox2GFP positive. Scale bar, 100 μm. (C and D) Images showing immunostaining for (C) Itgα8 (red) and (D) Itgα9 (red) labeling the dermal sheath and dermal papilla, respectively. Hoechst identifies cell nuclei (gray). Scale bar, 50 μm. (E–G) FACS isolation and gating strategy used to isolate (E) DC, (F) DP. and (G) IFD. Representative contour plots indicate each specific mesenchymal compartment within the hfDSC lineage.
Figure 2
Figure 2
RNA-Seq Analysis Reveals a Distinct Molecular Signature for Each Hair Follicle Mesenchymal Compartment (A) Principal component analysis (PCA) of global gene expression profiles of DC, DP, and IFD comparing PC1 and PC2. Component percent contribution to variance is noted in each axis title. (B) Modified Euler diagram depicting numbers of differentially expressed genes in each cell population comparison with ≥2-fold differential gene expression. (C) Heatmap representation of identified signature genes (log2 FPKM) for DP, DC, and IFD during early anagen. Each row represents expression for a single gene, and columns indicate biological replicates grouped by population. DP, dermal papilla; DC, dermal cup; IFD, interfollicular dermis. (D) Compound graphs depicting the top 50 most significant differentially expressed genes ranked by fold change. Bars show mean log2-fold change between indicated cell populations compared with the other populations (±SEM, q ≤ 0.05). The hair follicle mesenchyme (HF-M) population is the mixed gene expression of DC and DP compared with the IFD. (E) Gene ontology analysis of biological and molecular processes for signature genes in DP, DC, IFD, and HF-M.
Figure 3
Figure 3
Validation of Candidate Genes in Mouse Skin Reveals Compartment-Specific Markers within the Hair Follicle Mesenchyme (A) Spearman correlation of log2-fold change values from RNA-seq and subsequent qPCR (r = 0.78, P < 0.0001, Spearman correlation coefficient). (B and C) TaqMan RT-qPCR results for candidate gene expression for each HF mesenchymal compartment relative to the endogenous control gene hprt. Each gene was tested in technical and biological triplicate (only biological replicates shown), using samples collected independently of those used for RNA-seq. Genes are grouped by mesenchymal compartment; (B) DC and (C) DP. Data are mean ± SD. (D) Log2 normalized counts of Lgr4, Lgr5, Lgr6, and Rspo3 in DP, DC, and IFD. Levels of Lgr4, Lgr5, and Lgr6 are detected in the DC. Data are mean log2 normalized counts ± SD, n = 3 biological replicates. (E–I) Immunohistochemistry of candidate genes in early anagen (~P26) mouse back skin. Images show hair follicle bulbs with DS and DP outlined. Hoechst nuclear staining in gray and immunostaining in red. (E) Versican (Vcan), (F) Runt-related transcription factor 1-3 (Runx), (G) R-spondin2 (Rspo2), (H) Integrin alpha 5 (Itgα5), and (I) CD200. (H, I) Arrowheads indicate staining of DS and DC. Scale bars, 50 μm. (J and K) RNAScope of candidate genes in early anagen (P26) mouse back skin. Images show hair follicle bulbs with DS and DP outlined. Hoechst nuclear staining in gray and mRNA in red. (J) Rspo3 mRNA; (K) Spock3 mRNA. Scale bars, 50 μm. (L–N) RNAScope of candidate genes in early anagen (P26) αSMACreERT2:RosaeYFPmouse back skin treated with tamoxifen at p3/4. The details of this mouse can be found in Transparent Methods. Images show hair follicle bulbs with DS and DP outlined. Hoechst nuclear staining in blue, mRNA in red, and YFP in green. (L) Adamts18 mRNA; (M) Lgr6 mRNA; (N) Lgr4 mRNA. (L and M) Arrowhead indicates respective mRNA-positive cells in the DC. Scale bars, 50 μm. (O and P) RNAScope of (O) positive control (Ubiquitin C) and (P) negative control (DapB) gene from Bacillus subtilis strain SMY in early anagen (P26) mouse back skin. Images show anagen hair follicle bulbs with the hair follicle outlined in white. Hoechst nuclear staining is in blue and mRNA is in red. Scale bars, 25 μm.
Figure 4
Figure 4
R-spondins-2 and -3 Stimulate Proliferation of Prospectively Isolated hfDSCs and Hair Follicle Keratinocytes (A) Early anagen follicle from α-SMACreERT2:RosaeYFP skin showing Rspo2 (red) in DP cells, surrounded by hfDSCs (green). High magnification inset (blue box) shown at right. HG, hair germ. Scale bar, 10 μm. (B) Schematic showing FACS isolation of hfDSCs (αSMAdsRed+ve Sox2GFP+ve) from anagen (P26) skin. (C) Phase contrast images of isolated hfDSCs grown for 10 days in the absence or presence of recombinant mouse Rspo2 or 3 protein and/or the GSK-inhibitor CHIR99021 (D). Scale bar, 50 μm. (D) Quantification of hfDSC colony numbers. Experiments included no treatment and DMSO only controls. Mean ± SEM (n = 3 biological replicates, ∗∗ indicates P ≤ 0.01). (E) Distribution of colony sizes following exposure to DMSO, TGFβ2, RSPO2, or RSPO3. Data are mean ± SEM. (F and G) Quantification of colony (F) number and (G) size of FACS-isolated hfDSCs grown in equivalent conditions, with the addition of TGFβ2, RSPO2, or RSPO3 treatment. Data are mean ± SEM (n = 3 biological replicates; ∗, p ≤ 0.05, ∗∗p ≤ 0.01). (H) Adult (p26) epithelial keratinocytes grown for 10 days in the absence or presence of recombinant mouse RSPO2 or RSPO3 protein and immunostained with Keratin-5. Scale bar, 50 μm. (I) Quantification of mean keratinocyte colony size from (H) (mean ± SEM, n = 3 biological replicates, ∗∗, ∗∗∗ indicate p ≤ 0.01, 0.001, respectively).
Figure 5
Figure 5
Exogenous R-spondin 2/3 Is Sufficient to Stimulate Hair Follicle Regeneration In vivo and Deficiency in DP-Derived R-spondin 3 Delays Progression of Anagen (A–D) Images of skin following intradermal injection of (A) BSA, (B) TGFβ2, (C) RSPO2, and (D) RSPO3 into resting phase (telogen) adult mouse back skin. At left are ventral views of skin at each injection site. Red indicates fluorescent beads used to identify injection site. In the main panel, nuclei are stained with Hoechst (gray). Green dashed lines outline the injection site. Dashed boxes (yellow, telogen; blue, anagen) indicate high magnification insets of individual follicles shown at right. (E) Schematic depicting Prominin-1CreERT2:Rspo3flox mice used to specifically delete Rspo3 from the dermal papilla. (F and G) Mice were treated with tamoxifen (4-OHT) at either P3-4 (F; n = 3 of each genotype) or at P20-24 (G; n = 4 of each genotype) to induce recombination. Representative images show hair regrowth in either Rspo3+/+ (top) or Rspo3flox/flox mice (bottom). (H) Cross section of P30 Rspo-3+/+ (top) and Rspo3flox/flox(bottom) mouse skin stained with nuclei labeled with Hoechst (gray). Mice were treated with 4-OHT at P2-4, 20, 21. (I) Quantification of the percentage of HF in early, mid-, or late anagen for Rspo3+/+ (left; n = 4) and Rspo3flox/flox (right; n = 2) mice back skin. Chi-squared distribution analysis was used to compare the difference between HF stage distribution of Rspo3+/+ and Rspo3flox/flox mice (χ2 = 1187, DF = 2, p < 0.0001, two-tailed). (J) qPCR was performed on mid-anagen (P30) DP cells FACS-isolated by staining for CD133/Prom-1. Rspo3 gene expression data are relative to an Hprt endogenous control gene. Data are from one experiment with n = 3 independent replicates pooled within each wild-type and Rspo3flox/flox groups.
Figure 6
Figure 6
Conservation of Identified Compartment-Specific Markers in Human Scalp Hair Follicle and Sensitivity to R-spondin Signaling (A–E) Adult human scalp terminal hair follicle bulbs immunostained with antibodies against (A) Runx, (B) Vcan, (C) Pax1, (D) Bgn, and (E) Rspo2 (all in red). Nuclei were stained with Hoechst (gray). Scale bars, 50 μm. (F) Secondary passage human dermal progenitor colonies grown for 14 days in the absence or presence of R-spondin2 or -3. Scale bar, 50 μm. (G and H) Quantification of mean colony (G) number and (H) size. Mean ± SEM, n = 3 independent human samples. (I) Adult human colony-forming dermal progenitors were cultured from scalp skin and immunostained for the R-spondin receptor, Lgr4 (red). Nuclei were stained with Hoechst (gray). Scale bar, 10 μm. (J) Experimental outline of the BrdU pulse-chase experiment. Cells were pulsed with BrdU for 18 h before flow cytometry analysis. (K and L) Representative flow cytometry readings of BrdU-APC-positive cells from (K) control and (L) RSPO3 treatments. The number of replication cycles were gated using positive and negative controls. (M) Quantification of the percentage of cells in each cycle categorization determined from K and L. n = 3 independent culture samples for each group. Data are mean ± SD.
Figure 7
Figure 7
Itgα5+ Dermal Cells from Human Scalp Are Enriched for Human Dermal Progenitors (A–D) Adult human scalp hair follicle immunostained for Itgα5 (red) and Hoechst (gray). (A) Representative image zoomed into the hair follicle bulb. Scale bar, 50 μm. (B) Representative image zoomed into the upper sheath and (C, D) low-magnification images showing the follicle and the interfollicular dermis. Scale bars, 100 μm. (E) Experimental diagram of FACS for Itgα5- and Itgα5+ cells from human skin. (F) FACS isolation of Itgα5- (red) and Itgα5+ (green) cells from dissociated human scalp tissue. (G) Representative images of Itgα5+, Itgα5NEG, or unsorted dermal cells cultured for 7 days in proliferation media (one passage). (H and I) Quantification of the (H) number of spheres/mL and number of cells/sphere (I) from each population over multiple passages. (Data are mean ± SD; ∗p < 0.05, ∗∗p < 0.01, ∗∗∗p < 0.001, ∗∗∗∗p < 0.0001, ANOVA Tukey).

References

    1. Abo A., Clevers H. Modulating WNT receptor turnover for tissue repair. Nat. Biotechnol. 2012;30:835–836. - PubMed
    1. Barker N., Huch M., Kujala P., van de Wetering M., Snippert H.J., van Es J.H., Sato T., Stange D.E., Begthel H., van den Born M. Lgr5(+ve) stem cells drive self-renewal in the stomach and build long-lived gastric units in vitro. Cell Stem Cell. 2010;6:25–36. - PubMed
    1. Barker N., van Es J.H., Kuipers J., Kujala P., van den Born M., Cozijnsen M., Haegebarth A., Korving J., Begthel H., Peters P.J. Identification of stem cells in small intestine and colon by marker gene Lgr5. Nature. 2007;449:1003–1007. - PubMed
    1. Biernaskie J., Paris M., Morozova O., Fagan B.M., Marra M., Pevny L., Miller F.D. SKPs derive from hair follicle precursors and exhibit properties of adult dermal stem cells. Cell Stem Cell. 2009;5:610–623. - PMC - PubMed
    1. Bodo E., Kromminga A., Biro T., Borbiro I., Gaspar E., Zmijewski M.A., van Beek N., Langbein L., Slominski A.T., Paus R. Human female hair follicles are a direct, nonclassical target for thyroid-stimulating hormone. J. Invest. Dermatol. 2009;129:1126–1139. - PubMed