. 2020 Apr 14;12(8):6733-6755.
doi: 10.18632/aging.103033. Epub 2020 Apr 14.

Carnitine palmitoyltransferase 1C contributes to progressive cellular senescence

Affiliations

Carnitine palmitoyltransferase 1C contributes to progressive cellular senescence

Yongtao Wang et al. Aging (Albany NY). .

Abstract

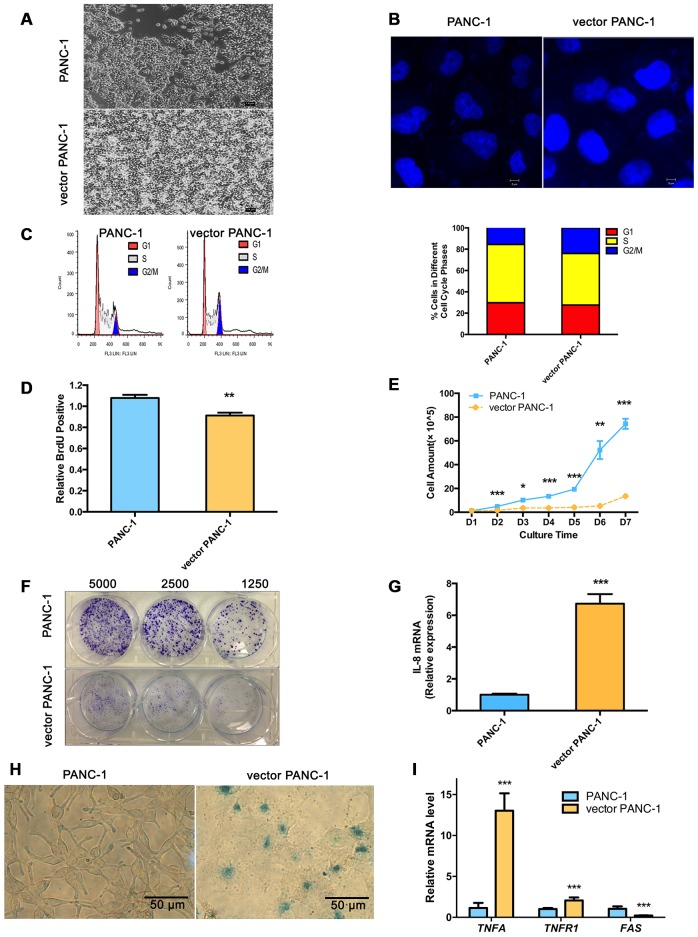
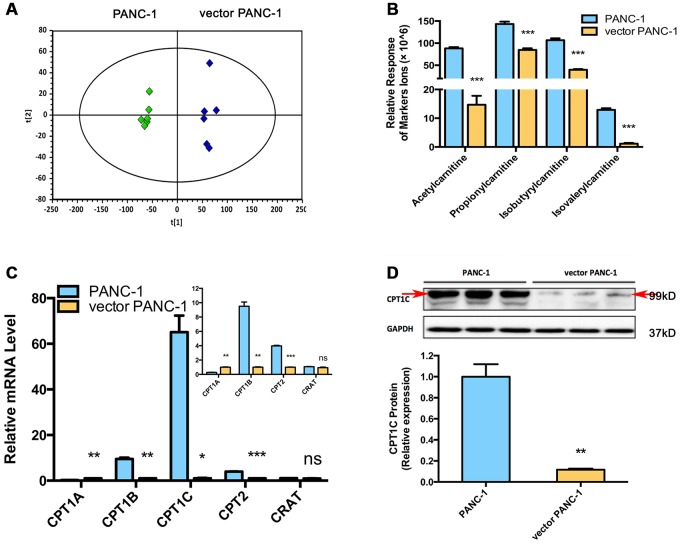
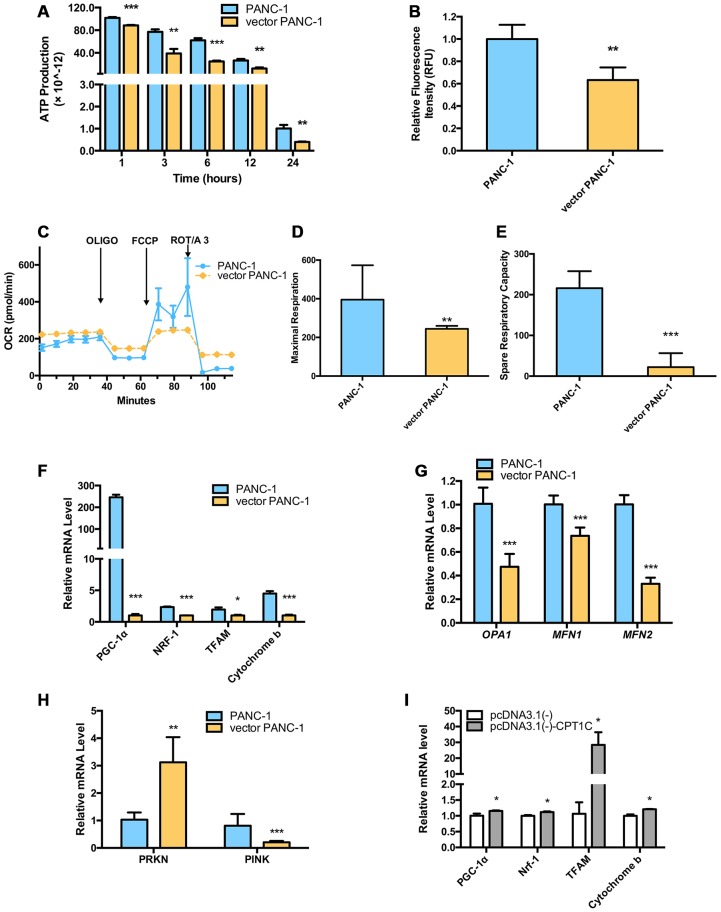
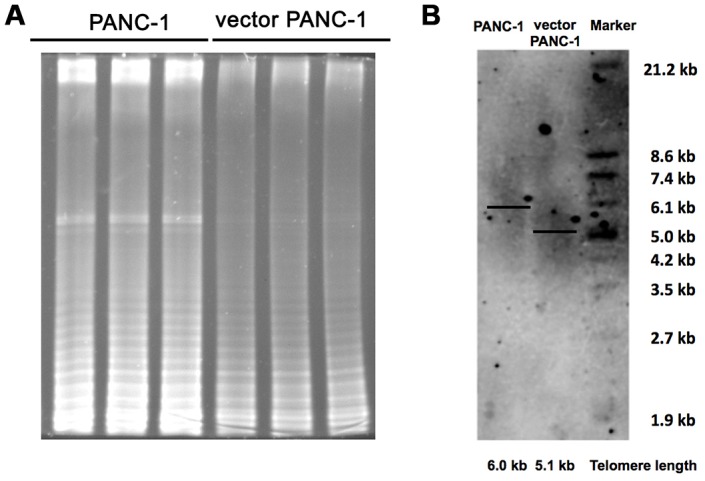
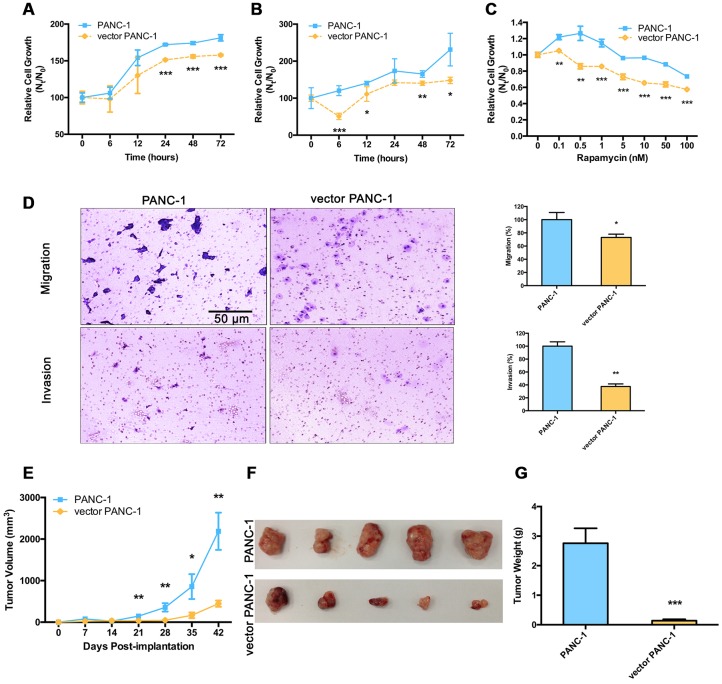
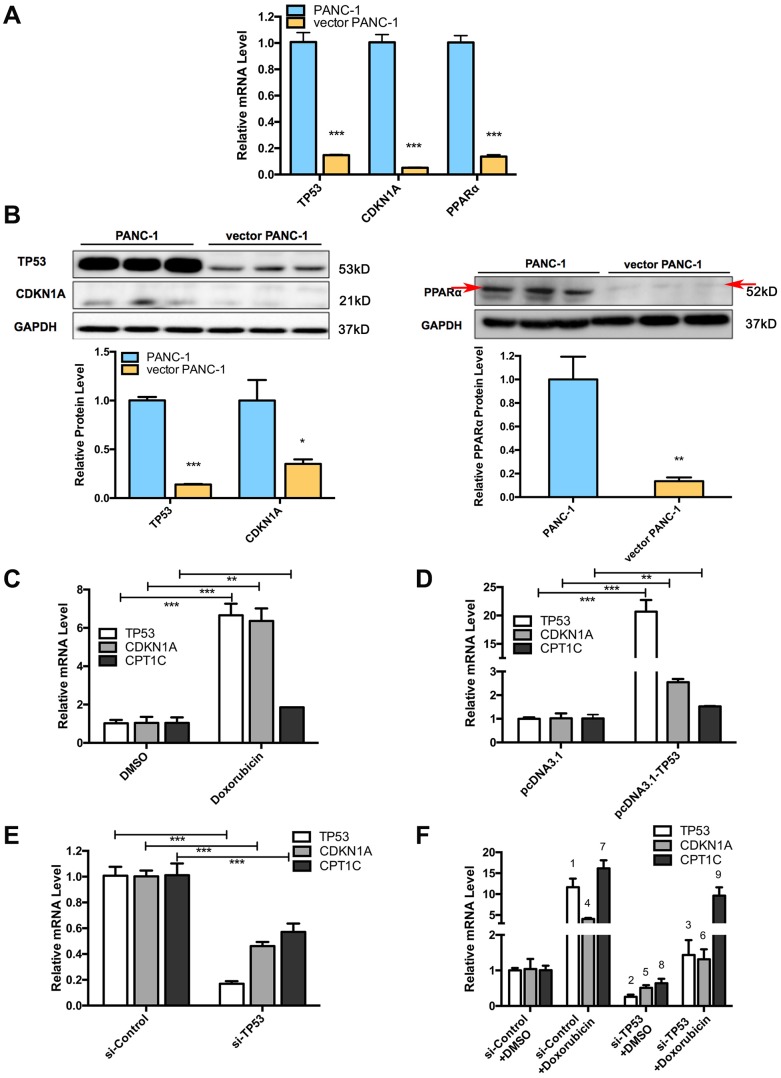
Stable transfection manipulation with antibiotic selection and passaging induces progressive cellular senescence phenotypes. However, the underlying mechanisms remain poorly understood. This study demonstrated that stable transfection of the empty vector induced PANC-1 cells into cellular senescence. Metabolomics revealed several acylcarnitines and their upstream regulatory gene, carnitine palmitoyltransferase 1C (CPT1C) involved in fatty acid β-oxidation in mitochondria, were strikingly decreased in senescent PANC-1 cells. Low CPT1C expression triggered mitochondrial dysfunction, inhibited telomere elongation, impaired cell survival under metabolic stress, and hindered the malignance and tumorigenesis of senescent cells. On the contrary, mitochondrial activity was restored by CPT1C gain-of-function in senescent vector PANC-1 cells. PPARα and TP53/CDKN1A, crucial signaling components in cellular senescence, were downregulated in senescent PANC-1 cells. This study identifies CPT1C as a key regulator of stable transfection-induced progressive PANC-1 cell senescence that inhibits mitochondrial function-associated metabolic reprogramming. These findings confirm the need to identify cell culture alterations after stable transfection, particularly when cells are used for metabolomics and mitochondria-associated studies, and suggest inhibition of CPT1C could be a promising target to intervene pancreatic tumorigenesis.

Keywords: carnitine palmitoyltransferase 1C; metabolic reprogramming; mitochondria; senescence; stable transfection.


Conflict of interest statement

CONFLICTS OF INTEREST: The authors declare no conflicts of interest.

Figures

Figure 1
Figure 1
Stable transfection-induced PANC-1 cell senescence. (A) Morphology graph of vector PANC-1 cells. (B) Confocal fluorescent graph of the nuclei (blue fluorescence) morphology of vector PANC-1 cells. (C) An increased percentage of vector PANC-1 cells was arrested in G2/M phase. Graphic (top) and percentage (bottom) representations of cell cycle distributions are shown. This experiment was repeated independently three times. (D) Decreased BrdU incorporation during DNA synthesis in vector PANC-1 cells. Data are presented as the mean ± S.E.M, n = 4 (**p < 0.01). (E) Cell growth curve shows decreased proliferation of vector PANC-1 cells. Data are presented as the mean ± S.E.M, n = 3 (*p < 0.05, **p < 0.01, ***p < 0.001). (F) Decreased ability of vector PANC-1 cells to form colonies when seeded at the indicated dilutions. (G) Quantitative RT-PCR analysis of the upregulated key SASP factor, IL-8 mRNA, in vector PANC-1 cells. Data are presented as the mean ± S.E.M, n = 3 (***p < 0.001). (H) SA-β-gal staining and positive senescence signal of vector PANC-1 cells. This experiment was repeated independently three times. (I) Activation of extrinsic apoptosis pathways was analyzed. See also Supplementary Figures 1 and 2.
Figure 2
Figure 2
Metabolomics reveals a lower level of acylcarnitines in senescent vector PANC-1 cells, which is linked to reduced CPT1C expression. (A) PCA score plots of HILIC-ESI+-MS metabolomics profiles obtained from HILIC-ESI+-MS, n = 6/group. (B) Analysis of the relative response of acylcarnitine ions in senescent vector PANC-1 cells. Data are presented as the mean ± S.E.M, n = 6 (***p < 0.001). (C) Quantitative RT-PCR analysis of genes related to acylcarnitines. Data are presented as the mean ± S.E.M, n = 3 (ns indicates no significance, *p < 0.05, **p < 0.01, ***p < 0.001). The specific human primers to amplify corresponding mRNA were obtained from website of http://pga.mgh.harvard.edu/primerbank/ and PrimerDepot, and commercially available (Invitrogen) and shown in Supplementary Table 1. (D) Images and densitometric analysis of CPT1C protein bands of senescent vector PANC-1 cells. Data are presented as the mean ± S.E.M, n = 3 (**p < 0.01). See also Supplementary Figure 3.
Figure 3
Figure 3
Dysfunctional mitochondria in low-CPT1C-expressing senescent vector PANC-1 cells. (A) ATP production in senescent vector PANC-1 cells, the magnitude of this difference increased as the time in PBS was extended to 24 h. Data are presented as the mean ± S.E.M, n = 4 (**p < 0.01, ***p < 0.001). (B) Loss of mitochondrial transmembrane potential measured by the rh123 dequenching method in senescent vector PANC-1 cells. Data are presented as the mean ± S.E.M, n = 4 (**p < 0.01). (C) Mitochondrial integrity in the forms of OCRs (pMol O2.min-1) in senescent vector PANC-1 cells. Data are presented as the mean ± S.E.M, n = 3. (D) Maximal respiration capacity in the form of OCRs in senescent vector PANC-1 cells. Data are presented as the mean ± S.E.M, n = 3 (**p < 0.01). (E) Spare respiratory capacity in the form of OCRs in senescent vector PANC-1 cells. Data are presented as the mean ± S.E.M, n = 3 (***p < 0.001). (F) Mitochondriogenesis analysis in senescent vector PANC-1 cells. Data are presented as the mean ± S.E.M, n = 3 (*p < 0.05, ***p < 0.001). (G) The mitochondrial network structure integrity analysis on the senescent cells. Data are presented as the mean ± S.E.M, n = 3 (***p < 0.001). (H) Mitochondrial autophagy analysis on the senescent cells. Data are presented as the mean ± S.E.M, n = 3 (**p < 0.01, ***p < 0.001). (I) Mitochondriogenesis analysis on senescent vector PANC-1 cells gaining of CPT1C function. Data are represented as mean ± S.E.M, n = 4 (*p< 0.05). See also Supplementary Figure 4.
Figure 4
Figure 4
Inhibited telomere elongation in low-CPT1C-expressing senescent vector PANC-1 cells. (A) Telomerase activity was analyzed with the TRAP assay in mock and vector PANC-1 cells. This experiment was repeated three times. (B) Telomere length was determined with the TRF length assay in mock and vector PANC-1 cells.
Figure 5
Figure 5
Malignance is reduced in low-CPT1C-expressing senescent vector PANC-1 cells. Sensitivity to metabolic stress from (A) glucose deprivation (0.5 mM glucose) and (B) glycolytic inhibition (20 mM 2-deoxyglucose) of senescent vector PANC-1 cells at the indicated time points. Data are presented as the mean ± S.E.M, n = 5 (*p < 0.05, **p < 0.01, ***p < 0.001). (C) Sensitivity to metabolic stress from rapamycin stimuli of senescent vector PANC-1 cells at the indicated concentrations. Data are presented as the mean ± S.E.M, n = 5 (**p < 0.01, ***p < 0.001). (D) Transwell migration and Matrigel invasion capacities of senescent vector PANC-1 cells. Data are presented as the mean ± S.E.M, n = 3 (*p < 0.05, **p < 0.01). (E) Tumor sizes are presented as the mean ± S.E.M over time, (n = 5) (**p < 0.01, ***p < 0.001). (F) Images of tumors after excision on day 42 post-implantation. (G) Comparison of dissected tumor weights (mean ± S.E.M, ***p < 0.001). See also Supplementary Figure 5.
Figure 6
Figure 6
Signaling pathways involved in low-CPT1C-expression-induced senescence in vector PANC-1 cells and regulation of the TP53 signaling pathway on CPT1C. (A) Quantitative RT-PCR analysis for suppressed genes in senescent vector PANC-1 cells. Data are presented as the mean ± S.E.M, n = 3 (***p < 0.001). (B) Images and densitometric analysis for protein bands altered in senescent vector PANC-1 cells. The left panel shared the same GAPDH control with Figure 2D, all these bands were harvested from the same experiment. Data are presented as the mean ± S.E.M, n = 3 (*p < 0.05, **p < 0.01, ***p < 0.001). (C) The CPT1C mRNA level is upregulated after inducing TP53 mRNA expression with 0.7 μM doxorubicin (Sigma) for 24 h in PANC-1 cells. (D) CPT1C mRNA is increased after overexpressing 2 μg of TP53 plasmids for 24 h in PANC-1 cells. (E) CPT1C mRNA expression was downregulated after knockdown of TP53 mRNA expression with 50 μM si-TP53 for 72 h in PANC-1 cells. The sequences of specific human siRNAs were commercially available (RiboBio) and listed in Supplementary Table 2. The optimal sense against TP53 was the following: 5'-GCACAGAGGAAGAGAAUCU dTdT-3'. (F) Doxorubicin reversed the si-TP53-induced downregulation of CPT1C mRNA expression. For the statistical analysis of TP53 mRNA expression, 1 si-Control+Doxorubicin vs si-Control+DMSO, ***p < 0.001; 2 si-TP53+DMSO vs si-Control+DMSO, ***p < 0.001; and 3 si-TP53+Doxorubicin vs si-TP53+DMSO, **p < 0.01. For the statistical analysis of CDKN1A/P53 mRNA level, 4 si-Control+Doxorubicin vs si-Control+DMSO, ***p < 0.001; 5 si-TP53+DMSO vs si-Control+DMSO, *p < 0.05; and 6 si-TP53+Doxorubicin vs si-TP53+DMSO, **p < 0.01. For the statistical analysis of CPT1C mRNA expression, 7 si-Control+Doxorubicin vs si-Control+DMSO, ***p < 0.001; 8 si-TP53+DMSO vs si-Control+DMSO, *p < 0.05; and 9 si-TP53+Doxorubicin vs si-TP53+DMSO, **p < 0.01. See also Supplementary Figure 7.

References

    1. Shearer RF, Saunders DN. Experimental design for stable genetic manipulation in mammalian cell lines: lentivirus and alternatives. Genes Cells. 2015; 20:1–10. 10.1111/gtc.12183 - DOI - PubMed
    1. Wang Y, Chen Y, Guan L, Zhang H, Huang Y, Johnson CH, Wu Z, Gonzalez FJ, Yu A, Huang P, Wang Y, Yang S, Chen P, et al.. Carnitine palmitoyltransferase 1C regulates cancer cell senescence through mitochondria-associated metabolic reprograming. Cell Death Differ. 2018; 25:735–48. 10.1038/s41418-017-0013-3 - DOI - PMC - PubMed
    1. Bi HC, Pan YZ, Qiu JX, Krausz KW, Li F, Johnson CH, Jiang CT, Gonzalez FJ, Yu AM. N-methylnicotinamide and nicotinamide N-methyltransferase are associated with microRNA-1291-altered pancreatic carcinoma cell metabolome and suppressed tumorigenesis. Carcinogenesis. 2014; 35:2264–72. 10.1093/carcin/bgu174 - DOI - PMC - PubMed
    1. Chien Y, Scuoppo C, Wang X, Fang X, Balgley B, Bolden JE, Premsrirut P, Luo W, Chicas A, Lee CS, Kogan SC, Lowe SW. Control of the senescence-associated secretory phenotype by NF-κB promotes senescence and enhances chemosensitivity. Genes Dev. 2011; 25:2125–36. 10.1101/gad.17276711 - DOI - PMC - PubMed
    1. Kortlever RM, Higgins PJ, Bernards R. Plasminogen activator inhibitor-1 is a critical downstream target of p53 in the induction of replicative senescence. Nat Cell Biol. 2006; 8:877–84. 10.1038/ncb1448 - DOI - PMC - PubMed

Publication types

MeSH terms