. 2020 Apr 10;9(4):488.
doi: 10.3390/plants9040488.

Triacontanol Promotes the Fruit Development and Retards Fruit Senescence in Strawberry: A Transcriptome Analysis

Affiliations

Triacontanol Promotes the Fruit Development and Retards Fruit Senescence in Strawberry: A Transcriptome Analysis

Qianqian Pang et al. Plants (Basel). .

Abstract

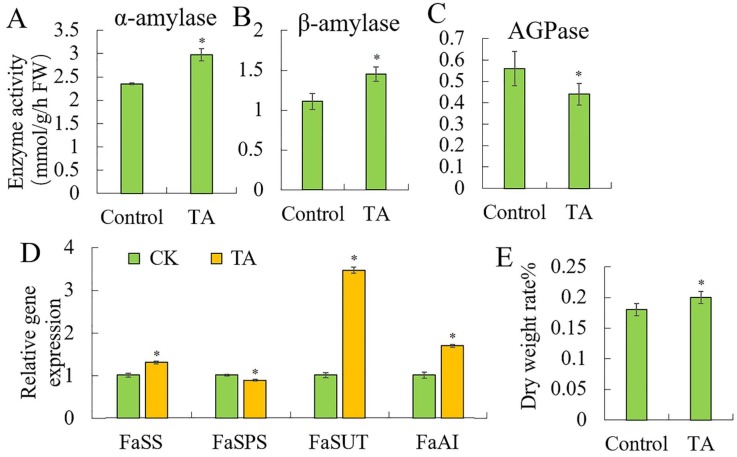
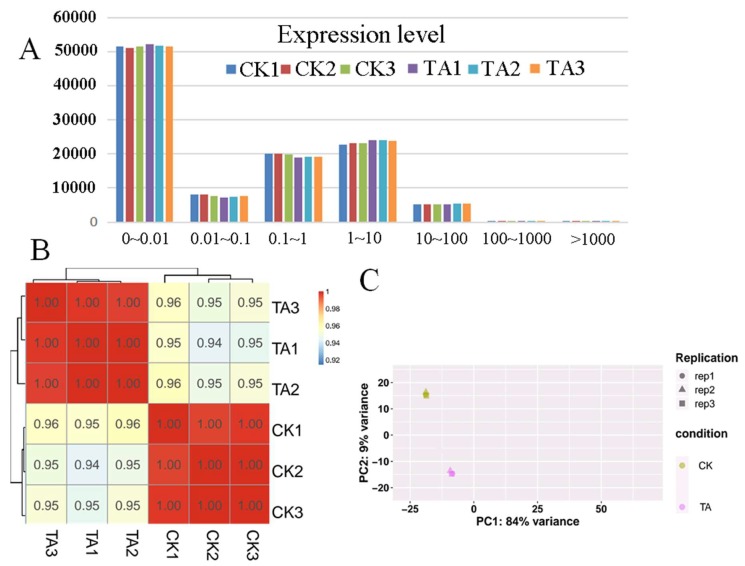
Triacontanol (TA) is a non-toxic, pollution-free, low-cost, high-efficiency, broad-spectrum plant growth regulator that plays an important role in plant growth and development, but its regulation mechanism of strawberry (Sweet charlie, Fragaria × ananassa Duch.) fruit development is still unclear. In this study, we showed that TA treatment (50 μM) could promote fruit development by up-regulating factors related to fruit ripening-related growth and development. TA increased fruit sugar content and anthocyanin accumulation, and many stress-related enzyme activities. In the meantime, Illumina RNA-Seq technology was used to evaluate the effect of TA treatment on strawberry fruit senescence. The results showed that 9338 differentially expressed genes (DEGs) were obtained, including 4520 up-regulated DEGs and 4818 down-regulated DEGs. We performed gene ontology (GO) enrichment and Kyoto Encyclopedia of Genes and Genomes (KEGG) analysis of these DEGs. The results showed that TA treatment caused changes in transcript levels related to cellular processes, hormones and secondary metabolism, such as DNA metabolic processes, flavonoid synthesis, and plant hormone signal transduction. Bioinformatics analysis showed that many transcription factors were related to fruit maturity. Taken together, this study will provide new insights into the mechanism of strawberry development and postharvest response to TA treatment.

Keywords: development; senescence; strawberry; transcriptome; triacontanol.


Conflict of interest statement

The authors declare no conflict of interest.

Figures

Figure 1
Figure 1
Effects of triacontanol on strawberry fruit ripening. (A). Fruit number. (B). Anthocyanin content. (C). Chlorophyll content. (D). VC (vitamin C) content. (E). TSS % (total soluble solid). (F). Sugar content. (G). Firmness. (H). TA %. (I). ABA (abscisic acid) content. (J). IAA (indoleacetic acid) content. (K). Ethylene content. (L). Protein content. Control: CK; TA: triacontanol. Vertical bars represented standard deviations (SD) of means (n = 3). Asterisks indicated statistically significant differences at p < 0.05 as determined by Student’s t-test.
Figure 2
Figure 2
Effects of triacontanol on sugar metabolism. Enzyme activities of (A). α-amylase. (B). β-amylase. (C). AGPase. (D). Relative gene expression. (E). Dry weight rate%. Vertical bars represented standard deviations (SD) of means (n = 3). Asterisks indicated statistically significant differences at p < 0.05 as determined by Student’s t-test.
Figure 3
Figure 3
Effects of triacontanol on strawberry fruit stress resistance. (A). Number of flowers. (B). Number of buds. (C). Inflorescence length. Enzyme activities of (D). SOD (superoxide dismutase). (E). POD (peroxidase). (F). CAT (catalase). (G). PPO (polyphenol oxidase). (H). Proline. (I). MDA (malondialdehyde). (J). Relative gene expression. Vertical bars represented standard deviations (SD) of means (n = 3). Asterisks indicated statistically significant differences at p < 0.05 as determined by Student’s t-test.
Figure 4
Figure 4
Different treatment samples analysis. (A). The calculation of expression level in strawberry fruit under TA (triacontanol) treatment. A total of 108,087 genes were identified and the number of genes in different sections were similar among both control and TA-treated. (B). Correlation matrix showed the correlation between samples. Both the CK (control) and TA-treated had the darkest colors, indicating that the correlation between the same treatment samples was the highest. (C). Principal Component Analysis (PCA) were performed on the biological replicates of each sample set (CK and TA), which the same treatment samples were closed, indicating the higher similarity between samples.
Figure 5
Figure 5
Classification analysis of differentially expressed genes. (A). Volcano map displayed the relation between log 2 (Fold Change) and -log 10 (p-value), which more obviously showed the diversity expression of up-regulated and down-regulated DEGs (differentially expressed genes). The blue color on the figure were down-regulated genes, the red were up-regulated genes and the grey color in the middle were the genes have no difference. (B). Clusters of differentially expressed genes in the control and TA-treated groups. Genes were shown horizontally, and each column was a sample. The red was highly expressed genes and green was low expressed genes.
Figure 6
Figure 6
Enrichment analysis of differentially expressed genes. (A). The top ten significant enrichment GO term in biological process (BP), molecular function (MF) and cellular component (CC). The abscissa was the logarithm of the significant enrichment P value with the base 10, and the ordinate was the gene ID. (B). Top 20 KEGG enrichment pathways by FDR. Rich Factor was the ratio of the differentially expressed number of genes located in the pathway. The higher the Rich Factor, the higher the degree of enrichment. FDR was false discovery rate in the range of 0 to 1, the closer to zero, the more significant the enrichment.

References

    1. Wang W., Wang S., Wang M. Status and extension experience of protected strawberry cultivation technology in daxing district. J. Veg. 2019;4:67–70.
    1. Li D.D. Molecular Mechanism and Key miRNA Regulatory Factors of Strawberry Fruit Maturation Regulated by ABA. Zhejiang University; Hangzhou, China: 2019.
    1. Lu W.J. Mechanisms of ABA and Auxin Regulating Banana and Strawberry Fruit Maturity. Zhejiang University; Hangzhou, China: 2018.
    1. Alexander L., Grierson D. Ethylene biosynthesis and action in tomato: A model for climacteric fruit ripening. J. Exp. Bot. 2002;53:2039–2055. doi: 10.1093/jxb/erf072. - DOI - PubMed
    1. Pan Y.G., Xie J.H. Modern Postharvest Physiology of Fruits and Vegetables. Chemical Industry Press; Beijing, China: 2009. pp. 51–95.

LinkOut - more resources