. 2020 Jun 9;202(13):e00792-19.
doi: 10.1128/JB.00792-19. Print 2020 Jun 9.

Global Regulatory Roles of the Histidine-Responsive Transcriptional Repressor HutC in Pseudomonas fluorescens SBW25

Affiliations

Global Regulatory Roles of the Histidine-Responsive Transcriptional Repressor HutC in Pseudomonas fluorescens SBW25

Naran Naren et al. J Bacteriol. .

Abstract

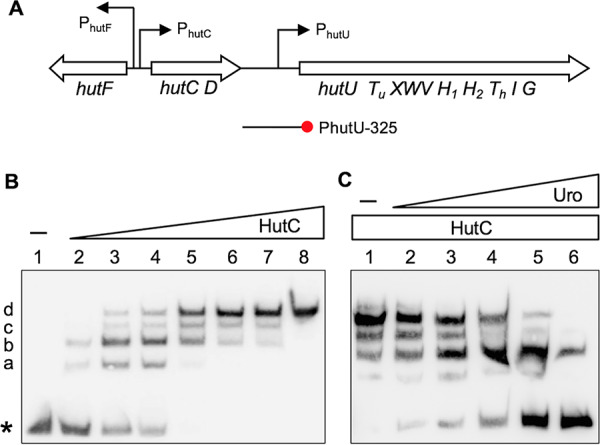
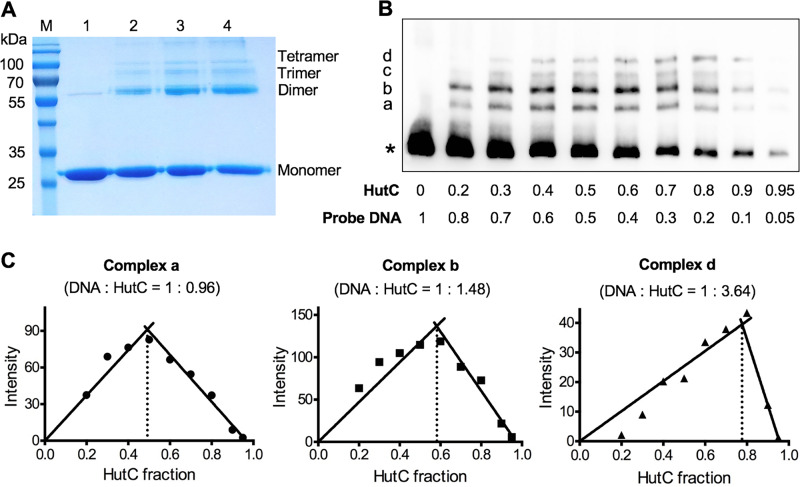
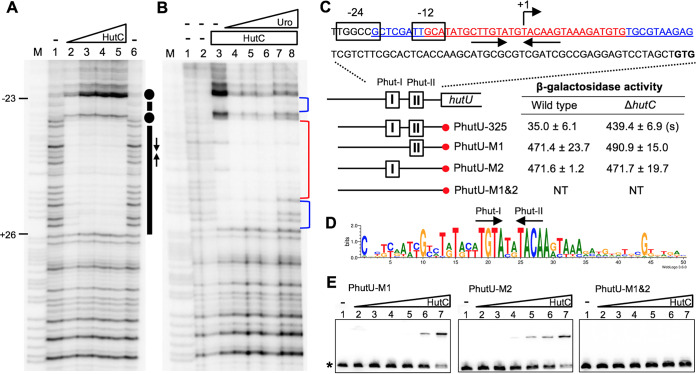
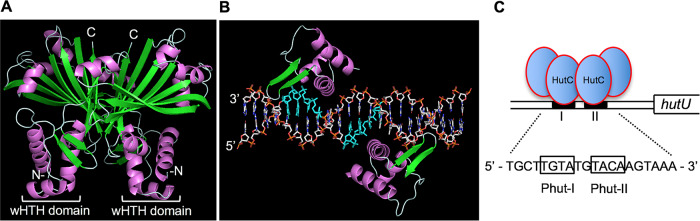
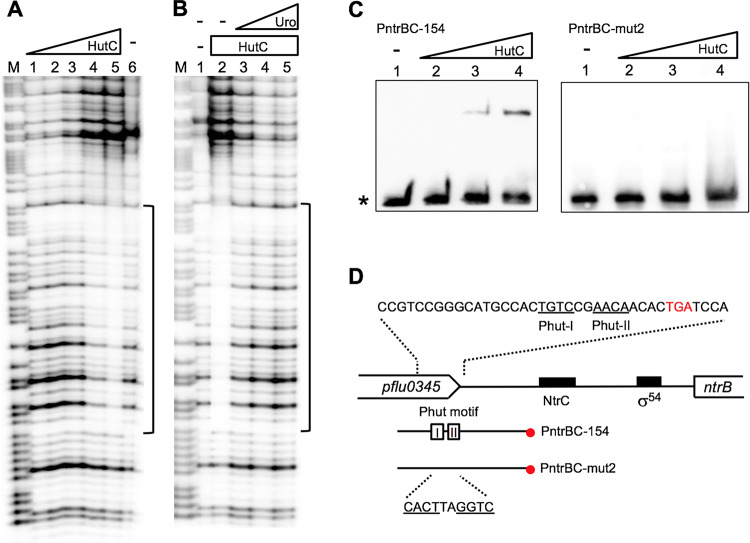
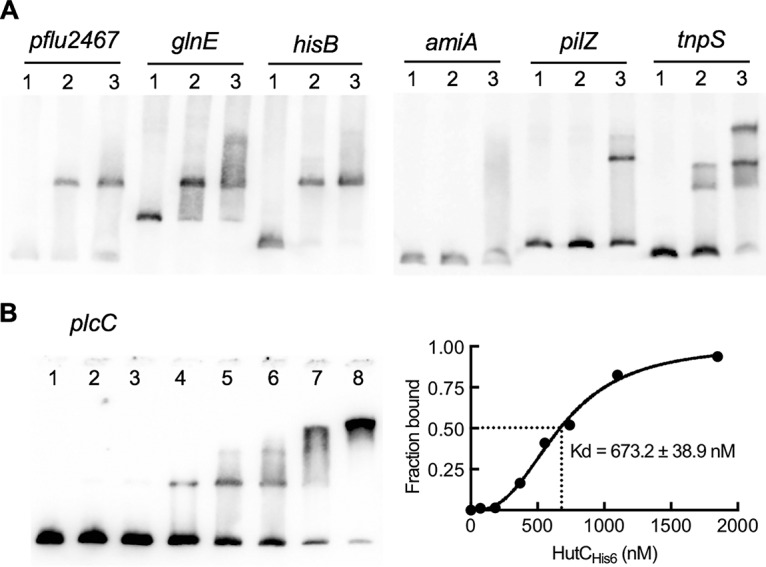
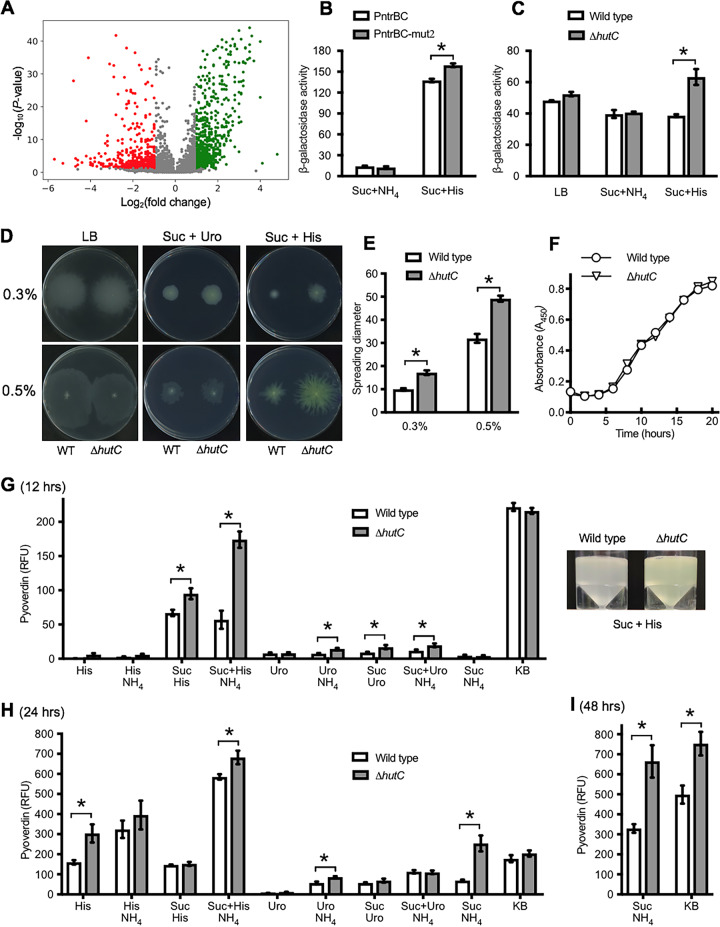
HutC is known as a transcriptional repressor specific for histidine utilization (hut) genes in Gram-negative bacteria, including Pseudomonas fluorescens SBW25. However, its precise mode of protein-DNA interactions hasn't been examined with purified HutC proteins. Here, we performed electrophoretic mobility shift assay (EMSA) and DNase I footprinting using His6-tagged HutC and biotin-labeled probe of the hut promoter (PhutU). Results revealed a complex pattern of HutC oligomerization, and the specific protein-DNA interaction is disrupted by urocanate, a histidine derivative, in a concentration-dependent manner. Next, we searched for putative HutC-binding sites in the SBW25 genome. This led to the identification of 143 candidate targets with a P value less than 10-4 HutC interaction with eight selected candidate sites was subsequently confirmed by EMSA analysis, including the type IV pilus assembly protein PilZ, phospholipase C (PlcC) for phosphatidylcholine hydrolyzation, and key regulators of cellular nitrogen metabolism (NtrBC and GlnE). Finally, an isogenic hutC deletion mutant was subjected to transcriptome sequencing (RNA-seq) analysis and phenotypic characterization. When bacteria were grown on succinate and histidine, hutC deletion caused upregulation of 794 genes and downregulation of 525 genes at a P value of <0.05 with a fold change cutoff of 2.0. The hutC mutant displayed an enhanced spreading motility and pyoverdine production in laboratory media, in addition to the previously reported growth defect on the surfaces of plants. Together, our data indicate that HutC plays global regulatory roles beyond histidine catabolism through low-affinity binding with operator sites located outside the hut locus.IMPORTANCE HutC in Pseudomonas is a representative member of the GntR/HutC family of transcriptional regulators, which possess a N-terminal winged helix-turn-helix (wHTH) DNA-binding domain and a C-terminal substrate-binding domain. HutC is generally known to repress expression of histidine utilization (hut) genes through binding to the PhutU promoter with urocanate (the first intermediate of the histidine degradation pathway) as the direct inducer. Here, we first describe the detailed molecular interactions between HutC and its PhutU target site in a plant growth-promoting bacterium, P. fluorescens SBW25, and further show that HutC possesses specific DNA-binding activities with many targets in the SBW25 genome. Subsequent RNA-seq analysis and phenotypic assays revealed an unexpected global regulatory role of HutC for successful bacterial colonization in planta.

Keywords: HutC; Pseudomonas; gene regulation; histidine utilization; plant-microbe interactions.


Figures

FIG 1
FIG 1
hut gene organization (A) and EMSAs showing specific binding of HutC with the PhutU promoter (B) and the effects of urocanate (C). (A) hut genes are organized in three transcriptional units: hutF, hutCD, and ten genes from hutU to hutG. The location and orientation of hut promoters are indicated by bent arrows. The red circle denotes the biotin-labeled 3′ end of the PhutU-325 probe used in the EMSAs. (B) HutCHis6 was added at increasing concentrations of 0, 35, 70, 140, 210, 315, 525, and 2,100 nM in lanes 1 to 8, respectively. The position of free probes is indicated by an asterisk. (C) EMSA was performed in reaction mixtures containing 280 nM HutCHis6 and 20 nM PhutU-325 probe with urocanate added at final concentrations of 0, 125, 250, 500, 1,000, and 1,500 μM in lanes 1 to 6, respectively.
FIG 2
FIG 2
HutC oligomerization and stoichiometry of HutC-PhutU interactions. (A) Formaldehyde cross-linking was performed with 19 μM HutCHis6 (28.6 kDa), and protein samples in lanes 1 to 4 were treated with 25 mM formaldehyde for 0, 1, 2.5, and 4 h, respectively. (B) EMSA analysis of HutCHis6 and PhutU DNA performed at the final concentration of 0.1 μM in total. The mole fractions of protein and DNA are shown below the gel image for each sample. (C) Job plots of DNA-to-protein ratios for complexes a, b, and d. The lines are the least-square fits to the rising and falling subsets of the data, and their intersection yields the binding stoichiometry of each protein/DNA complex.
FIG 3
FIG 3
Sequence determination of the HutC operator site in the PhutU promoter. (A) DNase I footprinting was performed using purified HutCHis6 and a 325-bp biotin-labeled probe, PhutU-325. Lane M, G+A marker; lanes 1 and 6, no HutCHis6; lanes 2 to 5, HutCHis6 added at 0.68, 2.39, 4.08, and 5.78 μM, respectively. The HutC-protected region and Phut half sites are indicated by bars and inverted arrows, respectively. Dots denote hypersensitive residues for DNase I cleavage. (B) Effects of urocanate on DNase I analysis of HutCHis6 (2.8 μM) and the PhutU-325 probe (2.0 μM). Lane M, G+A marker; lanes 1 and 2, no HutCHis6 and no urocanate; lanes 3 to 8, urocanate added at 0, 0.2, 0.5, 1, 2, and 3 mM, respectively. The strong and weak HutC-protected regions are marked with red and blue brackets, respectively. (C) The HutCHis6-protected region is underlined, and sequences of the strong and weak protected DNA regions are shown in red and blue, respectively. β-Galactosidase activity was measured in two genetic backgrounds (wild type versus ΔhutC) for lacZ fusion to the PhutU promoter and three derived mutant alleles lacking Phut-I and/or Phut-II repeats. “(s)” denotes a significant difference between the wild-type and ΔhutC strains as revealed by the Student t test (P < 0.01). NT, not tested. (D) Sequence logo generated from the alignment of PhutU and PhutF promoters from 40 representative Pseudomonas strains. (E) EMSA was performed using 325-bp biotin-labeled probes containing the wild-type or mutant alleles (Phut-I and/or Phut-II). Lanes 1 to 7, HutCHis6 added at 0, 37, 74, 148, 222, 296, and 555 nM, respectively.
FIG 4
FIG 4
The proposed model of HutC interaction with the PhutU promoter DNA. (A) A homology model generated in the SWISS-MODEL server showing the side view of the HutC homodimer. Helices are represented in violet and strands in green. (B) Structural prediction of HutC protein and operator DNA complex. Only the dimeric wHTH DNA-binding domains are shown for clarity, and the conserved Phut-I and Phut-II sites in the Watson strand are highlighted in cyan. (C) Schematic representation of the HutC tetramer bound with the PhutU promoter. This involves direct interactions between the HutC dimer and PhutU with the formation of a HutC tetramer via protein-protein interactions.
FIG 5
FIG 5
Characterization of the HutC-binding site in the ntrBC promoter region. (A) DNase I footprinting was performed using the PntrBC-154 probe labeled at the 3′ end. Lane M, G+A marker; lane 6, no HutCHis6; lanes 1 to 5, HutCHis6 added at 0.26, 0.77, 1.8, 3.34 and 5.14 μM, respectively. (B) DNase I analysis showing the effect of urocanate on HutCHis6 binding. Lane 1, no HutCHis6 and no urocanate; lanes 2 to 5, HutCHis6 (5.14 μM) with urocanate added at 0, 0.2, 0.5, and 2.0 mM, respectively. (C) EMSA of HutCHis6 using 3′-end biotin-labeled probe PntrBC-154 or mutant probe PntrBC-mut2 carrying mutations in the Phut motif. Lanes 1 to 4, HutCHis6 added at 0, 0.64, 1.28, and 1.92 μM, respectively. The position of free probe is marked by an asterisk. (D) Sequence of the HutC-protected region as revealed by DNase I footprinting. The two HutC-binding half sites are shown by underlined letters, and the corresponding sequence was mutated in the PntrBC-mut2 probe DNA.
FIG 6
FIG 6
Interactions between HutCHis6 and seven candidate target DNAs. (A) EMSA was performed with DIG-labeled probes containing the Phut site in the promoter region of the gene shown above the gel image. Lanes 1 to 3, HutCHis6 added at 0, 0.73, and 2.2 μM, respectively. (B) EMSA of HutCHis6 with a biotin-labeled probe for the plcC promoter. HutCHis6 was added at 0, 0.074, 0.185, 0.370, 0.555, 0.74, 1.10, and 1.85 μM in lanes 1 to 8, respectively. The strength of binding is calculated as the equilibrium dissociation shown at the right.
FIG 7
FIG 7
Comparative RNA-seq and phenotypic analysis between wild-type SBW25 and the isogenic mutant devoid of hutC. (A) Volcano plot displaying the differentially expressed genes. Green dots represent upregulated genes, whereas red dots indicate downregulated genes in the ΔhutC mutant. (B) Promoter activities of ′lacZ fusions to PntrBC and its variant PntrBC-mut2 in the wild-type background. β-Galactosidase assays were performed for cells grown in the defined medium at 6 h after inoculation. Values are means and standard errors from four replicate cultures. (C) Expression of PplcC-lacZ fusion in wild-type and ΔhutC mutant backgrounds. (D) Agar plates showing the spreading of the wild-type (WT) and ΔhutC strains in LB and minimal salt medium supplemented with succinate (Suc) (20 mM) and histidine (His) (10 mM) or urocanate (Uro) (10 mM). Photos were taken 16 and 36 h after inoculation in 0.3% and 0.5% agar, respectively. (E) Diameters were measured for ten replicate plates in the succinate-plus-histidine medium. (F) Growth dynamics of wild-type SBW25 and the ΔhutC mutant in minimal broth of succinate plus histidine. (G to I) Production of pyoverdine, expressed as relative fluorescence units (RFU), was measured in ten media at 12 (G), 24 (H), and 48 (I) hours after inoculation. Data are means and standard errors from four replicate cultures. Asterisks indicate significant differences (P < 0.05).

Similar articles

Cited by

References

    1. Balleza E, López-Bojorquez LN, Martínez-Antonio A, Resendis-Antonio O, Lozada-Chávez I, Balderas-Martínez YI, Encarnación S, Collado-Vides J. 2009. Regulation by transcription factors in bacteria: beyond description. FEMS Microbiol Rev 33:133–151. doi:10.1111/j.1574-6976.2008.00145.x. - DOI - PMC - PubMed
    1. Bervoets I, Charlier D. 2019. Diversity, versatility and complexity of bacterial gene regulation mechanisms: opportunities and drawbacks for applications in synthetic biology. FEMS Microbiol Rev 43:304–339. doi:10.1093/femsre/fuz001. - DOI - PMC - PubMed
    1. Bender RA. 2012. Regulation of the histidine utilization (hut) system in bacteria. Microbiol Mol Biol Rev 76:565–584. doi:10.1128/MMBR.00014-12. - DOI - PMC - PubMed
    1. Itoh Y, Nishijyo T, Nakada Y. 2007. Histidine catabolism and catabolite regulation, p 371–395. In Ramos H-L, Fillous A (ed), Pseudomonas. Springer, Berlin, Germany.
    1. Smith GR, Magasanik B. 1971. Nature and self-regulated synthesis of the repressor of the hut operons in Salmonella typhimurium. Proc Natl Acad Sci U S A 68:1493–1497. doi:10.1073/pnas.68.7.1493. - DOI - PMC - PubMed

Publication types

MeSH terms