. 2020 Jun;183(2):637-655.
doi: 10.1104/pp.19.01082. Epub 2020 Apr 14.

Insights into the Diversification and Evolution of R2R3-MYB Transcription Factors in Plants

Affiliations

Insights into the Diversification and Evolution of R2R3-MYB Transcription Factors in Plants

Chen-Kun Jiang et al. Plant Physiol. 2020 Jun.

Abstract

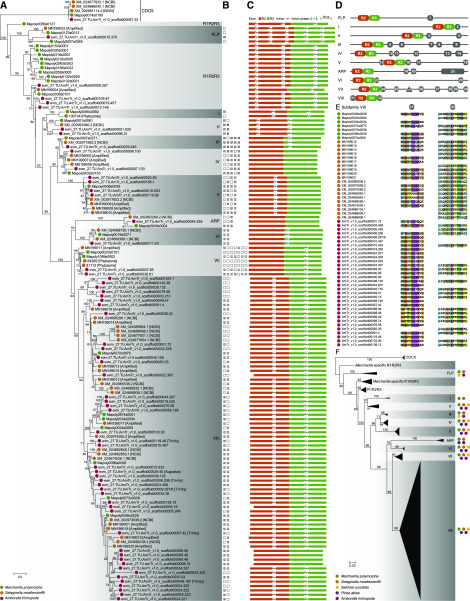
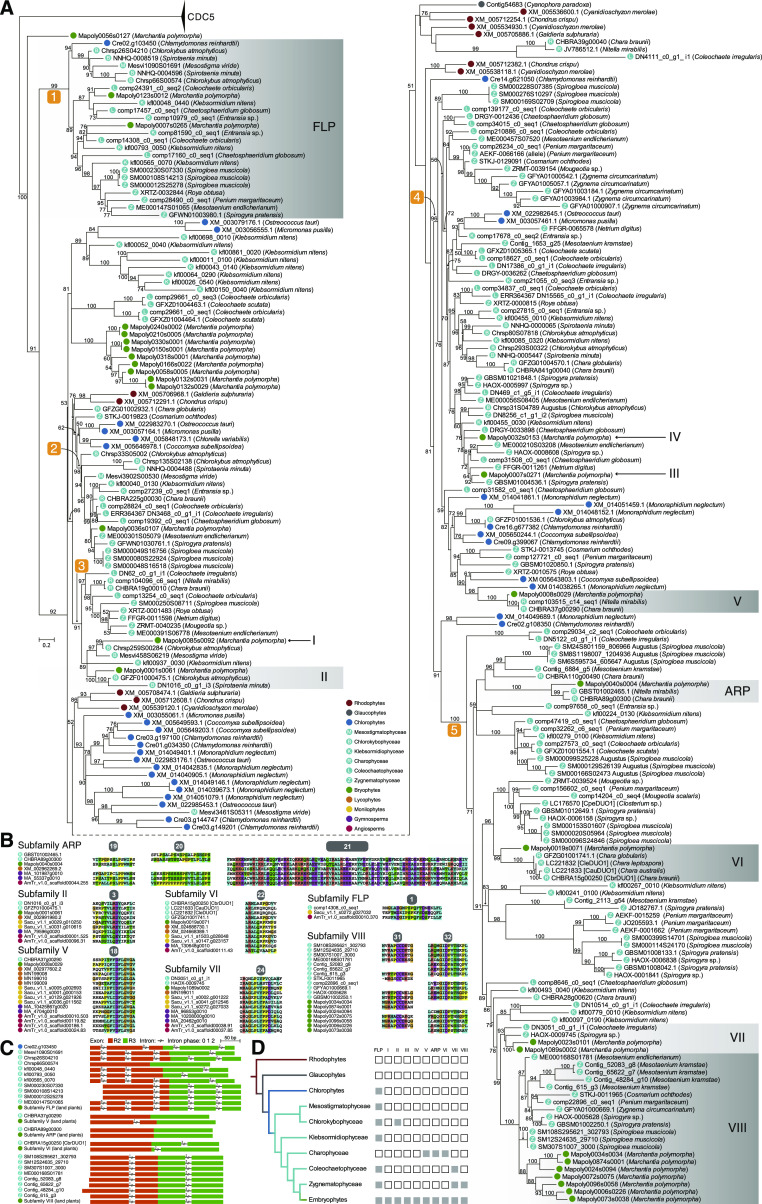
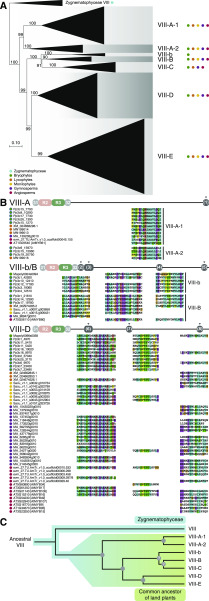
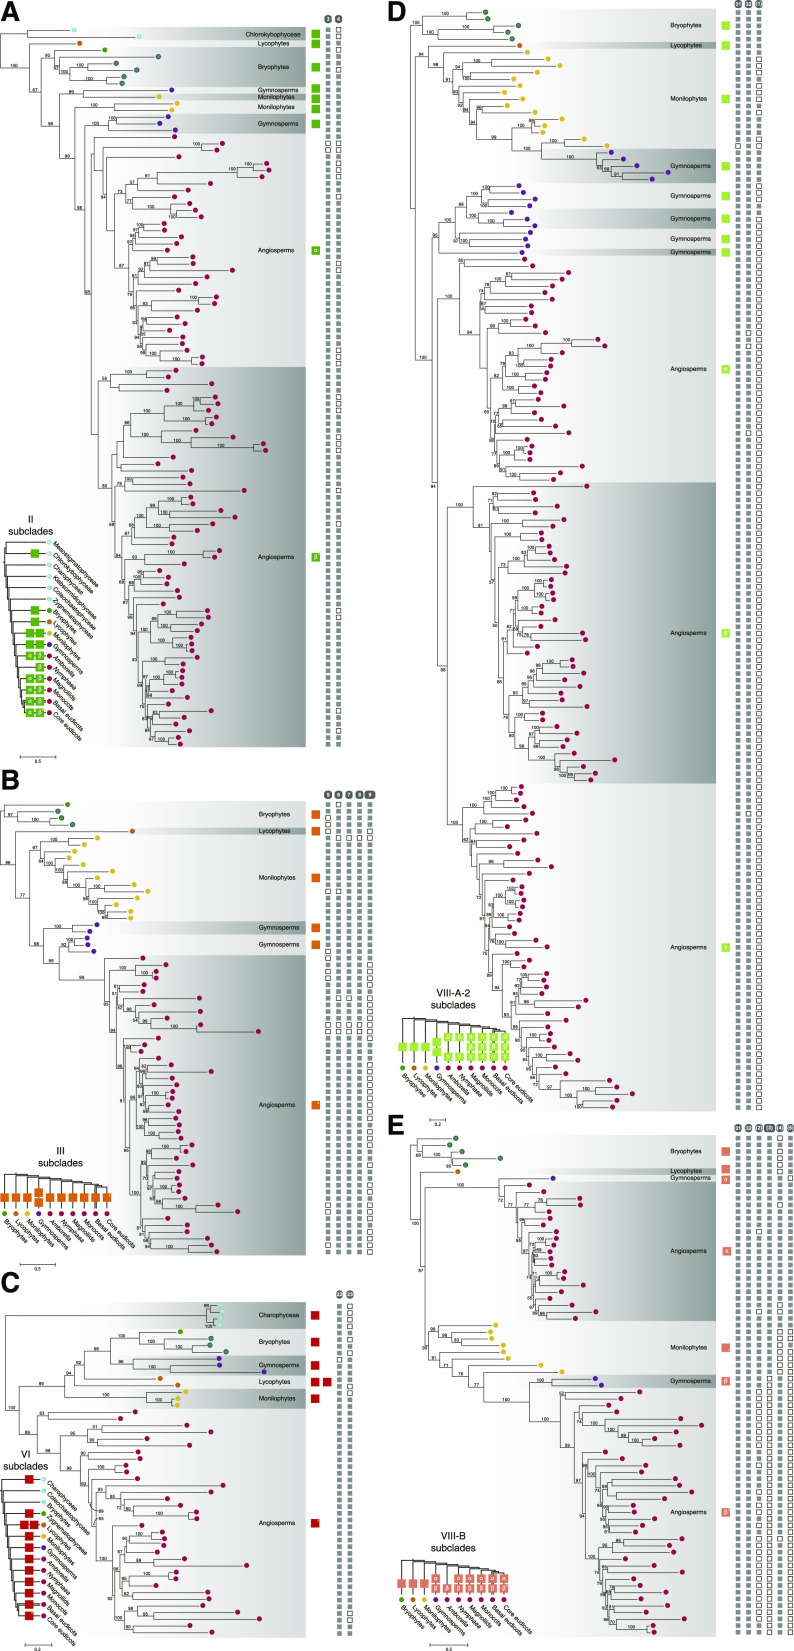
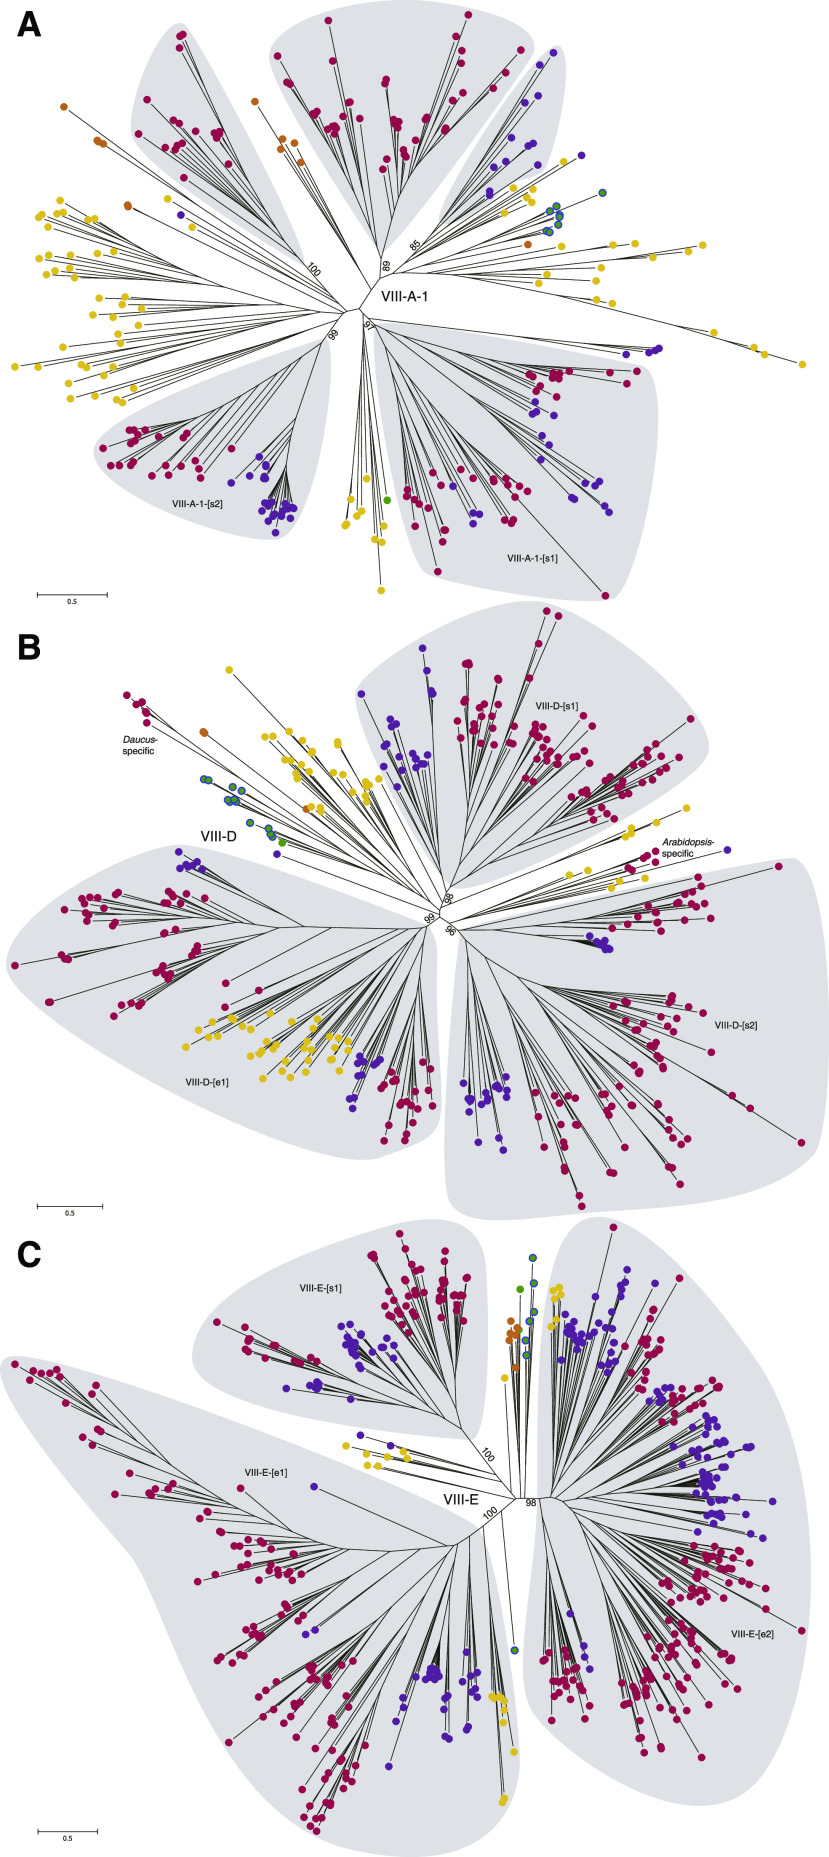
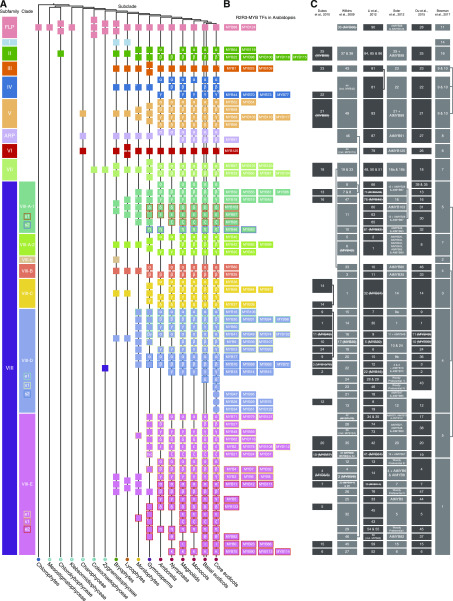
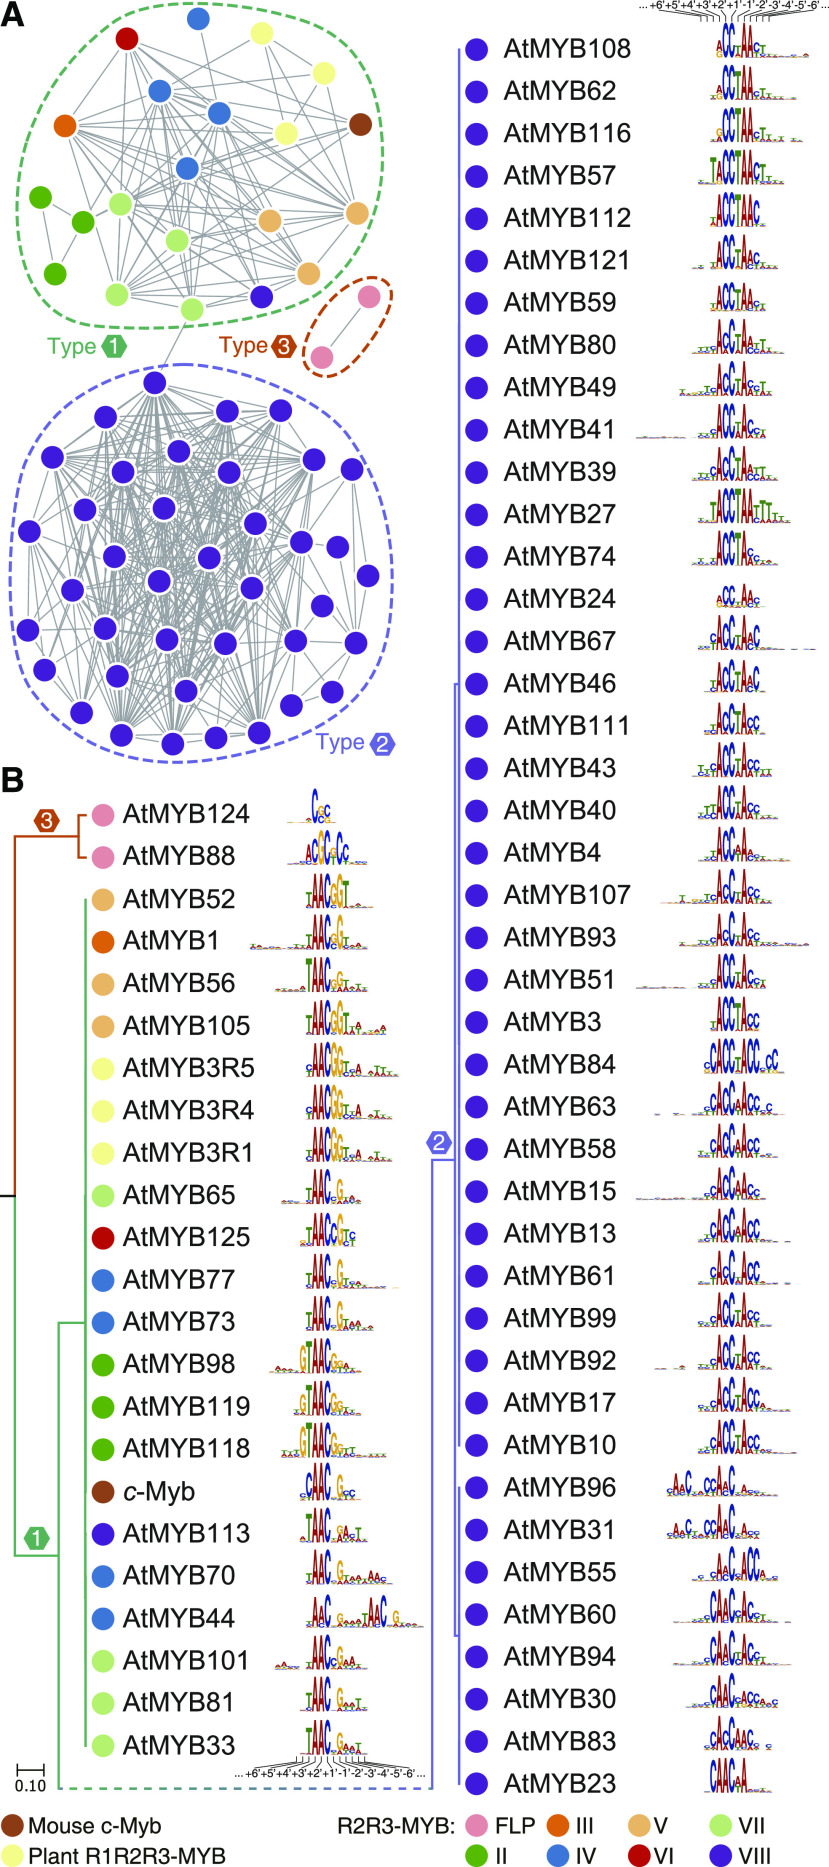
As one of the largest families of transcription factors (TFs) in plants, R2R3-MYB proteins play crucial roles in regulating a series of plant-specific biological processes. Although the diversity of plant R2R3-MYB TFs has been studied previously, the processes and mechanisms underlying the expansion of these proteins remain unclear. Here, we performed evolutionary analyses of plant R2R3-MYB TFs with dense coverage of streptophyte algae and embryophytes. Our analyses revealed that ancestral land plants exhibited 10 subfamilies of R2R3-MYB proteins, among which orthologs of seven subfamilies were present in chlorophytes and charophycean algae. We found that asymmetric gene duplication events in different subfamilies account for the expansion of R2R3-MYB proteins in embryophytes. We further discovered that the largest subfamily of R2R3-MYBs in land plants, subfamily VIII, emerged in the common ancestor of Zygnematophyceae and embryophytes. During plant terrestrialization, six duplication events gave rise to seven clades of subfamily VIII. Subsequently, this TF subfamily showed a tendency for expansion in bryophytes, lycophytes, and ferns and extensively diversified in ancestral gymnosperms and angiosperms in clades VIII-A-1, VIII-D, and VIII-E. In contrast to subfamily VIII, other subfamilies of R2R3-MYB TFs have remained less expanded across embryophytes. The findings regarding phylogenetic analyses, auxiliary motifs, and DNA-binding specificities provide insight into the evolutionary history of plant R2R3-MYB TFs and shed light on the mechanisms underlying the extensive expansion and subsequent sub- and neofunctionalization of these proteins.


Figures

Figure 1.
Figure 1.
Phylogenetic analysis of proteins with R2R3-MYB domains in representative land plants. A, Maximum likelihood (ML) phylogeny of proteins with R2R3-MYB domains in M. polymorpha, S. moellendorffii, and A. trichopoda. The MYB protein CDC5 sequences were used as the outgroup. Ultrafast bootstrap values are associated with the internal branches; values <50 were omitted. R1R2R3-MYB TFs and 10 subfamilies of R2R3-MYB TFs are labeled. The bracketed text indicates the source database or the sequence amplified in this study. B, The presence or absence of subfamily-specific auxiliary motifs of R2R3-MYB TFs is indicated by a solid or open square, respectively, with number labels corresponding to the terminal nodes of the phylogenetic tree. C, Intron-exon structure of MYB genes in the R2R3-MYB-encoding region. D, Subfamily-specific amino acid auxiliary motifs (gray boxes) of land plant R2R3-MYB TFs. The diagrams are not drawn to scale. E, Subfamily VIII R2R3-MYB protein sequences of motifs 31 (left column) and 32 (right column). F, ML phylogeny of proteins with R2R3-MYB domains in five representative species. R1R2R3-MYB TFs and 10 subfamilies of R2R3-MYB TFs are labeled and collapsed into triangles. Ultrafast bootstrap values are associated with the internal branches. The color of the solid circles in A, E, and F indicates the source of the sequence: green, bryophytes; orange, lycophytes; yellow, ferns; purple, gymnosperms; and red, angiosperms.
Figure 2.
Figure 2.
Phylogenetic analysis of proteins with R2R3-MYB domains in glaucophytes, red algae, and green plants. A, ML phylogram of proteins with R2R3-MYB domains in algae and M. polymorpha. The MYB protein CDC5 sequences were used as the outgroup. Ultrafast bootstrap values are associated with the internal branches; values <50 were omitted. Orthologs of land plant R2R3-MYB proteins from subfamilies FLP, II, V, ARP, VI, VII, and VIII are labeled in gray blocks. The key applies to the sequences in A to C. B, Sequences of auxiliary motifs of R2R3-MYB TFs from subfamilies FLP, II, V, ARP, VI, VII, and VIII in land plants and their charophycean orthologs. C, Intron-exon structure of MYB genes from subfamilies FLP, V, ARP, VI, and VIII, as well as their algal orthologs in the R2R3-MYB domain-encoding region. D, The presence or absence of orthologs of land plant R2R3-MYB subfamilies in the plant lineage is indicated by solid or open squares, respectively.
Figure 3.
Figure 3.
Phylogenetic analysis of subfamily VIII R2R3-MYB TFs. A, ML phylogram of R2R3-MYB proteins of subfamily VIII in representative land plants. Clades within subfamily VIII are labeled and collapsed into triangles. Sequences from Zygnematophyceae were used as the outgroup. Ultrafast bootstrap values are associated with the internal branches. B, Schematic and alignment of VIII-A-, VIII-b/B-, and VIII-D-specific auxiliary motifs. Diagrams are not drawn to scale. C, Hypothetical evolutionary model of subfamily VIII TFs before the diversification of extant land plants. Circles represent inferred gene duplication events. Question marks indicate that there is conflict between motif analysis and topology.
Figure 4.
Figure 4.
ML phylograms of representative subfamilies/clades of R2R3-MYB TFs in streptophytes. Phylogenies of subfamily II (A), subfamily III (B), subfamily VI (C), clade A-2 of subfamily VIII (D), and clade B of subfamily VIII (E). The color of the terminal node indicates the source of the sequence, as shown in the inset. Ultrafast bootstrap values are associated with the internal branches; values <50 were omitted. The Greek letter in the colored square indicates the name of the subclade, whereas an X indicates the presence of a within-clade duplication in core eudicots. The presence or absence of subfamily/clade-specific auxiliary motifs of R2R3-MYB TFs is indicated by solid and open squares, respectively, corresponding to the terminal nodes of the phylogenetic tree.
Figure 5.
Figure 5.
Unrooted trees of clades VIII-A-1 (A), VIII-D (B), and VIII-E (C) from representative land plants. Gray-shaded areas represent clades with sequences from multiple gymnosperm and angiosperm species; ultrafast bootstrap values of the clades are indicated in the basal region. The letters and colors of the solid circles indicate the sources of the sequences: green, bryophytes; orange, lycophytes; yellow, ferns; purple, gymnosperms; and red, angiosperms. Green circles with a blue outline indicate sequences of mosses.
Figure 6.
Figure 6.
Summary of the evolutionary history of R2R3-MYB TFs in land plants and their algal orthologs. A, Schematic diagram of the evolution of R2R3-MYB TFs in each subfamily. The schematic representation is dependent on the phylogenetic analyses conducted in this study (Supplemental Figs. S9 and S10). Black lines indicate the phylogeny of green plants based on Wickett et al. (2014), The Angiosperm Phylogeny Group (2016), Puttick et al. (2018), and One Thousand Plant Transcriptomes Initiative (2019). Squares on the black lines indicate the presence of lineage-specific subclades of R2R3-MYB TFs; a rounded square represents an Arabidopsis-specific subclade. A Greek letter in a square indicates the name of the subclade, an X indicates the presence of within-clade duplication in core eudicots, an L indicates that the sequence is likely to be a member of an existing subclade, and a question mark indicates that the evolutionary pattern of the subclade is questionable. A number in the square indicates the number of related subclades in the phylogenetic tree. B, Classification of R2R3-MYB TFs in Arabidopsis according to our analyses. The placement of TFs corresponds with their respective position (squares) in A (to the left). C, Summary of the classification systems of plant R2R3-MYB TFs in previous studies. Rectangles represent the R2R3-MYB subgroup(s) identified in the study and are labeled with the name of the subgroup/branch; strikethrough of the Arabidopsis R2R3-MYB TF name indicates that the TF was not included in the subgroup.
Figure 7.
Figure 7.
Classification of the primary DNA-binding specificities of mouse c-Myb and MYB proteins from Arabidopsis. A, Network graph of the pairwise similarities of DNA-binding specificities of MYB proteins. The nodes represent the DNA-binding specificity of the MYB proteins, and the edges represent pairwise similarities (S) >1.5e−4. Dashed rings indicate clusters of binding specificities. B, DNA-binding specificities of MYB TFs clustered in the UPGMA tree. Notably, the UPGMA tree is rooted at the midpoint, and the topology does not indicate the evolutionary history of the DNA-binding specificities. The numbers indicate the position of a base in the DNA-binding profile (Solano et al., 1997). The color of the nodes in A and B indicates the source of the MYB protein.

References

    1. Aberer AJ, Krompass D, Stamatakis A(2013) Pruning rogue taxa improves phylogenetic accuracy: An efficient algorithm and webservice. Syst Biol 62: 162–166 - PMC - PubMed
    1. Albert NW, Thrimawithana AH, McGhie TK, Clayton WA, Deroles SC, Schwinn KE, Bowman JL, Jordan BR, Davies KM(2018) Genetic analysis of the liverwort Marchantia polymorpha reveals that R2R3MYB activation of flavonoid production in response to abiotic stress is an ancient character in land plants. New Phytol 218: 554–566 - PubMed
    1. Allan AC, Espley RV(2018) MYBs drive novel consumer traits in fruits and vegetables. Trends Plant Sci 23: 693–705 - PubMed
    1. Altschul SF, Madden TL, Schäffer AA, Zhang J, Zhang Z, Miller W, Lipman DJ(1997) Gapped BLAST and PSI-BLAST: A new generation of protein database search programs. Nucleic Acids Res 25: 3389–3402 - PMC - PubMed
    1. Amborella Genome Project (2013) The Amborella genome and the evolution of flowering plants. Science 342: 1241089. - PubMed

Publication types

MeSH terms

Substances