

Recent trends in vision impairment certifications in England and Wales
- PMID: 32291405
- PMCID: PMC7314787
- DOI: 10.1038/s41433-020-0864-6
Recent trends in vision impairment certifications in England and Wales
Abstract
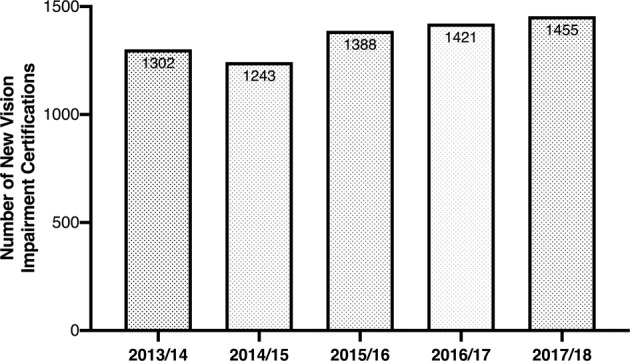
Background: The Certificate of Visual Impairment (CVI) provides essential data for preventable sight loss indicators as part of the Public Health Outcomes Framework (PHOF) published annually by the Department of Health. Trends in CVI certification rates can provide information on the effectiveness of current services and treatments and may be used to guide allocation of resources, and is the only such indicator within ophthalmology. This study aimed to compare recent trends in new vision impairment certifications in 2017/18 against prior baseline data in England and document trends in new certifications in Wales.
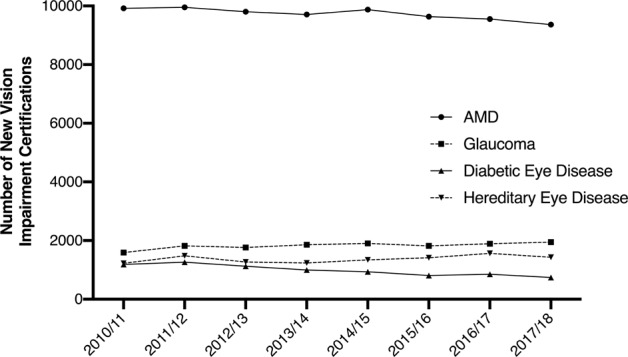
Methods: PHOF data from 2010/11 and 2017/18 were examined with respect to preventable sight loss indicators: age-related macular degeneration (AMD) (Indicator E12a), glaucoma (Indicator E12b), diabetic eye disease (Indicator E12c) as well as the total numbers of certifications (Indicator E12d).
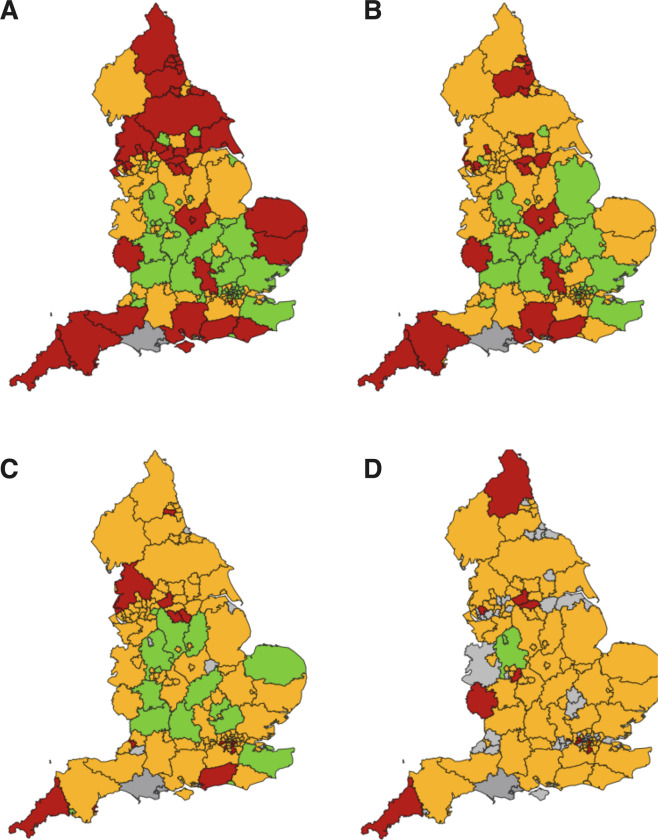
Results: In 2017/18, the rate of new CVI certifications was 41 per 100,000 population which has reduced from 43/100,000 in 2010/11 in England. Certifications for AMD reduced from 132/100,000 in 2010/11 to 107/100,000 in 2017-18. Certifications for glaucoma have remained stable at 13/100,000 in 2017/8. Certifications for diabetic eye disease have declined from 4/100,000 in 2010/11 to 3/ 100,000 in 2017/18. The number of vision impaired individuals that each Clinical Commissioning Group (CCG) has to support varies from 8 to 82 per 100,000 population.
Conclusions: There has been a significant decrease in the rate of all CVI certifications particularly from AMD and diabetic retinopathy. However, maintaining this will require changes in the way care is delivered as the elderly population, which is at greatest risk of preventable sight loss, is projected to increase by 50% over the next 20 years. Inherited retinal diseases are now the leading cause of sight loss in the working age population. CVI data demonstrate the need for CCGs to tailor their investment in ophthalmic services to the needs of their specific patient populations. It is important that all ophthalmologists continue to provide accurate CVI data in order to help support the future equitable allocation of adequate resources to reduce avoidable vision loss.
Conflict of interest statement
The authors declare that they have no conflict of interest.
Figures

References
-
- Sorsby A. The causes of blindness in England 1948–50. London, U.K.: HMSO; 1953.
-
- Sorsby A. The incidence and causes of blindness in England and Wales 1948–62. Reports of public health and medical subjects 114. London, U.K.: HMSO; 1966. - PubMed
-
- Quality statement 6: Certificate of vision impairment: National Institute for Health and Care Excellence; 2019. https://www.nice.org.uk/guidance/qs180/chapter/Quality-statement-6-Certi.... Accessed 13 Apr 2020.
-
- Public Health Outcomes Framework. London, U.K.: Public Health England; 2013.
Publication types
MeSH terms
LinkOut - more resources
Full Text Sources
Medical
