. 2020 May;39(21):4271-4285.
doi: 10.1038/s41388-020-1289-1. Epub 2020 Apr 14.

TGF-β1 secreted by pancreatic stellate cells promotes stemness and tumourigenicity in pancreatic cancer cells through L1CAM downregulation

Affiliations

TGF-β1 secreted by pancreatic stellate cells promotes stemness and tumourigenicity in pancreatic cancer cells through L1CAM downregulation

Donatella Delle Cave et al. Oncogene. 2020 May.

Abstract

Pancreatic stellate cells (PSCs) secrete high levels of transforming growth factor-β1 (TGF-β1) that contributes to the development of pancreatic ductal adenocarcinoma (PDAC). TGF-β1 modulates the expression of L1 cell adhesion molecule (L1CAM), but its role in tumour progression still remains controversial. To clarify L1 function in PDAC and cellular phenotypes, we performed L1CAM cell sorting, silencing and overexpression in several primary pancreatic cancer cells. PSCs silenced for TGF-β1 were used for crosstalk experiments. We found that TGF-β1 secreted by PSCs negatively regulates L1CAM expression, through canonical TGF-β-Smad2/3 signalling, leading to a more aggressive PDAC phenotype. Cells with reduced expression of L1CAM harboured enhanced stemness potential and tumourigenicity. Inactivation of TGF-β1 signalling in PSCs strongly reduced the aggressiveness of PDAC cells. Our data provide functional proof and mechanistic insights for the tumour-suppressive function of L1CAM via reducing stemness. Rescuing L1CAM expression in cancer cells through targeting of TGF-β1 reverses stemness and bears the potential to improve the still miserable prognosis of PDAC patients.


Conflict of interest statement

The authors declare that they have no conflict of interest.

Figures

Fig. 1
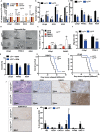
Fig. 1. Increased L1CAM expression is associated with favourable outcome in PDAC.
a Boxplots showing the differential expression of L1 in PDAC samples versus normal tissue (NP) in the indicated series of transcriptomic data. *p < 0.05; ***p < 0.0005 compared with NP. b Immunohistochemistry for L1CAM (brown) in tissue sections from normal pancreas (P) and patients with PDAC at G1, G2 and G3 grade. c H-score for L1CAM expression. d qPCR analysis of L1 and CSCs genes in adherent cells versus spheres. Data are normalised to GAPDH expression and are presented as fold change (FC) in gene expression relative to adherent cells. *p < 0.05; **p < 0.005; ***p < 0.0005 compared to Adh. n ≥ 6. e Western blot analysis for L1 in adherent cells versus spheres. Parallel β-ACTIN immunoblotting was performed and signal quantification was calculated by densitometric analysis. f Flow cytometry quantification for L1 in adherent cells compared to spheres. All cytometry gates were established based on isotype controls. *p < 0.05; **p < 0.005; ***p < 0.0005 compared with Adh. n ≥ 4. g Representative immunofluorescence images for L1 (red) and nuclei (blue, DAPI) of adherent cells and spheres. h Representative flow cytometry for L1 in subcutaneous tumours derived from L3.6pl injected cells treated with vehicle (H2O) or gemcitabine. All cytometry gates were established based on isotype controls. n ≥ 4. I Flow cytometry quantification for L1 and CD133 in subcutaneous tumours derived from L3.6pl injected cells treated with vehicle (H2O) or gemcitabine.
Fig. 2
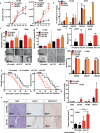
Fig. 2. L1CAM expression inversely correlates with CSC content and function.
a qPCR analysis for L1 and CSCs genes in L1 sorted cells. Data are normalised to GAPDH and are presented as fold change in gene expression relative to L1high cells. *p < 0.05; **p < 0.005; ***p < 0.0005. n ≥ 6. b Sphere formation capacity of L1 sorted cells. 200 cells per well. **p < 0.005 compared with L1low. n ≥ 6. c Formation of organoid-like structures of L1 sorted cells. **p < 0.005 compared with L1low. n ≥ 6. d Representative images of organoid-like structures derived from L1 sorted cells. e qPCR analysis for EMT genes in organoid-like structures derived from L1 sorted cells. Data are normalised to GAPDH and are presented as fold change in gene expression relative to L1high cells. *p < 0.05; **p < 0.005; ***p < 0.0005. n ≥ 6. f Migratory potential of L1 sorted cells. ***p < 0.0005 compared to L1low. n ≥ 3. g Growth capacity of L1 sorted cells in presence of 100 μM of Gemcitabine (GEM). **p < 0.005 compared with L1low. n ≥ 6. hi Kaplan–Meier curve of L1 sorted cells subcutaneously xenografted into athymic mice. Long-rank (Mantel–Cox) test ***p < 0.0005 compared with L1low. n = 8. j Representative histological sections of xenografts derived from L1 sorted cells. Tumour sections were (immuno)stained for Haematoxylin & Eosin (H&E), CD31, CALD1, E-CADHERIN (CDH1), KERATIN 17. S stroma, T tumour. k Quantification of fibrotic area on H&E stained sections and of CD31, CALD1, CDH1, F4/80 and KERATIN 17 detected by IHC. *p < 0.05, compared with L1low.
Fig. 3
Fig. 3. Knockdown of L1CAM promotes stemness in PDAC cells.
a Cell expansion curves for control and L1 knockdown cells. Cell numbers were determined daily by haemocytometer for 7 days. Each data point represents the mean ± SD of three independent experiments. **p < 0.005; ***p < 0.0005 compared to sh empty. n ≥ 6. b qPCR analysis for L1 and CSCs of the control and L1 knockdown cells. Data are normalised to GAPDH expression and are presented as fold change in gene expression relative to sh empty. *p < 0.05; **p < 0.005; ***p < 0.0005. n ≥ 6. c Sphere formation capacity of control and L1 knockdown cells. *p < 0.05 compared with sh empty. n ≥ 6. d Formation of organoid-like structures of control and L1 knockdown cells. *p < 0.05; **p < 0.005 compared with sh empty. n ≥ 6. e Migratory potential of control and L1 knockdown cells. **p < 0.005 compared with sh empty. n ≥ 6. f Growth capacity of control and L1 knockdown cells in presence of 100–150–200 μM of Gemcitabine (GEM). ***p < 0.0005 compared with sh empty. n ≥ 6. g Kaplan–Meier curve of control (sh scramble and sh empty) and shL1 cells subcutaneously xenografted into athymic mice. Long-rank (Mantel–Cox) test *p < 0.05 and ***p < 0.0005 compared with sh control. n = 8. h Representative histologic sections of xenografts derived from sh empty and shL1#1. The tumour sections were (immuno)stained for H&E, CALD1 and KERATIN 17. i Quantification of CD31, CALD1, F4/80 and KERATIN 17 detected by IHC. *p < 0.05; ***p < 0.0005 compared with sh empty. j Tumour volume of L3.6pl cells sh empty and shL1#1 subcutaneously injected into athymic mice and treated with vehicle (H2O) or 100 mg/Kg of Gemcitabine. *p < 0.05; ***p < 0.0005. n ≥ 6.
Fig. 4
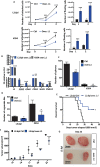
Fig. 4. Ectopic overexpression of L1CAM inhibits stemness in PDAC cells.
a Cell expansion for control and L1 overexpressing cells. Cell viability was evaluated by trypan blue exclusion. ***p < 0.0005 compared with Ctrl. n ≥ 6. b qPCR analysis for L1, CSCs and EMT genes in control and L1 overexpressing cells. Data are normalised to GAPDH expression and presented as fold change in gene expression relative to control cells.**p < 0.005; ***p < 0.0005. n ≥ 6. c Sphere formation capacity of control and L1 overexpressing cells. 500 cells per well. **p < 0.005 compared with Ctrl. n ≥ 6. d Formation of organoid-like structures of control and L1 overexpressing cells. *p < 0.05 compared with Ctrl. n ≥ 6. e Kaplan–Meier curve of control (Ctrl) and L1 overexpressing cells subcutaneously xenografted in athymic mice. Long-rank (Mantel–Cox) test *p < 0.05 compared with Ctrl. n = 8. f Tumour volume of Ctrl and L1 overexpressing cells subcutaneously xenografted. Data are shown as mean (points) ± s.d. (whiskers). **p < 0.005; ***p < 0.0005 compared with Ctrl. g Representative images at day 22 of tumours derived from control and L1 overexpressing cells.
Fig. 5
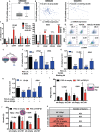
Fig. 5. PSC-derived TGF-β1 negatively regulates L1CAM expression.
a Boxplots showing the differential expression of TGF-β1 in PDAC samples versus normal tissue (NP) in the indicated series of transcriptomic data. ***p < 0.0005 compared with NP. b Inverse correlation between TGF-β1 and L1 in PDAC samples in the indicated series of transcriptomic data. The p value is based on Pearson Correlation. c qPCR analysis of L1 and CSC genes in PDAC cells untreated or treated with 10 ng/mL of recombinant TGF-β1 and 10 μM of A-83-01. Data are normalised to GAPDH expression and are presented as fold change in gene expression relative to Ctrl. *p < 0.05, ***p < 0.0005. n ≥ 6. d Flow cytometry for L1 in L3.6pl and #354 cells treated with 10 ng/mL of recombinant TGF-β1 and 10 μM of A-83-01 for 7 days. All cytometry gates were established based on isotype controls. n ≥ 3. e Schematic representation of the experimental design. f qPCR analysis of L1 gene in PDAC cells grown in the presence of PSC conditioned medium and A-83-01. Data are normalised to GAPDH expression.**p < 0.005; ***p < 0.0005 compared with Ctrl. n ≥ 6. g qPCR analysis of L1 gene in PDAC cells grown in the presence of PSC conditioned medium and TGF-β1 blocking antibody. Data are normalised to GAPDH expression.**p < 0.005; ***p < 0.0005 compared with Ctrl. n ≥ 6. h qPCR analysis of L1 gene in PDAC cells grown in the presence of control or TGF-β1 knockdown PSC conditioned media. Data are normalised to GAPDH expression and are presented as fold change in gene expression relative to control. **p < 0.005; ***p < 0.0005 compared with Ctrl. n ≥ 6. i Migratory potential of PDAC cells grown in the presence of control or TGF-β1 knockdown PSC cells. *p < 0.05 compared with PSC sh empty, #p < 0.05 compared with PSC sh empty. n ≥ 6. j Expansion capacity of PDAC cells co-cultured with control or TGF-β1 knockdown PSC cells in the presence of 100 μM of GEM. *p < 0.05; **p < 0.005 compared with PSC sh empty. n ≥ 6. k Tumours generated from subcutaneous single injection of L3.6pl and PSC or co-injection of L3.6pl with PSC control or TGF-β1 knockdown. n = 8.

References

    1. Foucher ED, Ghigo C, Chouaib S, Galon J, Iovanna J, Olive D. Pancreatic ductal adenocarcinoma: a strong imbalance of good and bad immunological cops in the tumor microenvironment. Front Immunol. 2018;9:1044. - PMC - PubMed
    1. Lonardo E, Hermann PC, Mueller MT, Huber S, Balic A, Miranda-Lorenzo I, et al. Nodal/activin signaling drives self-renewal and tumorigenicity of pancreatic cancer stem cells and provides a target for combined drug therapy. Cell Stem Cell. 2011;9:433–46. - PubMed
    1. Miranda-Lorenzo I, Dorado J, Lonardo E, Alcala S, Serrano AG, Clausell-Tormos J, et al. Intracellular autofluorescence: a biomarker for epithelial cancer stem cells. Nat Methods. 2014;11:1161–9. - PubMed
    1. Jones S, Zhang X, Parsons DW, Lin JC, Leary RJ, Angenendt P, et al. Core signaling pathways in human pancreatic cancers revealed by global genomic analyses. Science. 2008;321:1801–6. - PMC - PubMed
    1. Javle M, Li Y, Tan D, Dong X, Chang P, Kar S, et al. Biomarkers of TGF-beta signaling pathway and prognosis of pancreatic cancer. PloS ONE. 2014;9:e85942. - PMC - PubMed

Publication types

MeSH terms