. 2020 Jun;57(6):2639-2653.
doi: 10.1007/s12035-020-01899-1. Epub 2020 Apr 14.

A Comprehensive Transcriptome Analysis Identifies FXN and BDNF as Novel Targets of miRNAs in Friedreich's Ataxia Patients

Affiliations

A Comprehensive Transcriptome Analysis Identifies FXN and BDNF as Novel Targets of miRNAs in Friedreich's Ataxia Patients

Julia O Misiorek et al. Mol Neurobiol. 2020 Jun.

Abstract

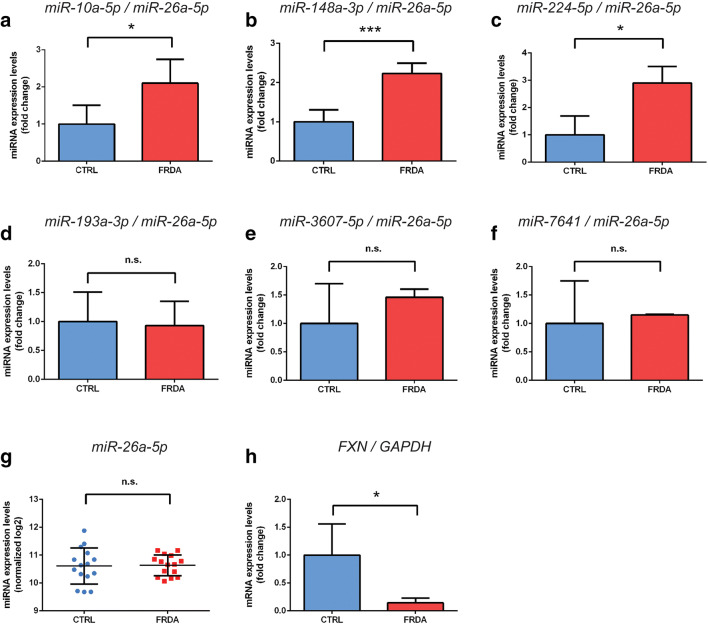
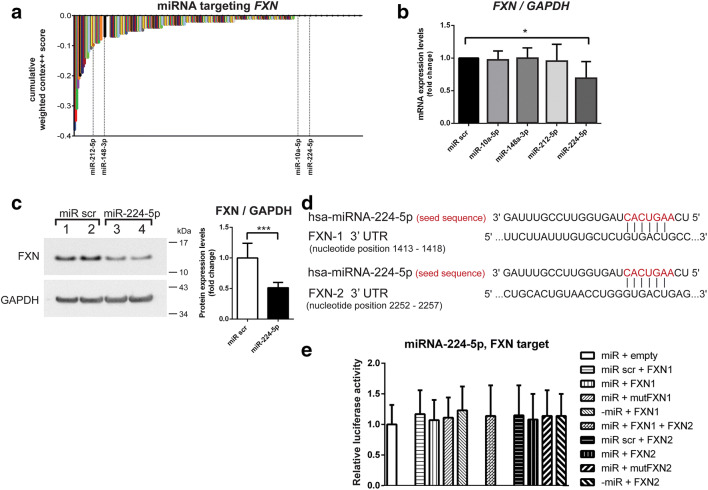
Friedreich's ataxia (FRDA) is a genetic neurodegenerative disease that is caused by guanine-adenine-adenine (GAA) nucleotide repeat expansions in the first intron of the frataxin (FXN) gene. Although present in the intron, this mutation leads to a substantial decrease in protein expression. Currently, no effective treatment is available for FRDA, and, in addition to FXN, other targets with therapeutic potential are continuously sought. As miRNAs can regulate the expression of a broad spectrum of genes, are used as biomarkers, and can serve as therapeutic tools, we decided to identify and characterize differentially expressed miRNAs and their targets in FRDA cells compared to unaffected control (CTRL) cells. In this study, we performed an integrated miRNAseq and RNAseq analysis using the same cohort of primary FRDA and CTRL cells. The results of the transcriptome studies were supported by bioinformatic analyses and validated by qRT-PCR. miRNA interactions with target genes were assessed by luciferase assays, qRT-PCR, and immunoblotting. In silico analysis identified the FXN transcript as a target of five miRNAs upregulated in FRDA cells. Further studies confirmed that miRNA-224-5p indeed targets FXN, resulting in decreases in mRNA and protein levels. We also validated the ability of miRNA-10a-5p to bind and regulate the levels of brain-derived neurotrophic factor (BDNF), an important modulator of neuronal growth. We observed a significant decrease in the levels of miRNA-10a-5p and increase in the levels of BDNF upon correction of FRDA cells via zinc-finger nuclease (ZFN)-mediated excision of expanded GAA repeats. Our comprehensive transcriptome analyses identified miRNA-224-5p and miRNA-10a-5p as negative regulators of the FXN and BDNF expression, respectively. These results emphasize not only the importance of miRNAs in the pathogenesis of FRDA but also their potential as therapeutic targets for this disease.

Keywords: Brain-derived neurotrophic factor (BDNF); Frataxin (FXN); Friedreich’s ataxia (FRDA); RNAseq; miRNAseq; microRNA-10a-5p; microRNA-224-5p.


Conflict of interest statement

The authors declare that they have no competing interests.

Figures

Fig. 1
Fig. 1
Quantitative miRNA profiling. a A heatmap was generated based on the normalized DESeq counts and shows the miRNA expression levels from CTRL and FRDA patient fibroblasts (each group n = 15). miRNAs were selected based on statistically significant (*P ≤ 0.05) log2-fold changes between the groups. Expression levels are indicated by colored bars from purple (low expression) to green (high expression). b Scatter plot illustrating the fold change in miRNA expression between the CTRL and FRDA patient groups as log2-transformed data. Differentially expressed miRNAs in FRDA fibroblasts are shown as red dots. The gray vertical line indicates a cutoff of separating the miRNAs with higher expression levels (log2baseMean > 5.0) from those with lower expression levels (log2baseMean < 5.0). Based on this distinction, a pool of highly expressed miRNAs was selected for further analysis. Boxes designate miRNAs that, according to the TargetScan 7.2 database, are predicted to target the FXN gene
Fig. 2
Fig. 2
Validation of the miRNA sequencing results and determination of FXN levels by qRT-PCR. ac The expression levels of miRNA-10a-5p, miRNA-148a-3p, and miRNA-224-5p were upregulated in the FRDA compared to CTRL fibroblasts. df The expression levels of miRNA-193a-3p, miRNA-3607-5p, and miRNA-7641 were not changed in the FRDA compared to CTRL fibroblasts. miRNA-212-5p was not detected by qRT-PCR (not shown). g miRNA expression levels were normalized to miRNA-26a-5p, which is uniformly expressed in both cohorts. Log2 values for each sample are presented as blue (CTRL) and red (FRDA) dots. Horizontal lines indicate a mean value for each group. h Decreased expression level of FXN in FRDA fibroblasts. Comparisons were performed using unpaired Student’s t tests. *P ≤ 0.05, ***P ≤ 0.001, n.s. non-significant. Bars present the normalized average fold change compared to the CTRL fibroblasts (5 cell lines/group) with the standard deviation (SD)
Fig. 3
Fig. 3
Regulation of FXN expression by miRNA-10a-5p, miRNA-148a-3p, miRNA-212-5p, and miRNA-224-5p. a The waterfall chart presents the miRNAs targeting the FXN gene positioned by the increased cumulative weighted context++ from the TargetScan 7.2 database. The differentially expressed miRNAs in FRDA fibroblasts are indicated on the graph with dashed lines. b Expression of FXN mRNA in HeLa cells transfected with FXN targeting miRNAs: miRNA-10a-5p, miRNA-148a-3p, miRNA-212-5p, and miRNA-224-5p, as determined by qRT-PCR. miR scr represents the C. elegans miRNA cel-miR-239b used as a negative control. c Analysis of FXN protein level using immunoblotting after transfection of HeLa cells with miRNA-224-5p. Quantitation of immunoblotting results is presented in the right panel. Data were collected from three independent experiments. d Visualization of human miRNA-224-5p binding to two sites of the FXN 3′UTR. The seed sequence of the miRNA is indicated in red, and the exact locations of the putative target sequences in the FXN 3′UTR are indicated (based on NM_000144.4, nucleotide positions: FXN1 1413–1418 and FXN2 2252–2257). e Two fragments of the FXN 3′UTR (FXN1 and FXN2) harboring putative target sequences for miRNA-224-5p were cloned into separate reporter vectors. Constructs with mutated seed sequences of the targets and non-targeting miRNA were used as negative controls. HeLa cells were co-transfected with generated constructs (50 ng) and synthetic miRNAs (100 nM). Luciferase activity was measured 48 h after transfection. Firefly luciferase activity was normalized against Renilla luciferase activity. All bars present the relative luciferase activity with the standard deviation (SD). Normalization was performed for miRNA-224-5p co-transfected with a plasmid lacking a target sequence (“miR + empty”). Statistical significance was determined using Student’s t test *P ≤ 0.05, ***P ≤ 0.001
Fig. 4
Fig. 4
Correlation between the expression of miRNAs targeting the FXN gene, and FXN expression levels. ad A negative Spearman’s correlation was calculated for the miRNA-10a-5p, miRNA-148a-3p, miRNA-212-5p, miRNA-224-5p, and FXN expression levels. The regression line between the normalized expression of the miRNA and the FXN gene was calculated with least-squares regression for two sets of measurements. CTRL samples from non-disease carriers are shown as blue dots, and FRDA patient samples are shown as red dots. Spearman’s rho and P values are indicated
Fig. 5
Fig. 5
miRNA-10a-5p overexpression in FRDA targets BDNF. a Identification of miRNA-10a-5p targets. Venn diagram illustrates an overlap between mRNAs that were differentially expressed in FRDA fibroblasts (yellow—downregulated, blue—upregulated) and TargetScan 7.1 predicted targets of miRNA-10a-5p (red). b A heatmap presents the expression of 82 genes (33 downregulated and 49 upregulated, *P ≤ 0.05 in unpaired Student’s t test) predicted to be targets of miRNA-10a-5p in FRDA (n = 18) and CTRL (n = 17) fibroblasts. The expression level is represented by the colored bars from purple (low expression) to green (high expression). cBDNF expression is decreased in FRDA cells. Validation of RNAseq data by qRT-PCR. Bars represent the fold change between the FRDA and CTRL fibroblasts (5 cell lines/group); the results were normalized to GAPDH expression; error bars represent the standard deviation of the mean (SD). d Negative correlation between the expression of miRNA-10a-5p and BDNF in FRDA and CTRL fibroblasts. The regression line between the normalized expression level of the miRNA and BDNF mRNA was calculated with least-squares regression for two sets of measurements. CTRL samples are shown as blue dots, and FRDA samples are shown as red dots
Fig. 6
Fig. 6
Excision of the expanded GAA repeats decreases miRNA-10a-5p expression and elevates BDNF levels. a A fragment of the BDNF 3′UTR harboring the miRNA-10a-5p target sequence was cloned into a luciferase reporter vector (based on NM_001143805.1, nucleotide positions 966–972). b Constructs containing the BDNF target sequence and the mutated BDNF target sequence (Suppl. Tab. 1) as well as the empty luciferase reporter vector were co-transfected into HEK293 cells with the appropriate miRNA-10a-5p, unspecific control (miR scr), and miRNA-10a-5p inhibitor as indicated in the graph. Luciferase activity was measured 48 h after transfection. Firefly luciferase activity was normalized against Renilla luciferase activity. All bars present relative luciferase activity with the standard deviation (SD). Statistical significance was calculated using Student’s t test *P ≤ 0.05. c Schematic illustrating the strategy of the GAA repeat excision by specific ZFNs (red triangles). Homozygous editing of FRDA fibroblasts was achieved as described in [33]. Homozygous excision of the expanded GAAs increased FXN mRNA expression (d), decreased miRNA-10a-5p levels (e), and consequently upregulated BDNF transcript expression (f). The results of three independent analyses are shown; *P ≤ 0.05, ***P ≤ 0.001. Comparisons were performed using unpaired Student’s t tests. *P ≤ 0.05, ***P ≤ 0.001, n.s. non-significant. Bars present the normalized average fold change compared to CTRL fibroblasts (5 cell lines/group) with standard deviation (SD)

References

    1. Cook A, Giunti P. Friedreich’s ataxia: clinical features, pathogenesis and management. Br Med Bull. 2017;124(1):19–30. - PMC - PubMed
    1. Groh Matthias, Lufino Michele M. P., Wade-Martins Richard, Gromak Natalia. R-loops Associated with Triplet Repeat Expansions Promote Gene Silencing in Friedreich Ataxia and Fragile X Syndrome. PLoS Genetics. 2014;10(5):e1004318. - PMC - PubMed
    1. Marmolino D. Friedreich’s ataxia: past, present and future. Brain Res Rev. 2011;67(1–2):311–330. - PubMed
    1. Delatycki MB, Bidichandani SI. Friedreich ataxia- pathogenesis and implications for therapies. Neurobiol Dis. 2019;132:104606. - PubMed
    1. Li Y, Lu Y, Polak U, Lin K, Shen J, Farmer J, Seyer L, Bhalla AD, Rozwadowska N, Lynch DR, Butler JS, Napierala M. Expanded GAA repeats impede transcription elongation through the FXN gene and induce transcriptional silencing that is restricted to the FXN locus. Hum Mol Genet. 2015;24(24):6932–6943. - PMC - PubMed

MeSH terms