. 2020 Mar 27:12:11.
doi: 10.3389/fnsyn.2020.00011. eCollection 2020.

A Practical Guide to Using CV Analysis for Determining the Locus of Synaptic Plasticity

Affiliations

A Practical Guide to Using CV Analysis for Determining the Locus of Synaptic Plasticity

Jennifer A Brock et al. Front Synaptic Neurosci. .

Abstract

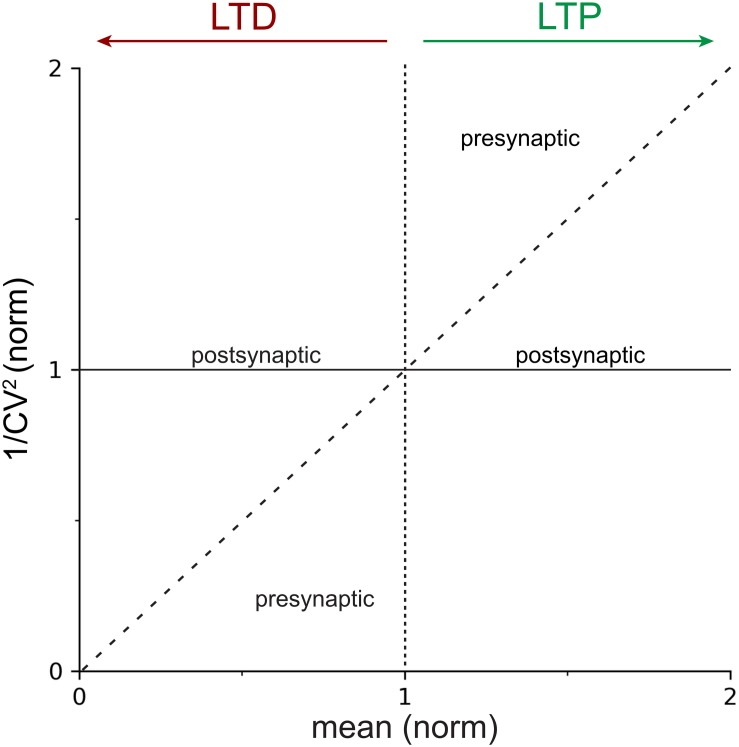
Long-term synaptic plasticity is widely believed to underlie learning and memory in the brain. Whether plasticity is primarily expressed pre- or postsynaptically has been the subject of considerable debate for many decades. More recently, it is generally agreed that the locus of plasticity depends on a number of factors, such as developmental stage, induction protocol, and synapse type. Since presynaptic expression alters not just the gain but also the short-term dynamics of a synapse, whereas postsynaptic expression only modifies the gain, the locus has fundamental implications for circuits dynamics and computations in the brain. It therefore remains crucial for our understanding of neuronal circuits to know the locus of expression of long-term plasticity. One classical method for elucidating whether plasticity is pre- or postsynaptically expressed is based on analysis of the coefficient of variation (CV), which serves as a measure of noise levels of synaptic neurotransmission. Here, we provide a practical guide to using CV analysis for the purposes of exploring the locus of expression of long-term plasticity, primarily aimed at beginners in the field. We provide relatively simple intuitive background to an otherwise theoretically complex approach as well as simple mathematical derivations for key parametric relationships. We list important pitfalls of the method, accompanied by accessible computer simulations to better illustrate the problems (downloadable from GitHub), and we provide straightforward solutions for these issues.

Keywords: electrophysiology; long-term depression; long-term plasticity; long-term potentiation; monosynaptic connections; paired recordings; spike-timing-dependent plasticity.


Figures

FIGURE 1
FIGURE 1
Locus of expression areas in the CV analysis plot. Normalized 1/CV2, a proxy for the probability of release p (Box 2), is plotted against the normalized mean μ(norm), which is a measure of synaptic strength. The solid horizontal line at y=1 indicates 100% 1/CV2(norm), or no change in p. The dotted vertical line at x=1 delineates LTP (to the right) from LTD (to the left). The dashed diagonal line with slope Δyx = 1 demarcates presynaptic from postsynaptic expression of plasticity (Box 2). In other words, data that falls on or close to the continuous horizontal line should be considered to be postsynaptically expressed, whereas data that is above the dashed diagonal for LTP, or below it for LTD, should be considered presynaptically expressed. Mixtures of pre- and postsynaptic expression is also possible (Sjöström et al., 2007), which results in data points scattered between the dashed diagonal and the continuous horizontal lines.
FIGURE 2
FIGURE 2
Sample LTP and LTD experiments show presynaptic expression. (A) Sample spike-timing-dependent plasticity experiment with Δt = 10ms temporal difference between pre- and postsynaptic spike trains evoked at 50 Hz (Sjöström et al., 2001) for which LTP was evoked (EPSP before, dark blue: 0.58 ± 0.03 mV versus after, light blue: 0.92 ± 0.02 mV, p < 0.001). Inset: average EPSP traces showed a change in paired-pulse ratio suggesting presynaptic expression (Sjöström et al., 2007). Scale bars: 0.5 mV, 20 ms. Bottom: membrane potential and input resistance of pre- and postsynaptic PCs were stable (red and blue, respectively). Right: flattened 2-photon imaging stack of Alexa-594-filled cells verified PC identity, with pre- and postsynaptic PCs denoted by 1 and 2, respectively. (B) Sample spike-timing-dependent plasticity experiment with Δt = −25ms temporal difference between pre- and postsynaptic spike trains evoked at 20 Hz (Sjöström et al., 2001, 2003) for which LTD was elicited (before: 2.0 ± 0.04 mV versus after: 1.0 ± 0.02 mV, p < 0.001. Inset: change in paired-pulse ratio suggested presynaptic expression (Sjöström et al., 2003, 2007). Scale bars: 0.5 mV, 20 ms. Bottom: membrane potential and input resistance of pre- and postsynaptic PCs were stable (red and blue, respectively). Right: pre- and postsynaptic PCs are indicated by 1 and 2, respectively. (C) Coefficient of variation analysis of LTP (right-side-up triangle) and LTD experiments (upside-down triangle) in (A,B) both indicated a presynaptic locus of expression, in keeping with prior findings (Markram and Tsodyks, 1996; Sjöström et al., 2003, 2007).
FIGURE 3
FIGURE 3
Neocortical LTD in L5 PCs is presynaptically expressed. (A) LTD expression at 20 Hz with Δt = −25ms like in Figure 2B was robust across paired recordings, while no-induction controls were stable (LTD, blue triangles; 65 ± 5%, n = 9 versus control, gray circles; 97 ± 2%, n = 8, p < 0.001). (B) Coefficient of variation analysis consistently suggested a presynaptic locus of LTD expression, as all paired recordings gave rise to data points below the diagonal (angle φ = 16° ± 2°, n = 9, p < 0.001; see Figure 1).
FIGURE 4
FIGURE 4
A single outlier response may corrupt CV analysis. (A) Sample Monte-Carlo simulation of an individual presynaptically expressed LTD experiment in which a single EPSP was shifted by 3.2 mV (z-score: 8.2) to produce a striking outlier (red dots). To enable comparison with experimental data (Figures 2, 3), the number of EPSPs, interstimulus intervals, background noise levels, amount of LTD, initial EPSP amplitude, et cetera were set to representative values (see section “Materials and Equipment”). (B) With a single outlier in the baseline period (z-score 8.2 as in A), CV analysis of LTD was on average biased to erroneously indicate post-instead of presynaptic expression (arrow). In the case of LTP, CV analysis would instead be biased toward presynaptic expression (not shown, but possible to simulate in downloadable code, see section “Materials and Equipment”), because the outlier would still artificially elevate the y-axis coordinate, just as for LTD. However, if the outlier is in the post-induction period, the bias is in the opposite direction. (C) As in (A), 150 individual simulations (gray circles) were systematically repeated for single outliers of increasing z-score values (0, 4.1, and 8.2 shown in Ci–iii). The increasing outlier values systematically biased outcome toward a postsynaptic interpretation (summarized in B). (D) Sample LTD experiment (Di, Δt = −25ms and 20 Hz as in Figures 2, 3) for which a spurious presynaptic spike (arrow, Dii, top red trace) resulted in undesirable short-term depression of subsequent EPSP (* in Dii, compare top to bottom blue sample traces), leading to an outlier EPSP in the time course (* in Di). (E) By including the outlier (* in Di,ii), CV analysis was biased toward postsynaptic interpretation (arrow). Here, this pitfall was avoided by removing the outlier (arrow starting point).
FIGURE 5
FIGURE 5
Baseline trends may corrupt CV analysis. (A) Sample Monte-Carlo simulation of an individual presynaptically expressed LTD experiment that was suffering from a strong baseline run-up (115.2 μV/min, see section “Materials and Equipment”). (B) With baseline trend (115.2 μV/min as in A), CV analysis was on average biased to erroneously indicate post-instead of presynaptic expression (arrow). In the case of LTP, CV analysis would instead be biased toward presynaptic expression (not shown, but possible to simulate in downloadable code, see section “Materials and Equipment”), because the baseline trend artificially elevates the y-axis coordinate. However, if the baseline trend is in the post-induction period, the bias is in the opposite direction. (C) As in (A), 150 individual simulations (gray circles) were systematically repeated for different baseline trends (0, 57.6, and 115.2 μV/min shown in Ci–iii). The increasing baseline trend systematically biased outcome toward a postsynaptic interpretation (summarized in B). (D) Sample LTD experiment (Di, Δt = −25ms and 20 Hz as in Figures 2, 3) at PC1 → PC2 connection (Dii) that suffered from an increasing baseline trend, coincident with a significant change in postsynaptic input resistance (bottom: blue circles, asterisk). Presynaptic input resistance and membrane potential are indicated in red. (E) By including the entire baseline period, CV analysis was biased toward postsynaptic interpretation (arrow). Here, this pitfall was avoided by removing the unstable baseline period, which was further supported by a significant change in input resistance (* in Di).

References

    1. Abbott L. F., Regehr W. G. (2004). Synaptic computation. Nature 431 796–803. - PubMed
    1. Abbott L. F., Varela J. A., Sen K., Nelson S. B. (1997). Synaptic depression and cortical gain control. Science 275 220–224. - PubMed
    1. Abdi H. (2010). “Coefficient of variation,” in Encyclopedia of Research Design, 1 Edn, ed. Salkind N. J. (Thousand Oaks, CA: SAGE Publications, Inc; ).
    1. Abrahamsson T., Chou C. Y. C., Li S. Y., Mancino A., Costa R. P., Brock J. A., et al. (2017). Differential regulation of evoked and spontaneous release by presynaptic NMDA receptors. Neuron 96 839.e–855.e. 10.1016/j.neuron.2017.09.030 - DOI - PubMed
    1. Abrahamsson T., Lalanne T., Watt A. J., Sjöström P. J. (2016). In vitro investigation of synaptic plasticity. Cold Spring Harb. Protoc. 2016:pdb.top087262. 10.1101/pdb.top087262 - DOI - PMC - PubMed

LinkOut - more resources