. 2020 Mar 27:11:388.
doi: 10.3389/fpsyg.2020.00388. eCollection 2020.

The Attention Network Test Database: ADHD and Cross-Cultural Applications

Affiliations

The Attention Network Test Database: ADHD and Cross-Cultural Applications

Swasti Arora et al. Front Psychol. .

Abstract

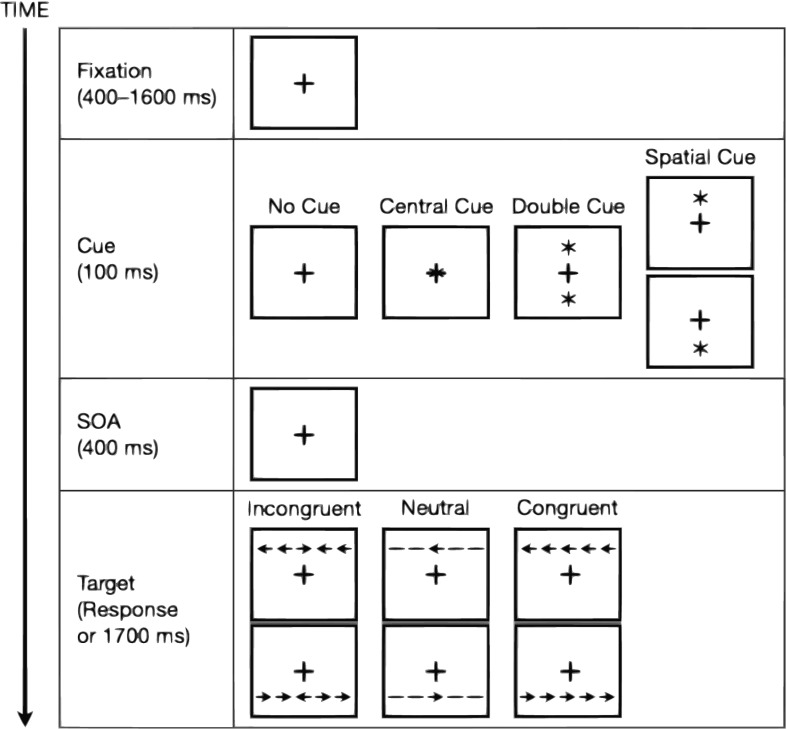
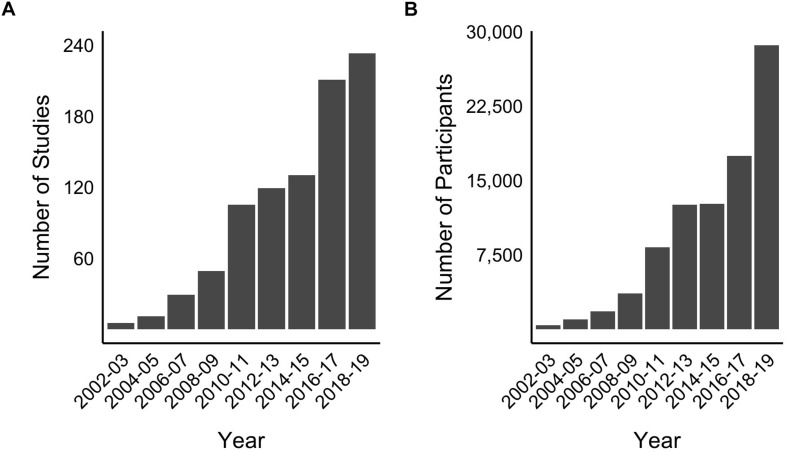
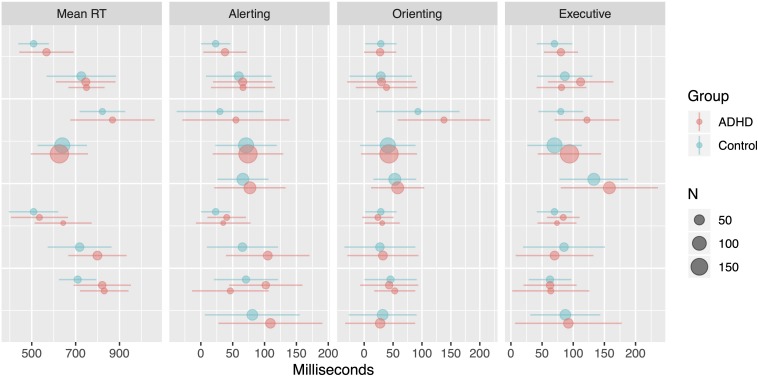
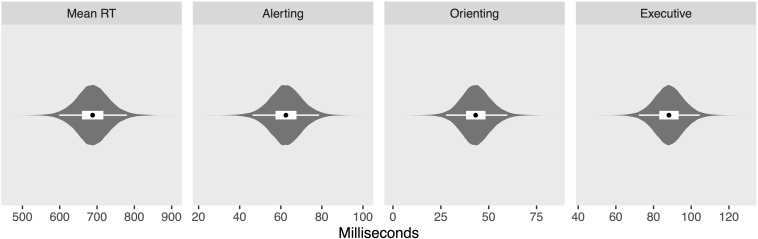
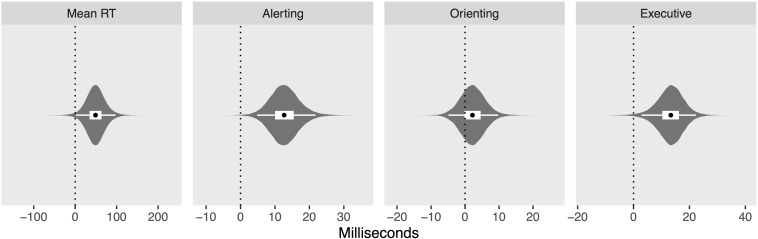
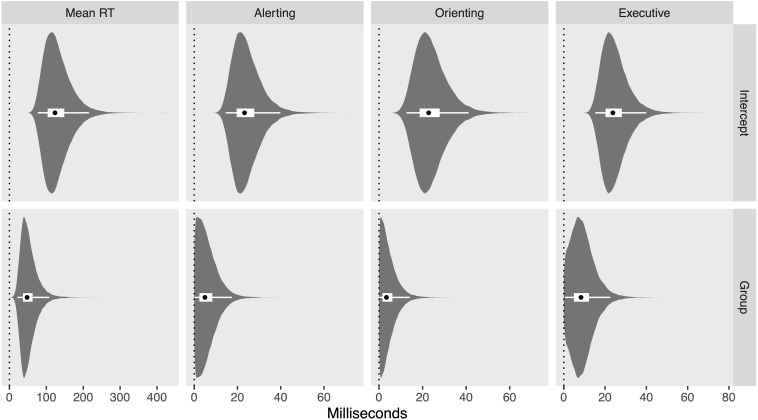
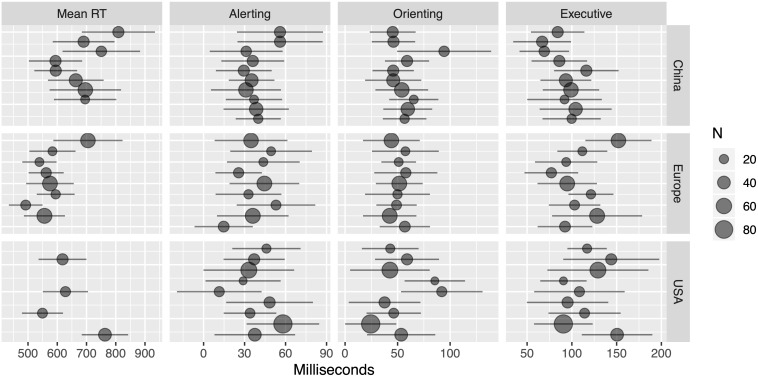
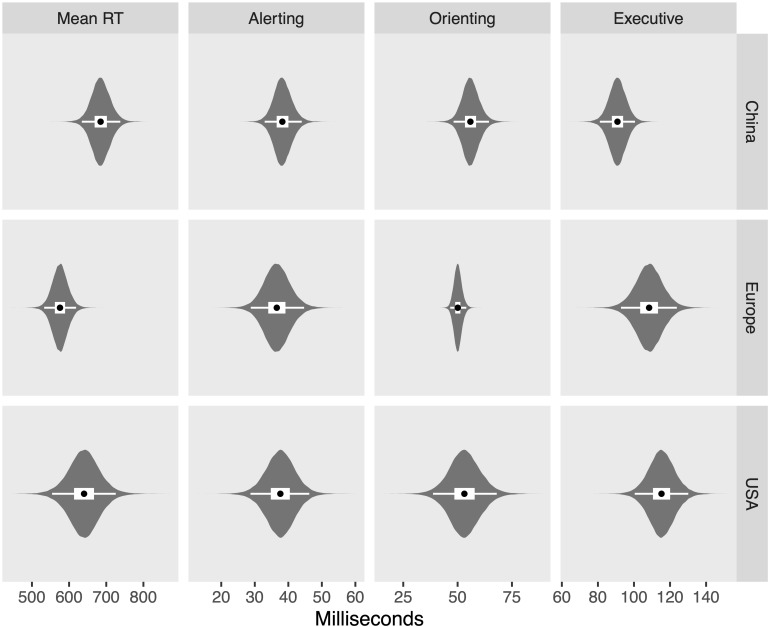
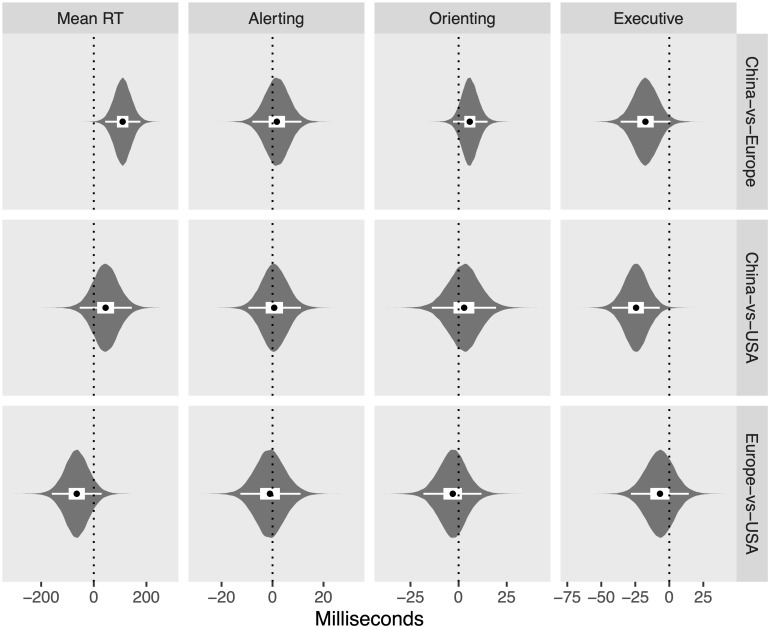
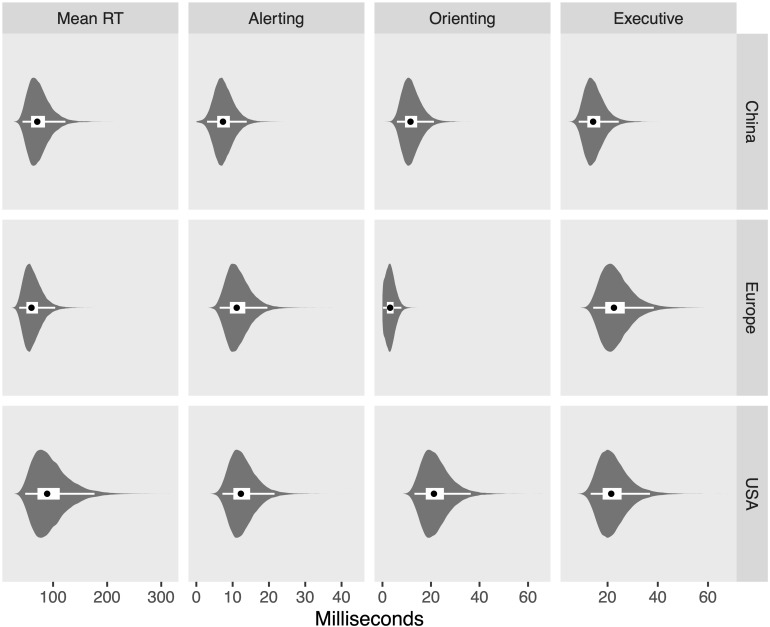
Attention is a central component of cognitive and behavioral processes and plays a key role in basic and higher-level functioning. Posner's model of attention describes three components or networks of attention: the alerting, which involves high intensity states of arousal; the orienting, which involves the selective direction of attention; and the executive control, which involves cognitive functions such as conflict resolution and working memory. The Attention Network Test (ANT) is a computerized testing measure that was developed to measure these three networks of attention. This project describes the ANT, its widely used variants, and the recently developed ANT Database, a repository of data extracted from all studies that have used the ANT as of 2019. To illustrate the potential uses of the database, two meta-analyses conducted using the ANT Database are described. One explores task performance in children with and without attention deficit/hyperactivity disorder (ADHD). The other one explores regional differences between studies conducted in China, Europe, and the United States. We are currently in the process of integrating the database into a publicly available web interface. When that work is complete, researchers, clinicians, and the general public will be able to use the database to explore topics of interest related to attention.

Keywords: Attention Network Test; attention; attention deficit/hyperactivity disorder; cross-cultural; database; meta-analysis.


Figures

FIGURE 1
FIGURE 1
A depiction of the experimental procedure of the original Attention Network Test (ANT) alongside all possible stimuli associated with each event. Redrawn from MacLeod et al. (2010).
FIGURE 2
FIGURE 2
(A) Number of studies that used the ANT or a variant of the ANT and (B) number of participants tested in these studies.
FIGURE 3
FIGURE 3
Forest plot of data used for meta-analysis. Dots reflect means sized by N, and lines reflect ± 1SD. Data from the same study are grouped together vertically.
FIGURE 4
FIGURE 4
Violin plots of posterior distributions for intercepts. Black dots reflect posterior median, thick white band reflects 50% credibility interval (CrI), and thin white band reflects 95% CrI.
FIGURE 5
FIGURE 5
Violin plots of posterior distributions for between-group differences, attention deficit/hyperactivity disorder (ADHD) minus control. Black dots reflect posterior median, thick white band reflects 50% CrI, and thin white band reflects 95% CrI.
FIGURE 6
FIGURE 6
Violin plots of the posterior distribution for heterogeneity parameters. Black dots reflect posterior median, thick white band reflects 50% CrI, and thin white band reflects 95% CrI.
FIGURE 7
FIGURE 7
Forest plot of data used for meta-analysis. Dots reflect means sized by N, and lines reflect ± 1SD.
FIGURE 8
FIGURE 8
Violin plots of posterior distributions. Black dots reflect posterior median, thick white band reflects 50% CrI, and thin white band reflects 95% CrI.
FIGURE 9
FIGURE 9
Violin plots of posterior distributions for between-group differences. Black dots reflect posterior median, thick white band reflects 50% CrI, and thin white band reflects 95% CrI.
FIGURE 10
FIGURE 10
Violin plots of posterior distributions for heterogeneity between studies. Black dots reflect posterior median, thick white band reflects 50% CrI, and thin white band reflects 95% CrI.

References

    1. Adólfsdóttir S., Sørensen L., Lundervold A. J. (2008). The attention network test: a characteristic pattern of deficits in children with ADHD. Behav. Brain Funct. 4:9. 10.1186/1744-9081-4-9 - DOI - PMC - PubMed
    1. Barkley R. A., Murphy K. R. (2010). Impairment in occupational functioning and adult ADHD: the predictive utility of executive function (EF) ratings versus EF tests. Arch. Clin. Neuropsychol. 25 157–173. 10.1093/arclin/acq014 - DOI - PMC - PubMed
    1. Berger A., Posner M. I. (2000). Pathologies of brain attentional networks. Neurosci. Biobehav. Rev. 24 3–5. 10.1016/s0149-7634(99)00046-9 - DOI - PubMed
    1. Biederman J., Monuteaux M. C., Doyle A. E., Seidman L. J., Wilens T. E., Ferrero F., et al. (2004). Impact of executive function deficits and attention-deficit/hyperactivity disorder (ADHD) on academic outcomes in children. J. Consult. Clin. Psychol. 72:757. 10.1037/0022-006X.72.5.757 - DOI - PubMed
    1. Boduroglu A., Shah P., Nisbett R. E. (2009). Cultural differences in allocation of attention in visual information processing. J. Crosscult. Psychol. 40 349–360. 10.1177/0022022108331005 - DOI - PMC - PubMed

LinkOut - more resources