. 2020 Mar 27:11:535.
doi: 10.3389/fimmu.2020.00535. eCollection 2020.

Hepatitis B Core Antigen Impairs the Polarization While Promoting the Production of Inflammatory Cytokines of M2 Macrophages via the TLR2 Pathway

Affiliations

Hepatitis B Core Antigen Impairs the Polarization While Promoting the Production of Inflammatory Cytokines of M2 Macrophages via the TLR2 Pathway

Hongyu Yi et al. Front Immunol. .

Abstract

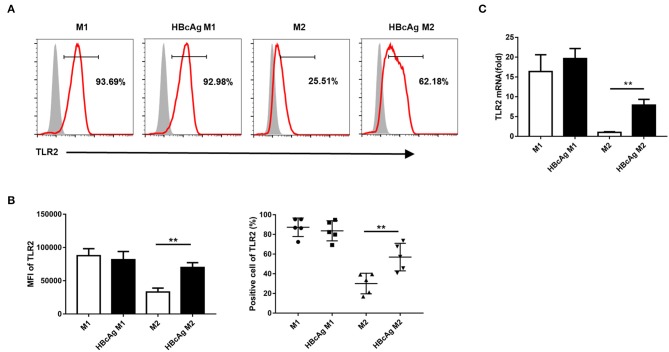
Although several evidences suggesting the vital roles that innate immunity plays in the persistence and elimination of chronic hepatitis B virus (CHB) infection, the exact mechanism is still complicated. Here, we successfully polarized monocytes derived from healthy human peripheral blood mononuclear cells (PBMCs) into M1/M2 macrophages and detected the effects of hepatitis B core antigen (HBcAg) on the polarization and function of macrophages via the Toll-like receptor (TLR) 2 signaling pathway. The results showed that HBcAg had a negligible impact on M1 polarization, while it effectively impaired M2 polarization and promoted the production of pro-inflammatory cytokines such as IL-6 and TNF-α. Additionally, HBcAg treatment increased TLR2 expression on M2 macrophages and TLR2 blockade abolished the effects of HBcAg on the impaired phenotype and pro-inflammatory cytokine productions of M2 macrophages. Signaling pathway analysis revealed that the nuclear factor κB (NF-κB) pathway, the downstream of TLR2, was upregulated upon HBcAg treatment in both M1 and M2 macrophages. Furthermore, a CD8+ T-macrophage coculture system implied that compared with PBS stimulation, HBcAg-stimulated M2 macrophages regained their ability to activate CD8+ T cells with higher secretion of IFN-γ. Finally, we found impaired expression of M2-related molecules and increased levels of pro-inflammation cytokines in M2 macrophages from CHB patients upon HBcAg stimulation. In conclusion, these results imply a favorable role of HBcAg in the establishment of a pro-inflammatory microenvironment by macrophages, which may suggest a potential therapeutic strategy of HBcAg-induced macrophage activation in CHB infection.

Keywords: HBV core protein; Toll-like receptor 2; hepatitis B virus; inflammatory cytokines; macrophage polarization.


Figures

Figure 1
Figure 1
Comparison of human peripheral monocyte-derived M1 and M2 macrophage polarization profiles. (A) After M1 and M2 MΦ were eventually polarized upon an additional 24 h incubation with LPS/IFN-γ or IL-4, the morphology of M1 and M2 MΦ were observed using light microscope (original magnification, × 200). (B) Representative flow cytometric graphs showing CD40, CD80, CD206, and CD163 expression levels in M1 and M2 MΦ. Cumulative results calculating MFI (C) and positive cells (D) of CD40, CD80, CD206, and CD163 expression levels in freshly isolated monocytes (M0), M1, and M2 MΦ. (E) CCR7, CD40, CD80 (upper), CD206, and CD163 (lower) mRNA levels in M0, M1, and M2 MΦ were analyzed by RT-qPCR. Experiments in (B–E) were repeated at least two times. Data were analyzed using a paired Student's t-test. Results are shown as the mean ± SEM (B–D, n = 6–11; E, n = 3). *p < 0.05, **p < 0.01, ***p < 0.001.
Figure 2
Figure 2
HBcAg selectively inhibited M2 macrophage phenotype. (A) The co-localization between HBcAg and CD68 was detected by immunofluorescence staining. Red and green represent HBcAg and CD68, respectively, blue represents nuclei and yellow represents co-localization. (B–D) 10 μg/ml HBcAg or an equal volume of PBS was added simultaneously with LPS/IFN-γ or IL-4 to unpolarized M1 or M2 MΦ and incubated for an additional 24 h for further polarization. (B) Representative flow cytometric graphs (upper) and cumulative results (lower) showing CD40 and CD80 expression levels in M1 MΦ stimulated with either PBS or HBcAg. (C) Representative flow cytometric graphs (upper) and cumulative results (lower) showing CD206 and CD163 expression levels in M2 MΦ stimulated with either PBS or HBcAg. (D) CCR7, CD40, and CD80 mRNA levels in M1 MΦ or CD206 and CD163 mRNA levels in M2 MΦ stimulated with either PBS or HBcAg were analyzed by RT-qPCR. Experiments in (A–D) were repeated at least two times. Data were analyzed using a paired Student's t-test. Results are shown as the mean ± SEM (B–C, n = 8; D, n = 3). *p < 0.05, ***p < 0.001.
Figure 3
Figure 3
HBcAg retrieved the production of inflammatory cytokines by M2 macrophages and inhibited M2 phenotype correlated with STAT6 pathway. (A,B) After being stimulated with GM-CSF or M-CSF for 6 d, M0–M1 and M0–M2 unpolarized MΦ were incubated with LPS/IFN-γ or IL-4 for further differentiation. After another 24 h incubation, polarized M1 or M2 MΦ were stimulated with 10 μg/ml HBcAg or an equal volume of PBS for another 30 min. The protein levels of STAT1, p-STAT1, STAT6, and p-STAT6 were analyzed by Western blot. (A) Representative figures and (B) cumulative densitometry quantification for p-STAT1 and p-STAT6 expression normalized to STAT1 and STAT6, respectively. (C) Supernatants of polarized M1 and M2 MΦ stimulated with HBcAg or PBS were collected to measure TNF-α, IL-6, and IL-10 productions by ELISA. Experiments in (A,B) were repeated at least three times. Data were analyzed using a paired Student's t-test. Results are shown as the mean ± SEM (A,B, n = 3; C, n = 9–11). *p < 0.05, ***p < 0.001, ****p < 0.0001.
Figure 4
Figure 4
TLR2 expression in M2 macrophages was upregulated via HBcAg stimulation. (A–C) 10 μg/ml HBcAg or an equal volume of PBS was added simultaneously with LPS/IFN-γ or IL-4 to unpolarized M1 or M2 MΦ and incubated for an additional 24 h for further polarization. (A) Representative flow cytometric graphs and (B) cumulative results calculating MFI and positive cells showing TLR2 expression in M1 and M2 MΦ stimulated with either PBS or HBcAg. (C) TLR2 mRNA level in M1 and M2 MΦ stimulated with either PBS or HBcAg was analyzed by RT-qPCR. Experiments in (A–C) were repeated at least two times. Data were analyzed using a paired Student's t-test. Results are shown as the mean ± SEM (A,B, n = 5; C, n = 3). **p < 0.01.
Figure 5
Figure 5
TLR2 blockade abolished the impaired M2 polarization induced by HBcAg. (A–C) For TLR2 blocking assay, unpolarized M1 and M2 MΦ were pretreated with 0.10 μg/ml anti-TLR2 for 4 h before incubated with LPS/IFN-γ, IL-4, HBcAg, or PBS. (A) Representative flow cytometric graphs (left) and cumulative MFI (right) showing CD40 and CD80 expression levels in M1 MΦ. (B) Representative flow cytometric graphs (left) and cumulative MFI (right) showing CD206 and CD163 expression levels in M2 MΦ. (C) Supernatants of M1 and M2 MΦ stimulated with HBcAg, PBS, and anti-TLR2 were collected to measure TNF-α, IL-6, and IL-10 productions by ELISA. Experiments in (A,B) were repeated at least two times. Data were analyzed using a paired Student's t-test. Results are shown as the mean ± SEM (A–C, n = 5). *p < 0.05, **p < 0.01, ***p < 0.001, ****p < 0.0001.
Figure 6
Figure 6
HBcAg-responsive M2 macrophages exhibited the NF-κB pathway activation and mediated CD8+ T cell activation. (A,B) After being stimulated with GM-CSF or M-CSF for 6 d, M0–M1 and M0–M2 unpolarized MΦ were incubated with LPS/IFN-γ or IL-4 further differentiation. After another 24 h incubation, polarized M1 or M2 MΦ were stimulated with 10 μg/ml HBcAg or an equal volume of PBS for another 30 min. The protein levels of NF-κB p65, p-NF-κB p65, IκBα, and p-IκBα were analyzed by Western blot. Representative figures of total protein levels (A) and separated cytosol and nuclear protein levels (B) were shown. (C–E) 1 × 10⁵ freshly purified autologous CD8+ T cells were coculture alone or with 5 × 10⁴ polarized M1 or M2 macrophages (stimulated with HBcAg or not) in the presence of 3 μg/ml anti-CD3/anti-CD28 Abs for 3 d. (C) Representative flow cytometric graphs and (D) cumulative results showing the amount of IFN-γ-producing CD8+ T cells. (E) Supernatants of cocultured CD8+ T cells were collected to measure IFN-γ production by ELISA. Experiments in (A,B) were repeated at least three times. Data were analyzed using a paired Student's t-test. Results are shown as the mean ± SEM (C–E, n = 5). *p < 0.05, **p < 0.01.
Figure 7
Figure 7
Monocyte-derived macrophages of patients with HBV infection presented a diminished M2 subtype and enhanced pro-inflammatory property under HBcAg stimulation. (A–C) 10 μg/ml HBcAg or an equal volume of PBS was added simultaneously with LPS/IFN-γ or IL-4 to unpolarized M1 or M2 MΦ from HBV-infected patients and incubated for an additional 24 h for further polarization. (A) Cumulative results showing CD40 and CD80 expression levels in M1 MΦ stimulated with either PBS or HBcAg from asymptomatic HBV carriers (AsC, n = 6) or patients infected with chronic hepatitis B (CHB, n = 9). (B) Cumulative results showing CD206 and CD163 expression levels in M2 MΦ stimulated with either PBS or HBcAg from asymptomatic HBV carriers (AsC, n = 6) or patients infected with chronic hepatitis B (CHB, n = 9). (C) Supernatants of polarized M1 and M2 MΦ from asymptomatic HBV carriers (AsC, n = 5) or patients with chronic hepatitis B (CHB, n = 5) were collected to measure TNF-α and IL-6 productions by ELISA after stimulated with HBcAg or PBS. Data were analyzed using a paired Student's t-test. Results are shown as the mean ± SEM. *p < 0.05, **p < 0.01.

References

    1. Tsai KN, Kuo CF, Ou JJ. Mechanisms of hepatitis B virus persistence. Trends Microbiol. (2018) 26:33–42. 10.1016/j.tim.2017.07.006 - DOI - PMC - PubMed
    1. Venkatakrishnan B, Zlotnick A. The structural biology of hepatitis B virus: form and function. Annu Rev Virol. (2016) 3:429–51. 10.1146/annurev-virology-110615-042238 - DOI - PMC - PubMed
    1. Guidotti LG, Isogawa M, Chisari FV. Host-virus interactions in hepatitis B virus infection. Curr Opin Immunol. (2015) 36:61–6. 10.1016/j.coi.2015.06.016 - DOI - PMC - PubMed
    1. Klein I, Cornejo JC, Polakos NK, John B, Wuensch SA, Topham DJ, et al. . Kupffer cell heterogeneity: functional properties of bone marrow derived and sessile hepatic macrophages. Blood. (2007) 110:4077–85. 10.1182/blood-2007-02-073841 - DOI - PMC - PubMed
    1. Davies LC, Jenkins SJ, Allen JE, Taylor PR. Tissue-resident macrophages. Nat Immunol. (2013) 14:986–95. 10.1038/ni.2705 - DOI - PMC - PubMed

Publication types

MeSH terms