Review
. 2020 Mar 15;10(10):4359-4373.
doi: 10.7150/thno.44298. eCollection 2020.

Signal amplification and quantification on lateral flow assays by laser excitation of plasmonic nanomaterials

Affiliations
Review

Signal amplification and quantification on lateral flow assays by laser excitation of plasmonic nanomaterials

Haihang Ye et al. Theranostics. .

Abstract

Lateral flow assay (LFA) has become one of the most widely used point-of-care diagnostic methods due to its simplicity and low cost. While easy to use, LFA suffers from its low sensitivity and poor quantification, which largely limits its applications for early disease diagnosis and requires further testing to eliminate false-negative results. Over the past decade, signal enhancement strategies that took advantage of the laser excitation of plasmonic nanomaterials have pushed down the detection limit and enabled quantification of analytes. Significantly, these methods amplify the signal based on the current LFA design without modification. This review highlights these strategies of signal enhancement for LFA including surface enhanced Raman scattering (SERS), photothermal and photoacoustic methods. Perspectives on the rational design of the reader systems are provided. Future translation of the research toward clinical applications is also discussed.

Keywords: SERS; gold nanoparticles; lateral flow assay; nanoparticle heating; signal amplification and quantification.


Conflict of interest statement

Competing Interests: ZQ is listed on patents related to thermal contrast amplification and has the equity interest in Vigilant Diagnostics.

Figures

Figure 1
Figure 1
Schematics showing the (A) working principle and components of a sandwich-type LFA. (B) Signal readout for positive and negative results of LFA, where the test band shows the signal of detection and the control band functions for the validation. (C) The outline of sensing modes induced by the laser-GNP interaction for the sensitive and quantitative detection on LFA that were elaborated in the review.
Figure 2
Figure 2
Surface-enhanced Raman scattering (SERS)-based LFA with enhanced detection sensitivity. (A) Schematics showing the principle of measuring SERS signal on LFA strips with GNPs-based SERS tags. (B) Comparison of the analytical results obtained from the optical density of conventional LFA strips, ELISA, and present SERS-LFA strips in detection of staphylococcal enterotoxin B (SEB). Inset in blue box shows a typical focused scanning of test band (200 μm x 800 μm) and whole control band of LFA strip by SERS spectroscope system. T and C stands for test band and control band, respectively. (C) Schematic representation of a portable SERS reader with line-focused optical fiber probe laser. Scanning steps and time is shown in the box. Photographs show the custom-designed optical fiber probe and a 785 nm diode laser. (D) Dose response curve of the SERS signal after applying different concentrations of hCG clinical samples. Inset shows a linear SERS response at low hCG concentrations and the vertical line marks the LOD of SERS-LFA and commercially available LFA kits. Adapted with permission from , , copyright 2016 The Royal Society of Chemistry and 2019 The Authors, published by Wiley-VCH Verlag GmbH & Co. KGaA., respectively.
Figure 3
Figure 3
Thermal contrast amplification (TCA) technique for LFA. (A) Schematics showing the detection principle of TCA technique working on LFA strip. (B) Dose response curves of the TCA and colorimetric signals of LFA for CrAg. The “Ctrl” means the background signal from control sample (water). (C) A photograph of the benchtop reader system. (D) Comparison of a TCA research system and the reader system shown in (C). (E) TCA reader algorithm for detection and quantification of temperature rise in an LFA strip. The area under the curve (AUC) analysis was performed along the strip covering the control and test bands for the signal acquisition. The result was obtained from a visual-negative malaria First Response LFA kit as shown in inset. (F) Quantitative results of representative LFA strips using the TCA benchtop device against visual images. Samples are different dilutions of influenza A positive swabs extraction. LFAs are from BD Veritor. Adapted with permission from , , copyright 2012 John Wiley and Sons and 2016 American Chemical Society, respectively.
Figure 4
Figure 4
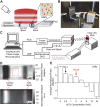
Thermophotonic lock-in imaging (TPLI) system for LFA. Schematics showing (A) the TPLI working principle and (B) a photograph of the experimental setup, and (C) the major components of TPLI system used for interpretation of LFA results. (D) TPLI phase (top) and amplitude (bottom) images of LFA strip obtained at hCG concentration of 16 mIU and 2 Hz modulation frequency. (E) Average normalized phase values at 2 Hz modulation frequency within the test band against different hCG concentrations. The arrows mark the detection threshold of visual and TPLI readouts. Adapted with permission from , copyright 2018 Elsevier.
Figure 5
Figure 5
Photothermal laser speckle imaging (PT-LSI) system for LFA. (A) Schematics of the PT-LSI setup working on a mounted LFA strip. (B) Outline of the PT-LSI signal processing. The procedures include speckle images acquisition, pixel intensity fluctuation measurements, Fourier transformation of magnitude, and PT-LSI signal output. Dose response curves of PT-LSI signal of LFA for (C) GNPs and (D) CrAg detection. The blue line in both plots marks the noise-equivalent output, which was acquired with PBS buffer only. Adapted with permission from , copyright 2018 Elsevier.
Figure 6
Figure 6
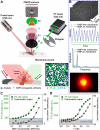
Schematics of the (A) working principle of PA-LFA; and (B) detection modes of PA-LFA. Note an air-tight chamber is used to block the environmental variations and the microphone is for the PA signal amplification. The measured PA waveforms with different number of GNPs absorbed on the strip in chop mode (C) and scan mode (D), respectively. For both plots, the peak-to-peak value was marked as the PA signal; and the color curves mark the concentration of GNPs applied: 1011 mL-1 for black, 3×10¹⁰ mL-1 for red, and 0 for blue (control). (E) Comparison between diagnostic performance of PA measurements under the scan mode and chop mode and colorimetric result. Adapted with permission from , copyright 2016 The Royal Society of Chemistry.

References

    1. Leuvering JH, Thal PJHM, Waart MVD, Schuurs AHWM. Sol particle immunoassay (SPIA) J Immunoassay. 1980;1:77–91. - PubMed
    1. Parolo C, Merkoçi A. Paper-based nanobiosensors for diagnostics. Chem Soc Rev. 2013;42:450–7. - PubMed
    1. Xu Y, Liu Y, Wu Y, Xia X, Liao Y, Li Q. Fluorescent probe-based lateral flow assay for multiplex nucleic acid detection. Anal Chem. 2014;86:5611–4. - PubMed
    1. Urusov AE, Gubaidullina MK, Petrakova AV, Zherdev AV, Dzantiev BB. A new kind of highly sensitive competitive lateral flow immunoassay displaying direct analyte-signal dependence. Application to the determination of the mycotoxin deoxynivalenol. Microchim Acta. 2018;185:29. - PubMed
    1. Zhou Y, Ding L, Wu Y, Huang X, Lai W, Xiong Y. Emerging strategies to develop sensitive AuNP-based ICTS nanosensors. Trends Analyt Chem. 2019;112:147–60.

Publication types