

doi: 10.1016/j.idm.2020.03.002.
Epub 2020 Mar 31.
Propagation analysis and prediction of the COVID-19
Affiliations
- PMID: 32292868
- PMCID: PMC7118312
- DOI: 10.1016/j.idm.2020.03.002
Item in Clipboard
Propagation analysis and prediction of the COVID-19
Infect Dis Model.
2020.
Abstract
Based on the official data modeling, this paper studies the transmission process of the Corona Virus Disease 2019 (COVID-19). The error between the model and the official data curve is quite small. At the same time, it realized forward prediction and backward inference of the epidemic situation, and the relevant analysis help relevant countries to make decisions.
Keywords: COVID-19; Epidemic control; Short-term forecast.
© 2020 The Authors. Production and hosting by Elsevier B.V. on behalf of KeAi Communications Co., Ltd.
Conflict of interest statement
None.
Figures

The comparison between the official epidemic data and simulation data of Hubei Province (The curve a - Number of simulated infections. The curve b - Number of officially confirmed infections. The curve c - Number of simulated cures. The curve d - Number of officially cures. The curve e - Number of simulated deaths. The curve f- Number of officially deaths.) There are three stages in the simulation. The first stage is before January 23, when Wuhan is not closed; the second stage is from January 23 to February 10; the third stage is after February 10, when Wuhan starts to close the community.
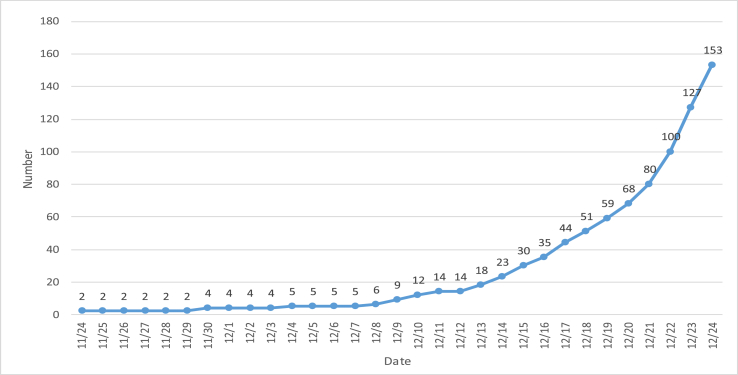
Backward graph of initial epidemic curve.
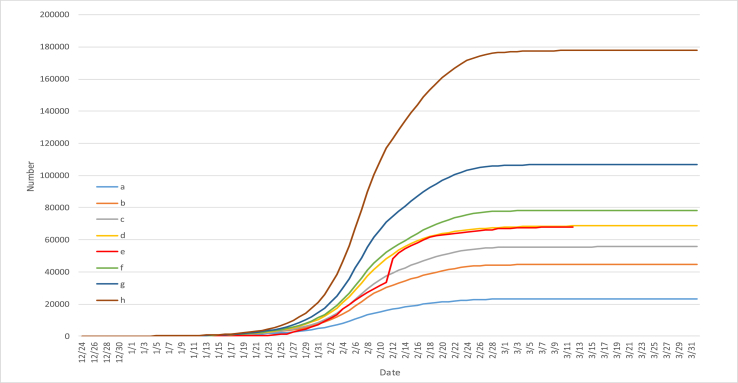
Comparison of the basic reproduction number. (The basic reproduction number a = 3, b = 3.5, c = 3.7, d = 3.8, f = 3.9, g = 4.1, h = 4.6, respectively. The curve e - Number of officially confirmed infections.)

Comparison of the average latency. (The average latency a = 3, b = 5, c = 6, e = 7, f = 9, respectively. The curve d - Number of officially confirmed infections.)

Comparison of epidemic control at different times (The curve a - 5 days in advance. The curve b - Control by actual days. The curve c - Number of officially confirmed infections. The curve d - 5 days delayed.).

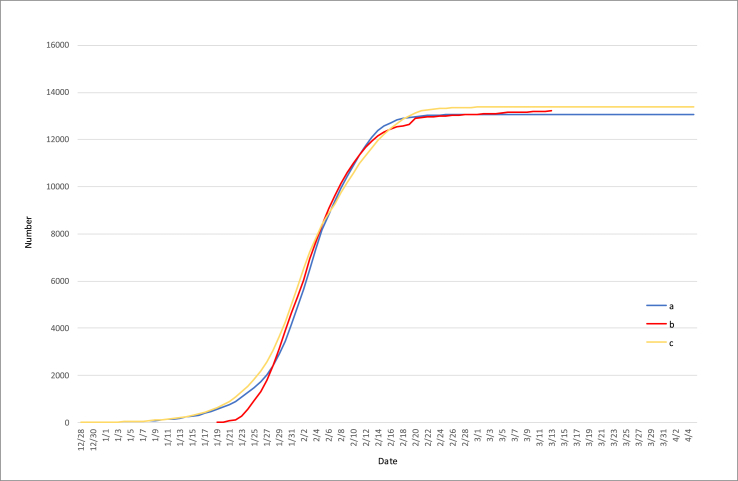
Change curve of daily new infections. (The curve a - Simulated curve. The curve b - Smoothed curve. The curve c - Number of officially confirmed infections.)
Correlation analysis of epidemic data in non-Hubei area (The curve a - Simulated number of non-Hubei infections, the curve b - Actual number of non- Hubei confirmed cases, the curve c - Number of simulated infections in Hubei when control was ten days in advance).

Comparison of Korean epidemic simulation data and official data. (The curve a-Number of simulated infections. The curve b-Number of officially confirmed infections.)

Comparison of Italy epidemic simulation data and official data. (The curve a-Number of simulated infections (uncontrol). The curve b-Number of simulated infections (partial control). The curve c-Number of officially confirmed infections.).

Comparison of Iran epidemic simulation data and official data. (The curve a-Number of simulated infections. The curve b-Number of officially confirmed infections.)
References
LinkOut - more resources
Full Text Sources
