

Being red, blue and green: the genetic basis of coloration differences in the strawberry poison frog (Oophaga pumilio)
- PMID: 32293261
- PMCID: PMC7158012
- DOI: 10.1186/s12864-020-6719-5
Being red, blue and green: the genetic basis of coloration differences in the strawberry poison frog (Oophaga pumilio)
Abstract
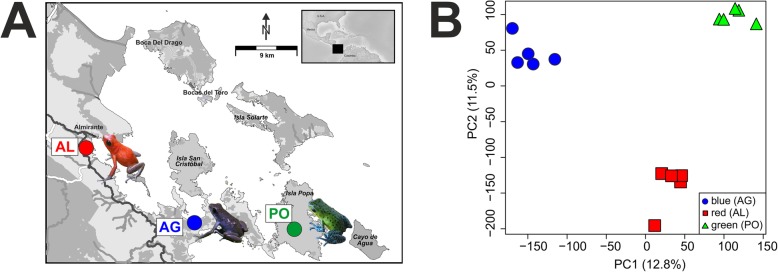
Background: Animal coloration is usually an adaptive attribute, under strong local selection pressures and often diversified among species or populations. The strawberry poison frog (Oophaga pumilio) shows an impressive array of color morphs across its distribution in Central America. Here we quantify gene expression and genetic variation to identify candidate genes involved in generating divergence in coloration between populations of red, green and blue O. pumilio from the Bocas del Toro archipelago in Panama.
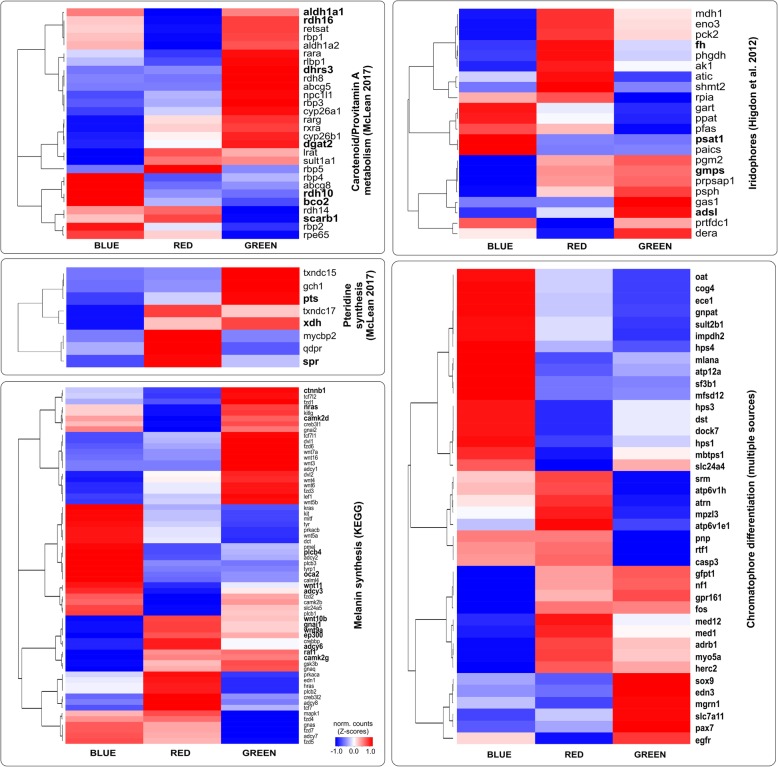
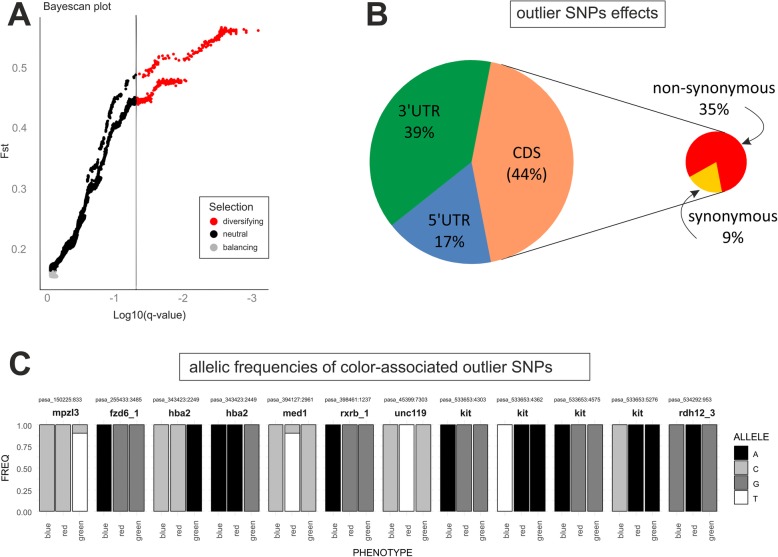
Results: We generated a high quality non-redundant reference transcriptome by mapping the products of genome-guided and de novo transcriptome assemblies onto a re-scaffolded draft genome of O. pumilio. We then measured gene expression in individuals of the three color phenotypes and identified color-associated candidate genes by comparing differential expression results against a list of a priori gene sets for five different functional categories of coloration - pteridine synthesis, carotenoid synthesis, melanin synthesis, iridophore pathways (structural coloration), and chromatophore development. We found 68 candidate coloration loci with significant expression differences among the color phenotypes. Notable upregulated examples include pteridine synthesis genes spr, xdh and pts (in red and green frogs); carotenoid metabolism genes bco2 (in blue frogs), scarb1 (in red frogs), and guanine metabolism gene psat1 (in blue frogs). We detected significantly higher expression of the pteridine synthesis gene set in red and green frogs versus blue frogs. In addition to gene expression differences, we identified 370 outlier SNPs on 162 annotated genes showing signatures of diversifying selection, including eight pigmentation-associated genes.
Conclusions: Gene expression in the skin of the three populations of frogs with differing coloration is highly divergent. The strong signal of differential expression in pteridine genes is consistent with a major role of these genes in generating the coloration differences among the three morphs. However, the finding of differentially expressed genes across pathways and functional categories suggests that multiple mechanisms are responsible for the coloration differences, likely involving both pigmentary and structural coloration. In addition to regulatory differences, we found potential evidence of differential selection acting at the protein sequence level in several color-associated loci, which could contribute to the color polymorphism.
Keywords: Coloration genetics; Gene expression; Pigments; Poison frog; SNPs.
Conflict of interest statement
None.
Figures
References
-
- Dreiss AN, S. A, Burri R, Fumagalli L, Sonnay C, Frey C, Goudet J, Roulin A. Local adaptation and matching habitat choice in female barn owls with respect to melanic coloration. J Evol Biol. 2012;25:103–14. - PubMed
-
- Brusa O, Bellati A, Meuche I, Mundy NI, Pröhl H. Divergent evolution in the polymorphic granular poison-dart frog, Oophaga granulifera: genetics, coloration, advertisement calls and morphology. J Biogeogr. 2013;40:394–408.
-
- Hubbard JK, Safran RJ, Uy JAC, Hauber ME, Hoekstra HE. Vertebrate pigmentation: from underlying genes to adaptive function. Trends Ecol Evol. 2010;26(5):231–239. - PubMed
MeSH terms
Substances
Grants and funding
LinkOut - more resources
Full Text Sources
Research Materials
Miscellaneous
