

An evaluation of inverse probability weighting using the propensity score for baseline covariate adjustment in smaller population randomised controlled trials with a continuous outcome
- PMID: 32293286
- PMCID: PMC7092449
- DOI: 10.1186/s12874-020-00947-7
An evaluation of inverse probability weighting using the propensity score for baseline covariate adjustment in smaller population randomised controlled trials with a continuous outcome
Abstract
Background: It is important to estimate the treatment effect of interest accurately and precisely within the analysis of randomised controlled trials. One way to increase precision in the estimate and thus improve the power for randomised trials with continuous outcomes is through adjustment for pre-specified prognostic baseline covariates. Typically covariate adjustment is conducted using regression analysis, however recently, Inverse Probability of Treatment Weighting (IPTW) using the propensity score has been proposed as an alternative method. For a continuous outcome it has been shown that the IPTW estimator has the same large sample statistical properties as that obtained via analysis of covariance. However the performance of IPTW has not been explored for smaller population trials (< 100 participants), where precise estimation of the treatment effect has potential for greater impact than in larger samples.
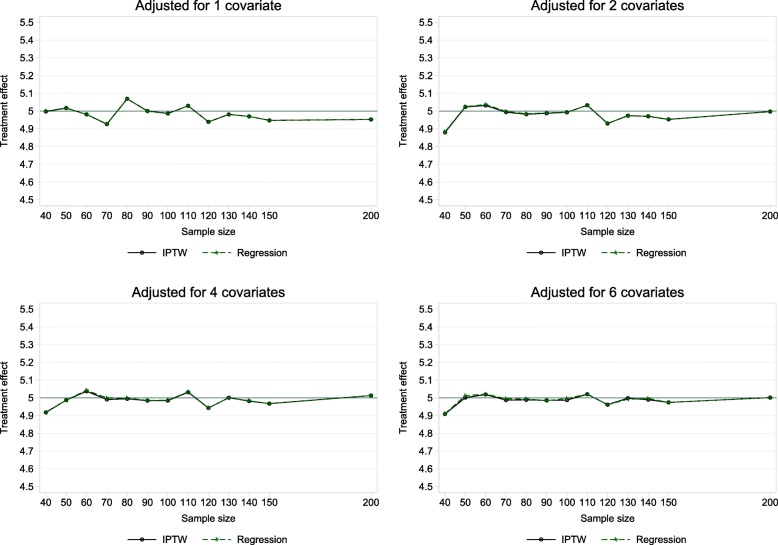
Methods: In this paper we explore the performance of the baseline adjusted treatment effect estimated using IPTW in smaller population trial settings. To do so we present a simulation study including a number of different trial scenarios with sample sizes ranging from 40 to 200 and adjustment for up to 6 covariates. We also re-analyse a paediatric eczema trial that includes 60 children.
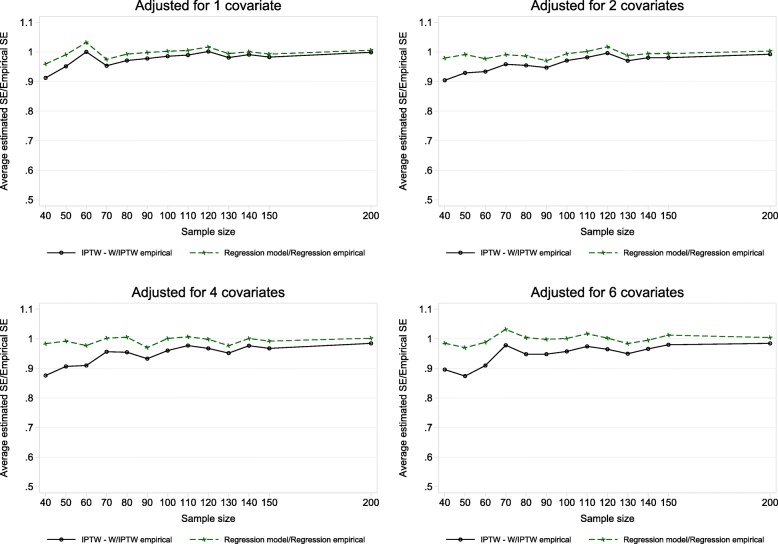
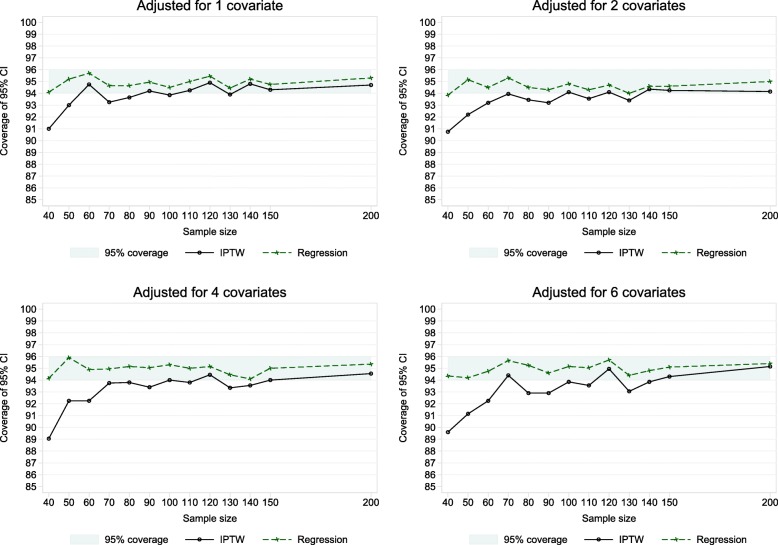
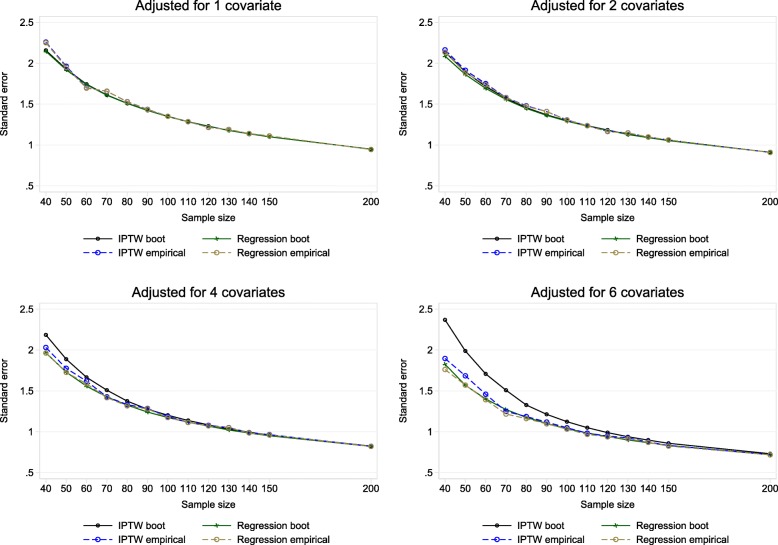
Results: In the simulation study the performance of the IPTW variance estimator was sub-optimal with smaller sample sizes. The coverage of 95% CI's was marginally below 95% for sample sizes < 150 and ≥ 100. For sample sizes < 100 the coverage of 95% CI's was always significantly below 95% for all covariate settings. The minimum coverage obtained with IPTW was 89% with n = 40. In comparison, regression adjustment always resulted in 95% coverage. The analysis of the eczema trial confirmed discrepancies between the IPTW and regression estimators in a real life small population setting.
Conclusions: The IPTW variance estimator does not perform so well with small samples. Thus we caution against the use of IPTW in small sample settings when the sample size is less than 150 and particularly when sample size < 100.
Keywords: Covariate adjustment; Inverse probability weighting; Propensity score; Randomised controlled trial; Small population; Small sample size.
Conflict of interest statement
The authors declare that they have no competing interests.
Figures
References
-
- Senn SJ. Covariate imbalance and random allocation in clinical trials. Stat Med. 1989;8(4):467–475. - PubMed
-
- Robinson LD, Jewell NP. Some surprising results about covariate adjustment in logistic regression models. Int Stat Rev. 1991;59(2):227–240.
-
- Pocock SJ, et al. Subgroup analysis, covariate adjustment and baseline comparisons in clinical trial reporting: current practice and problems. Stat Med. 2002;21(19):2917–2930. - PubMed
Publication types
MeSH terms
Grants and funding
LinkOut - more resources
Full Text Sources
