

Forecasting the 2017/2018 seasonal influenza epidemic in England using multiple dynamic transmission models: a case study
- PMID: 32293372
- PMCID: PMC7158152
- DOI: 10.1186/s12889-020-8455-9
Forecasting the 2017/2018 seasonal influenza epidemic in England using multiple dynamic transmission models: a case study
Abstract
Background: Since the 2009 A/H1N1 pandemic, Public Health England have developed a suite of real-time statistical models utilising enhanced pandemic surveillance data to nowcast and forecast a future pandemic. Their ability to track seasonal influenza and predict heightened winter healthcare burden in the light of high activity in Australia in 2017 was untested.
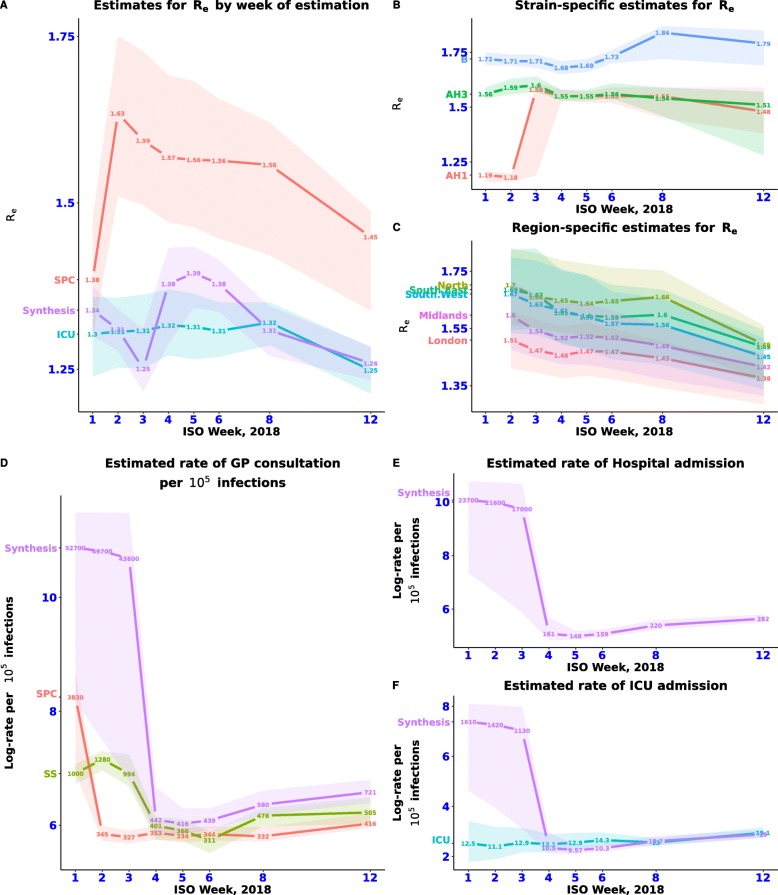
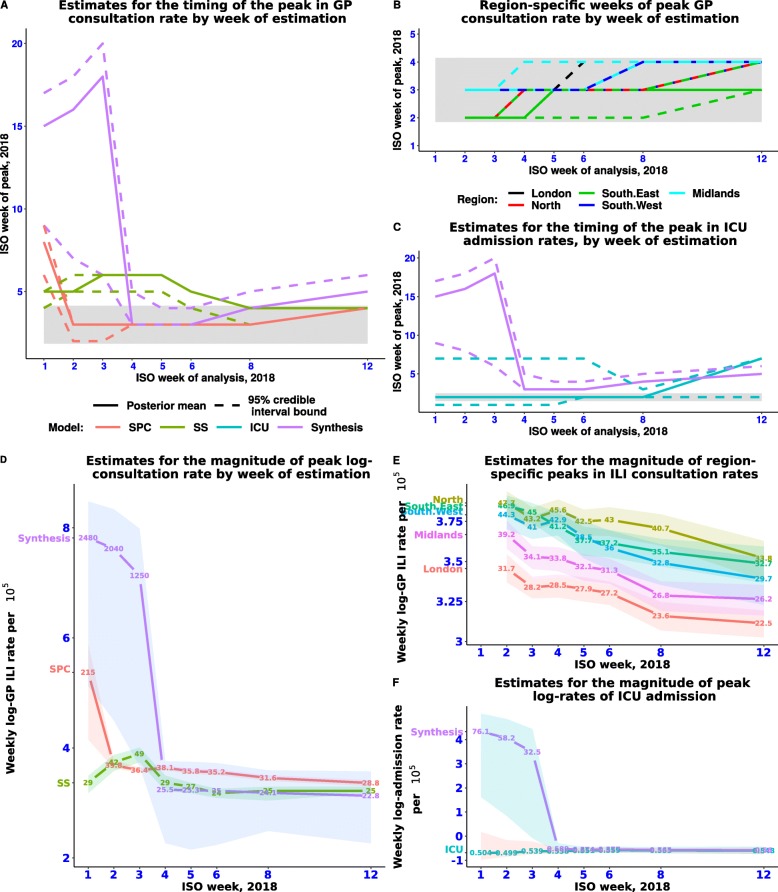
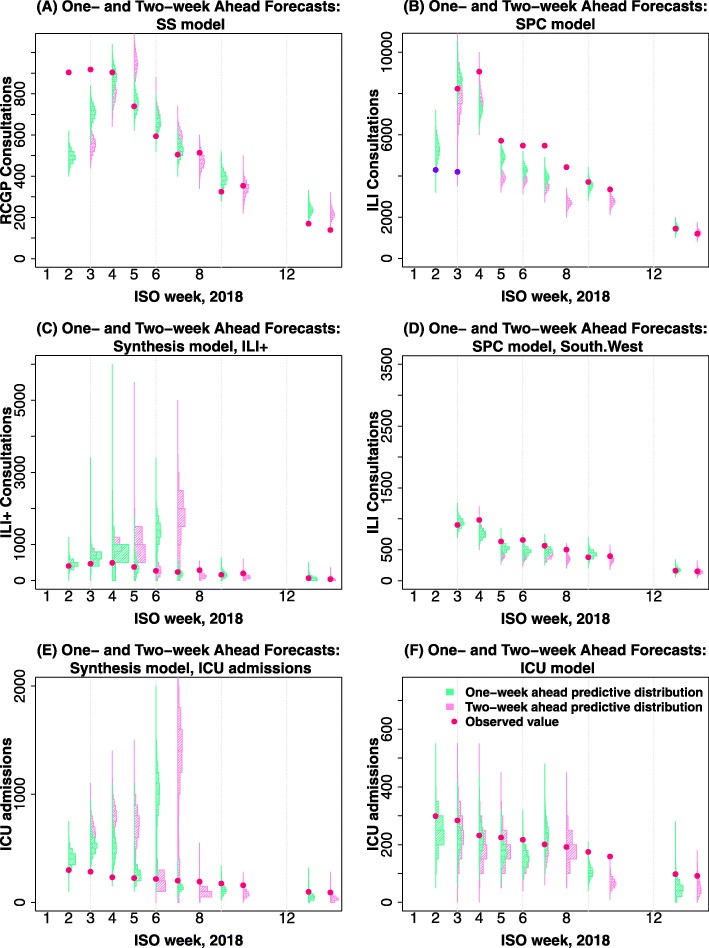
Methods: Four transmission models were used in forecasting the 2017/2018 seasonal influenza epidemic in England: a stratified primary care model using daily, region-specific, counts and virological swab positivity of influenza-like illness consultations in general practice (GP); a strain-specific (SS) model using weekly, national GP ILI and virological data; an intensive care model (ICU) using reports of ICU influenza admissions; and a synthesis model that included all data sources. For the first 12 weeks of 2018, each model was applied to the latest data to provide estimates of epidemic parameters and short-term influenza forecasts. The added value of pre-season population susceptibility data was explored.
Results: The combined results provided valuable nowcasts of the state of the epidemic. Short-term predictions of burden on primary and secondary health services were initially highly variable before reaching consensus beyond the observed peaks in activity between weeks 3-4 of 2018. Estimates for R0 were consistent over time for three of the four models until week 12 of 2018, and there was consistency in the estimation of R0 across the SPC and SS models, and in the ICU attack rates estimated by the ICU and the synthesis model. Estimation and predictions varied according to the assumed levels of pre-season immunity.
Conclusions: This exercise successfully applied a range of pandemic models to seasonal influenza. Forecasting early in the season remains challenging but represents a crucially important activity to inform planning. Improved knowledge of pre-existing levels of immunity would be valuable.
Keywords: Forecasting; GP consultations; Intensive care admissions; Nowcasting; Seasonal influenza; Transmission models.
Conflict of interest statement
The authors declare that they have no competing interests.
Figures
References
MeSH terms
Grants and funding
LinkOut - more resources
Full Text Sources
Medical
