. 2020 Apr 15;8(1):47.
doi: 10.1186/s40478-020-00919-4.

Abnormal mitosis in reactive astrocytes

Affiliations

Abnormal mitosis in reactive astrocytes

Alexander Sosunov et al. Acta Neuropathol Commun. .

Abstract

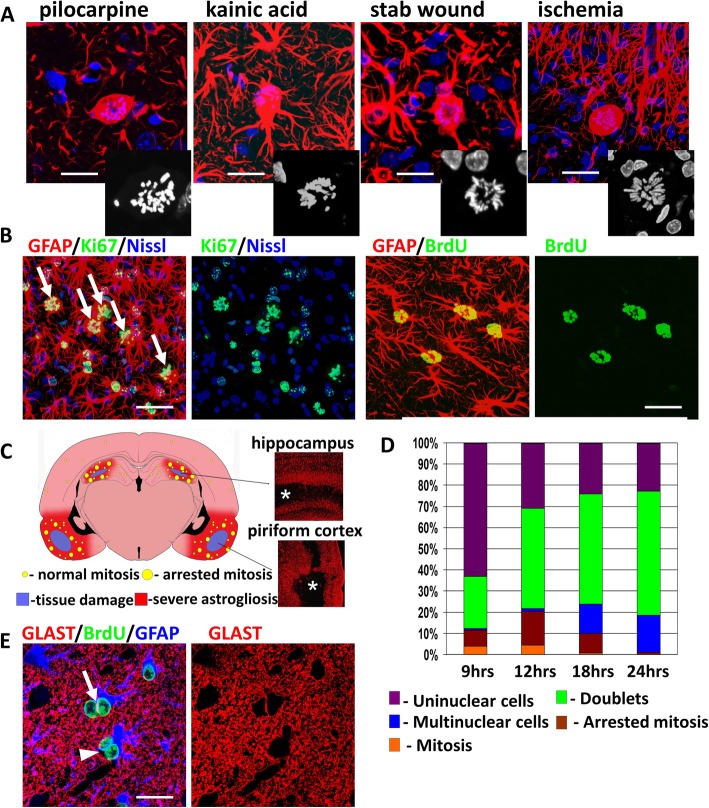
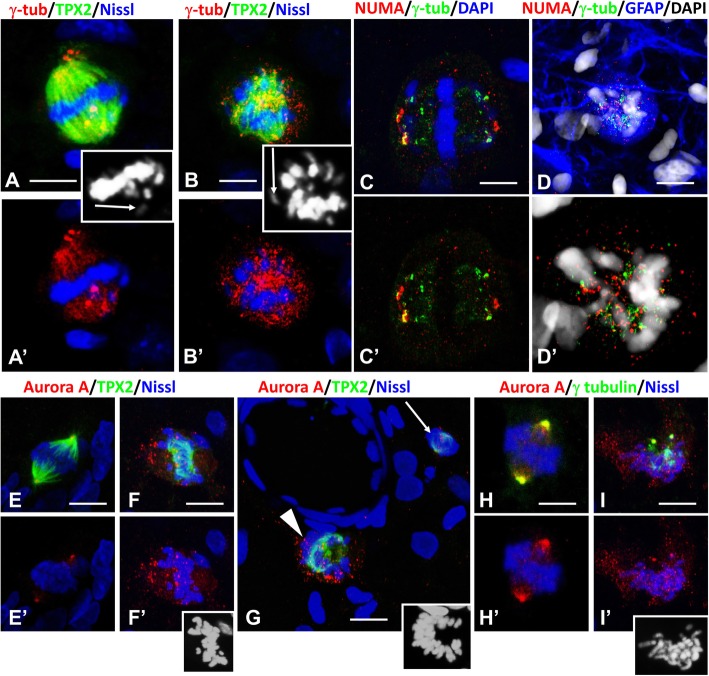
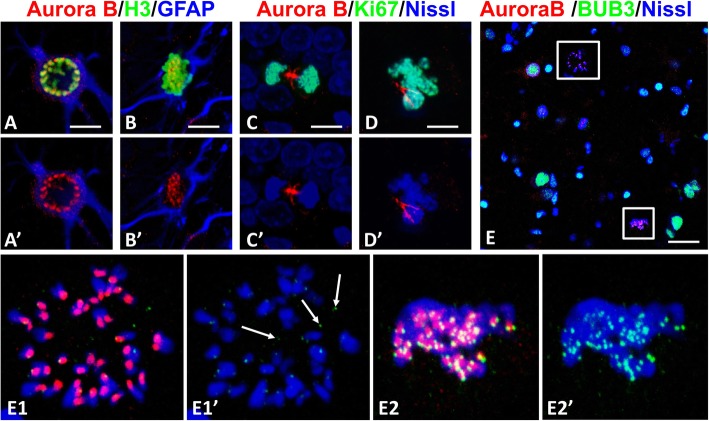
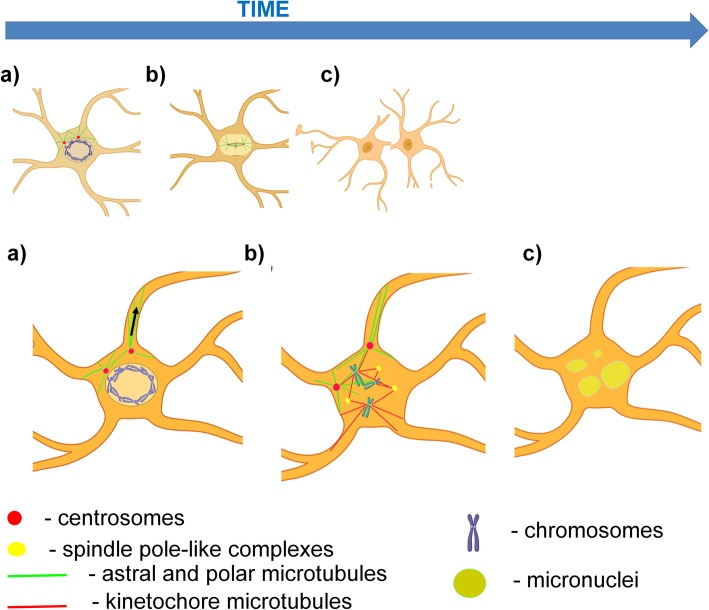
Although abnormal mitosis with disarranged metaphase chromosomes or many micronuclei in astrocytes (named "Alzheimer I type astrocytes" and later "Creutzfeldt-Peters cells") have been known for nearly 100 years, the origin and mechanisms of this pathology remain elusive. In experimental brain insults in rats, we show that abnormal mitoses that are not followed by cytokinesis are typical for reactive astrocytes. The pathology originates due to the inability of the cells to form normal mitotic spindles with subsequent metaphase chromosome congression, which, in turn may be due to shape constraints aggravated by cellular enlargement and to the accumulation of large amounts of cytosolic proteins. Many astrocytes escape from arrested mitosis by producing micronuclei. These polyploid astrocytes can survive for long periods of time and enter into new cell cycles.

Keywords: Astrocytes; Creutzfeldt-Peters cells; Mitosis; Mitotic spindles; Polyploidy.


Conflict of interest statement

The authors declare that they have no competing interests.

Figures

Fig. 1
Fig. 1
Abnormal mitoses are common features of reactive astrogliosis. a Examples of astrocytes arrested in metaphase in excitotoxic (pilocarpine [neocortex] and kainic acid [hippocampus, CA1]), mechanical (stab wound [neocortex]), and ischemic [neocortex] brain damage. Note enlargement of astrocyte cell bodies, reduction of the numbers of main branches, and abnormal positions of metaphase chromosomes distributed over the entire volume of the cell bodies (black and white insets of DAPI stains in lower right segments of each panel). Immunostaining for GFAP, counterstaining with DAPI. Confocal microscopy. b Arrested mitoses in astrocytes (arrows, left 2 images) and astrocytes with many small nuclei (right 2 images). One day after BrdU (80 mg/kg) administration on day 3 after pilocarpine administration, piriform cortex. Confocal microscopy. c Schematic presentation of the most damaged brain areas after pilocarpine administration and the locations of arrested mitoses. Note in the right panels (immunostaining for GFAP) that areas of tissue damage (asterisks) in hippocampus and piriform cortex are devoid of GFAP immunostaining. d Time scale of the dynamics of astrocyte cycling after one BrdU dose (80 mg/kg, i.p.) given on day 3 after pilocarpine administration. Sections were examined 9–24 h after BrdU administration. e Example of ‘doublets’ when daughter astrocytes do not migrate away from each other after mitosis (arrow, note that neighboring nuclei are separated by plasma membranes visualized with GLAST) and when a mitosis was not followed by cytokinesis, generating a binucleated astrocyte (arrowhead, note that the nuclei are not separated by plasma membranes). Scale bars:  a = 10 μm, b = 45 μm, e = 20 μm
Fig. 2
Fig. 2
DNA damage does not accompany arrested C-like-mitoses. a-d DNA fragmentation detected with TUNEL is not typical for astrocytes arrested in mitosis. a CA1 hippocampal subfield with many mitotic astrocytes (identified with phospho-vimentin (pVIM), some of the astrocytes arrested in metaphase are indicated with arrows) that are not positive for TUNEL. Note that the TUNEL+ green nuclei are located in the pyramidal layer and belong to neurons. b, c Piriform cortex, astrocyte with many small nuclei (arrow in b) and astrocyte arrested in metaphase (arrow in c) do not show TUNEL staining. Note that many nuclei are TUNEL+, but are not astrocytes. d TUNEL+ staining of misaligned metaphase chromosomes indicating DNA fragmentation in this astrocyte (arrow). Hippocampus, CA1 subfield. Insets in lower right parts in (b, c, and d) show enlarged nuclei and metaphase chromosomes in the cells marked with arrows in (b, c, d) respectively. e-g Immunoreactivity for phospho-gamma-H2AX (H2AX) is present only in small numbers of mitotic astrocytes. e H2AX+ nuclei (arrows) in the CA1 layer of pyramidal neurons. Note in E that many neurons displayed shrunken, condensed nuclei indicating apoptotic changes. e1, e1’) enlarged boxed area in E shows mitoses. Note that positive signals for H2AX are localized in small, focal areas of chromosomes. f, g Immunoreactivity for H2AX is present in some metaphase chromosomes (f, arrow) and in micronuclei (g, arrow) indicating DNA breaks. h, i, j Colocalization of H2AX with markers of kinetochores: BubR1 (i), Aurora B (j), and survivin (k). f-j – piriform cortex. All images were obtained with confocal microscope 4 days after pilocarpine administration. Scale bars:  a = 150 μm,  b-d = 35 μm,  e = 125 μm,  f,g = 8 μm, h-j = 3 μm
Fig. 3
Fig. 3
Changes in astrocyte morphology in mitotic arrest. a-c. a Astrocyte with enlarged cell body and many primary processes. Note that two neighboring astrocytes (arrows) with micronuclei reveal minimal immunoreactivity for phospho-vimentin (pVIM) indicating a primarily non-phosphorylated state after mitotic slippage. b Astrocyte with a ball-like cell body and only a few primary processes. c Astrocyte showing a significant reduction of primary processes. Insets show misaligned chromosomes with DAPI. d-f Mitotic astrocytes filled with Lucifer yellow (LY) reveal a reduction in numbers of miniature distal processes. Insets in (d and e) show disarranged metaphase chromosomes. f1 is a single optical slice of an enlargement of the astrocyte in (f). Note that the astrocytes in (d-f) are not coupled with neighboring astrocytes. g An astrocyte filled with LY (arrow, enlarged in g1) contains misaligned chromosomes (enlarged in inset in g1), but retains a bushy-like appearance and is coupled to neighboring astrocytes, one of which (arrowhead in g, enlarged in g2) has several micronuclei, indicating slippage from arrested mitosis. Insets show metaphase chromosomes (g1, arrow indicates misaligned chromosomes) and micronuclei (g2). All images were obtained with confocal microscope 4 days after pilocarpine administration. Scale bars: a-c = 10 μm,  d,e = 15 μm,  f = 35 μm, g = 35 μm, g1, g2 = 10 μm
Fig. 4
Fig. 4
Orientation of mitotic spindles (upper panel) and TPX2 immunoreactivity in mitotic astrocytes (lower panel). a, b Mitotic spindles are oriented along the long cellular axes. Note that: 1) immunoreactivity for gamma-tubulin (γ-tub) is localized in centrosomes (arrows in a’ and b′) and at the poles of the spindles; 2) in (b) that one centrosome is displaced into a proximal part of a process (arrow in b) and that this centrosome co-localizes with TPX2 in the process; 3) areas occupied with spindles are devoid of GFAP immunoreactivity. For an animated 3D reconstruction of the spindles see Additional files 4a and 4b. c, d The mitotic spindle is oriented perpendicular to the long cellular axis. Note the widening of the spindle poles, the appearance of additional foci of gamma-tubulin reactivity, and lagging chromosome (arrow) in c′d’). For an animated 3D reconstruction of the spindle in (c) see Additional file 4C. e, f Metaphase chromosomes located at the periphery of cell body. Note several foci of gamma-tubulin immunoreactivity and lagging chromosomes (arrows) in (e’,f’). For an animated 3D reconstruction of the spindles see Additional files 4E and 4F. g-i TPX2 immunoreactivity in mitotic astrocytes is present in cell body and processes indicating penetration of astral microtubules in processes. g Prophase. g’ shows two channels TPX2 and γ-tubulin. Centrosomes are indicated with arrows. h Metaphase. i Anaphase. Lower right insets in (h and i) show chromosomes. All images were obtained with confocal microscope. Scale bars: a-f = 10 μm,  g-i = 15 μm
Fig. 5
Fig. 5
Aggregation of condensed chromosomes near nuclear envelope at the onset of nuclear envelope breakdown (NEB) (upper panel) and displacement of centrosomes from spindle poles (lower panel). a-c Condensed chromosomes are localized near the nuclear envelope. a, b, c –merged confocal images including the entire volume of the nucleus,a1,b1,c1 – single optical slices from central part of each nucleus. Note in cthat microtubules visualized with TPX2 encircle the nucleus and also appear in the processes. For an animated 3D reconstruction of (a) see Additional file 5A. d Disappearance of lamin A/C (lamin) immunoreactivity in the nucleus with chromosomes aggregated near the nuclear envelope. Note that some parts of chromosomes are located outside of the envelope profile (arrow), indicating NEB. Note also that nuclei of neighboring cells (probably neurons) do not show lamin A/C immunoreactivity (asterisks), whereas the nucleus of the astrocyte marked with a star displays lamin A/C immunostaining. e In arrested mitosis lamin A/C immunoreactivity has a punctate appearance distributed over the cytoplasm of the cell body. (g,h) Displacement of centrosomes (identified with gamma-tubulin [γ-tub] and pericentrin [PC], arrows) from spindle poles into the proximal parts of processes. For an animated 3D reconstruction of (g) see Additional file 5G. i-k Displacement of centrosomes (arrows) away from spindle poles. i′ shows two channels γ-tub and DAPI from three shown in i. (j) Note that centrosomes (arrows) are aside from poles. k GLAST immunostaining delineates the cell body of the astrocyte. For an animated 3D reconstruction of (i, j) see Additional files 5 I, J. l, m Several pole-like foci produced by kinetochore microtubules. Note multiple foci of gamma-tubulin immunoreactivity in (m). For an animated 3D reconstruction of (l, m) see Additional files 5 L, M. n, o NUMA immunoreactivity was predominantly located in the areas of kinetochore microtubule convergence in the spindle pole-like structures. Note that centrosomes (arrow and double headed arrow) are not associated with high immunoreactivity for NUMA and that centrosomes (double headed arrows) are displaced from spindle poles. In o′, NUMA and Nissl are shown without γ-tub. For an animated 3D reconstruction of (n) see Additional file 5 N. All images were obtained with confocal microscope. Scale bars:  a,c = 15 μm, b,d,e = 7 μm, g-n = 10 μm, o = 6 μm
Fig. 6
Fig. 6
Appearance of additional gamma-tubulin+ foci of microtubule nucleation (upper panel) and immunoreactivity for Aurora A in arrested mitoses (lower panel). a, b Several foci with gamma-tubulin (γ-tub) immunoreactivity in the vicinity of metaphase chromosomes, some of which are misaligned (arrows in the insets). a’ and b’ – split (a and b) images, respectively. Insets show position of chromosomes. For an animation of 3D reconstruction of (a, b) see Additional files 6A,B. c, d Foci of NUMA immunoreactivity are distributed all over the area occupied by metaphase chromosomes, many of which are misaligned and only partly colocalize with gamma-tubulin. c and c’ – split (c and d) images, respectively. For an animation of 3D reconstruction of (c, d) see Additional files 6C, D. e-i Immunoreactivity for Aurora A in normal mitoses (e, h) and abnormal mitoses with misaligned chromosomes (f, g, i). Note that in normal mitosis Aurora A localizes predominantly in the centrosomes, whereas in mitoses with misaligned chromosomes, small foci of Aurora A immunoreactivity are distributed over a large volume around the chromosomes. Note in G the difference between arrested mitosis (arrowhead) and normal mitosis (arrow). Lower right insets show positions of the chromosomes. All images were obtained with confocal microscope. Scale bars: a,b,d,f,h,i = 5 μm, c = 3 μm, = 10 μm, g = 8 μm
Fig. 7
Fig. 7
Location of BubR1 and BUB3 in mitotic astrocytes. a-f Normal mitoses. In prophase (a) and metaphase (b-d) BubR1 and BUB3 are found in kinetochores and centrosomes (arrows). a1 – single optical slice from stack of images in (a). Note the abundance of microtubules visualized with TPX2 covering the nucleus. e, f In anaphase BubR1 and BUB3 are distributed between segregated daughter chromosomes. g, h Immunoreactivities for BubR1 and BUB3 predominated in kinetochores of lagging chromosomes (arrows). i, j In arrested mitoses many foci of BubR1 and BUB3 immunoreactivity are not associated with chromosomes. i1 and j1 – single optical slices from stacks in (i and j), respectively. j1 – enlarged area in j with chromosomes, GFAP immunostaining is not shown. All images were obtained with confocal microscope. Scalebars: a-h = 5 μm,i = 8 μm,  j = 20 μm, j1 = 8 μm
Fig. 8
Fig. 8
Aurora B in mitotic astrocytes. a-c Aurora B immunoreactivity in normal mitoses, in prophase (a), metaphase (b), and telophase (c). Note that in prophase and metaphase Aurora B is found in focal areas in chromosomes (kinetochores). d Typical pattern of Aurora B immunoreactivity in multinucleated astrocytes. e Double immunostaining for Aurora B and BUB3. e1 – enlarged upper boxed area with arrested mitosis. Note that BUB3 immunoreactivity is minimal, whereas Aurora B is preserved in kinetochores. e2- enlarged lower boxed area with chromosomes congressed in metaphase plate. Note that both Aurora B and BUB3 are colocalized at kinetochores in congressed chromosomes (e2) but in arrested mitosis (e1) where BUB3 (arrows) but not Aurora B is found not connected with chromosomes. All images were obtained with confocal microscope. Scale bars:  a-d = 15 μm, e = 75 μm
Fig. 9
Fig. 9
Levels of GFAP and alphaB-crystallin immunoreactivities correlate with the appearance of abnormal mitoses. a Lagging chromosomes (arrow) are separated from the main group by cytoplasm with high levels of GFAP immunoreactivity. a1 – single optical slice. a1’- enlarged image of chromosomes in a1. For an animated 3D reconstruction of (a) see Additional file 9A. b Significant positive correlation between levels of GFAP immunoreactivity and numbers of arrested mitoses. Regression analysis, R = 0.810. c, d In areas of severe astrogliosis (c) there are astrocytes with arrested mitosis (arrows); in mild astrogliosis (d) at a distance from the damaged area arrested mitosis are not observed. e) alphaB-crystallin (Crystallin) is located around chromosomes in arrested mitosis. Right lower inset shows position of chromosomes. All images were obtained with confocal microscope. Scale bars: a = 20 μm,  c,d = 80 μm,  = 18 μm
Fig. 10
Fig. 10
Electron microscopy of astrocytes in arrested mitoses. a Condensed chromosomes (asterisks) are distributed over a large volume of this rounded astrocyte cell body. (a1) Intermediate filaments are not found in the cytoplasm near chromosomes. b Condensed chromosomes (asterisks) are grouped in one part of the cell body. Microtubules near centromere are indicated with arrowhead (in b1). A few microfilaments (arrows in b1 and b2) are found near chromosomes, intermediate filaments are absent. a1,b1, and b2 – enlarged boxed areas in (a and b), respectively. Scale bars: a,b = 4 μm
Fig. 11
Fig. 11
Multinuclear astrocytes can survive for long times and enter new cell cycles. a, b Multinuclear astrocytes filled with Lucifer Yellow (LY) at 2 (a) and 4 (b) months after pilocarpine-induced status epilepticus. Note that astrocytes have bushy shape (indicating the presence of many miniature distal processes) and are coupled with neighboring astrocytes (arrows). Insets in lower right parts of images show micronuclei. c Gliotic scar in piriform cortex, 1 year after pilocarpine administration. Note multinucleated astrocyte (arrow) with 4 nuclei. GLT-1immunoreactivity outlines the plasma membrane of the cell body. c1 and c2 – enlarged soma (c1) and nuclei visualized with DAPI (c2). d-i Multinuclear astrocytes enter new cell cycle and mitosis. Hippocampus, 6 months after pilocarpine administration. d Sclerotic hippocampus (arrows indicate the area of neuronal loss and glial scar in the CA1 subfield). Many astrocytes are Ki67+ in dentate gyrus (DG) (d’). e, f Nuclei in multinuclear astrocytes are PCNA+ indicating that cells are entering the cell cycle. Insets show profiles of several nuclei in each cell. In E the arrow indicates an astrocyte with several PCNA+ nuclei. g An astrocyte with two Ki67+ nuclei and condensed chromosomes indicating prophase of mitosis. g’– enlarged image of nuclei in prophase. h Metaphase with several centrosomes stained with γ-tubulin and pericentrin (PC). i An astrocyte with a large group of chromosomes with several spindle-like structures. Inset shows metaphase chromosomes. All images were obtained with confocal microscope. Scale bars: a,b = 15 μm,  c = 20 μm, d = 90 μm, e,f = 30 μm, g = 20 μm, g',h,i = 8 μm
Fig. 12
Fig. 12
Schematic diagram of arrested mitosis (lower panel) in comparison with normal mitosis (upper panel). a Prophase. Due to the enlargement of cell bodies and primary processes in reactive astrocytes, many astral microtubules penetrate into the processes and pull centrosomes away from nuclei (arrow indicates a pulling centrifugal force applied to centrosome). Note that these forces may also pull on the plasma membrane, causing retraction of processes. b Metaphase. In arrested mitosis astral, polar and kinetochore microtubules lack a normal arrangement; several pole-like complexes are formed and include NUMA, γ-tubulin, TPX2; chromosomes cannot be congressed at a metaphase plate and consequently correct segregation is not fulfilled. Note, one chromosome is located outside of the metaphase plate in this diagram . Furthermore, in a normal metaphase, soluble proteins, such as GFAP, vimentin, and alphaB-crystallin, are excluded from the spindle area, whereas in the enlarged astrocytes, however, these proteins are not excluded, and intercalate between chromosomes and spindles (note border between lighter area of spindle and darker cytoplasm in the upper Figure, and the absence of such a border in the lower Figure). c Isolated or groups of chromosomes are covered with nuclear envelopes with formation of micronuclei

References

    1. Alfaro-Aco R, Thawani A, Petry S. Structural analysis of the role of TPX2 in branching microtubule nucleation. J Cell Biol. 2017;216:983–997. doi: 10.1083/jcb.201607060. - DOI - PMC - PubMed
    1. Arai H, Atomi Y. Chaperone activity of alpha B-crystallin suppresses tubulin aggregation through complex formation. Cell Struct Funct. 1997;22:539–544. doi: 10.1247/csf.22.539. - DOI - PubMed
    1. Ballester LY, Boghani Z, Baskin DS, Britz GW, Olsen R, Fuller GN, Powell SZ, Cykowski MD. Creutzfeldt astrocytes may be seen in IDH-wildtype glioblastoma and retain expression of DNA repair and chromatin binding proteins. Brain Pathol. 2018;28:1012–1019. doi: 10.1111/bpa.12604. - DOI - PMC - PubMed
    1. Barral S, Beltramo R, Salio C, Aimar P, Lossi L, Merighi A. Phosphorylation of histone H2AX in the mouse brain from development to senescence. Int J Mol Sci. 2014;15:1554–1573. doi: 10.3390/ijms15011554. - DOI - PMC - PubMed
    1. Barretta ML, Spano D, D'Ambrosio C, Cervigni RI, Scaloni A, Corda D, Colanzi A. Aurora-a recruitment and centrosomal maturation are regulated by a Golgi-activated pool of Src during G2. Nat Commun. 2016;7:11727. doi: 10.1038/ncomms11727. - DOI - PMC - PubMed

Publication types

LinkOut - more resources