Multicenter Study
. 2020 Apr 9;61(4):10.
doi: 10.1167/iovs.61.4.10.

Comparing Structure-Function Relationships Based on Drasdo's and Sjöstrand's Retinal Ganglion Cell Displacement Models

Affiliations
Multicenter Study

Comparing Structure-Function Relationships Based on Drasdo's and Sjöstrand's Retinal Ganglion Cell Displacement Models

Kazunori Hirasawa et al. Invest Ophthalmol Vis Sci. .

Abstract

Purpose: To compare structure-function relationships based on the Drasdo and Sjöstrand retinal ganglion cell displacement models.

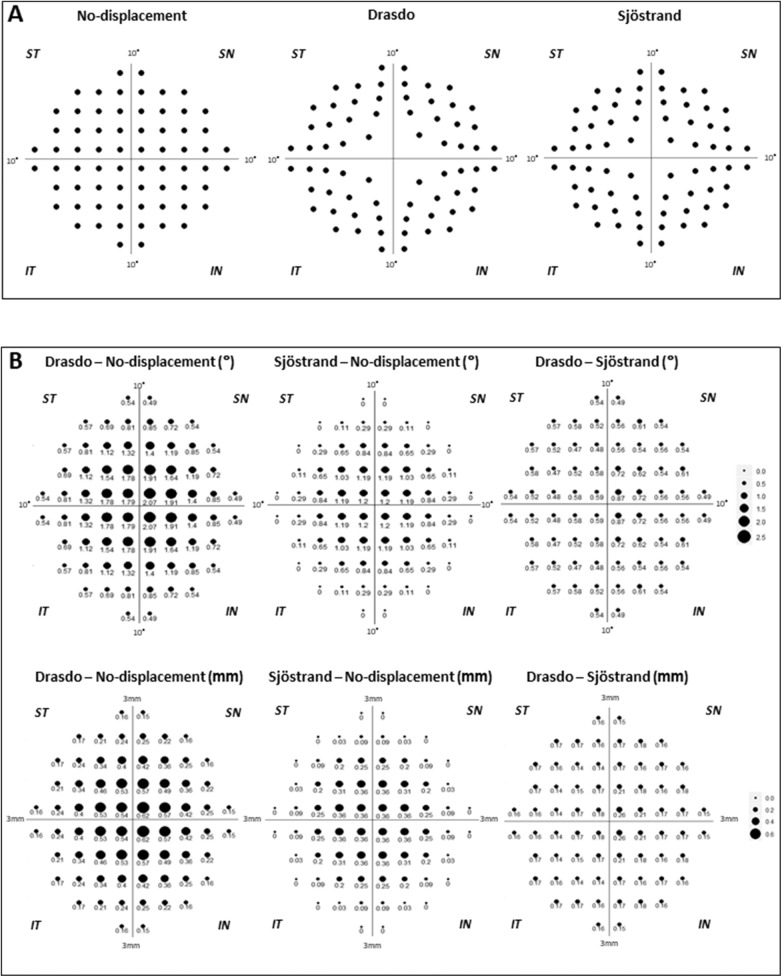
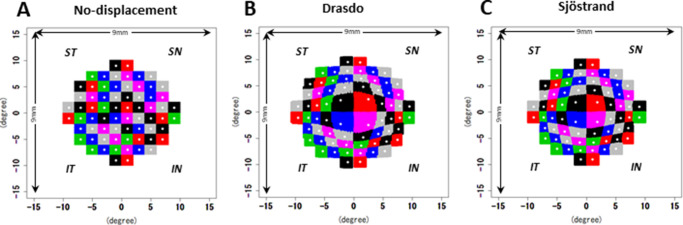
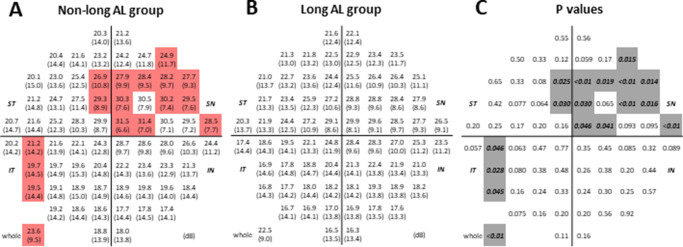
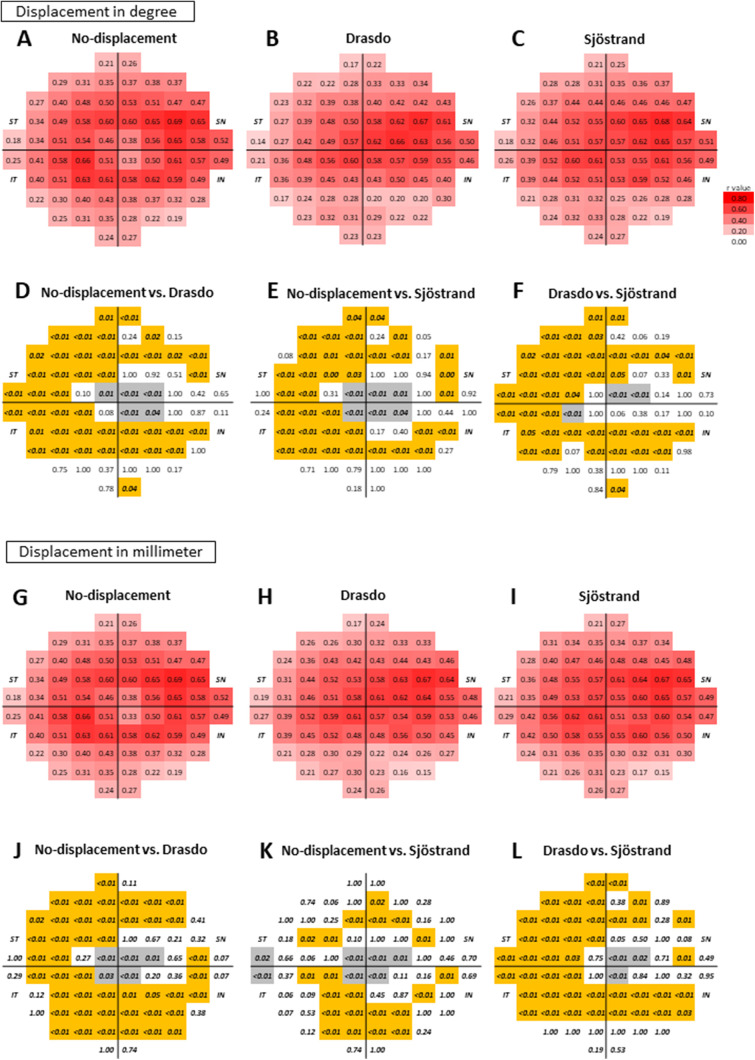
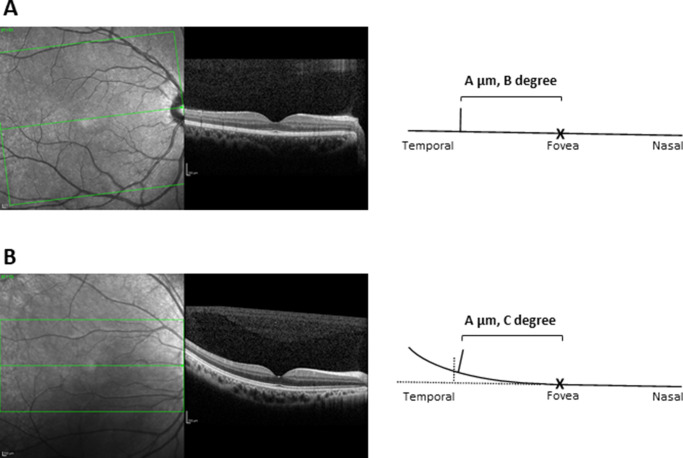
Methods: Single eyes from 305 patients with glaucoma and 55 heathy participants were included in this multicenter, cross-sectional study. The ganglion cell and inner plexiform layer (GCIPL) thickness was measured using spectral domain optical coherence tomography. Visual field measurements were performed using the Humphrey 10-2 test. All A-scan pixels (128 × 512 pixels) were allocated to the closest 10-2 location with both displacement models using degree and millimeter scales. Structure-function relationships were investigated between GCIPL thickness and corresponding visual sensitivity in nonlong (160 eyes) and long (200 eyes) axial length (AL) groups.

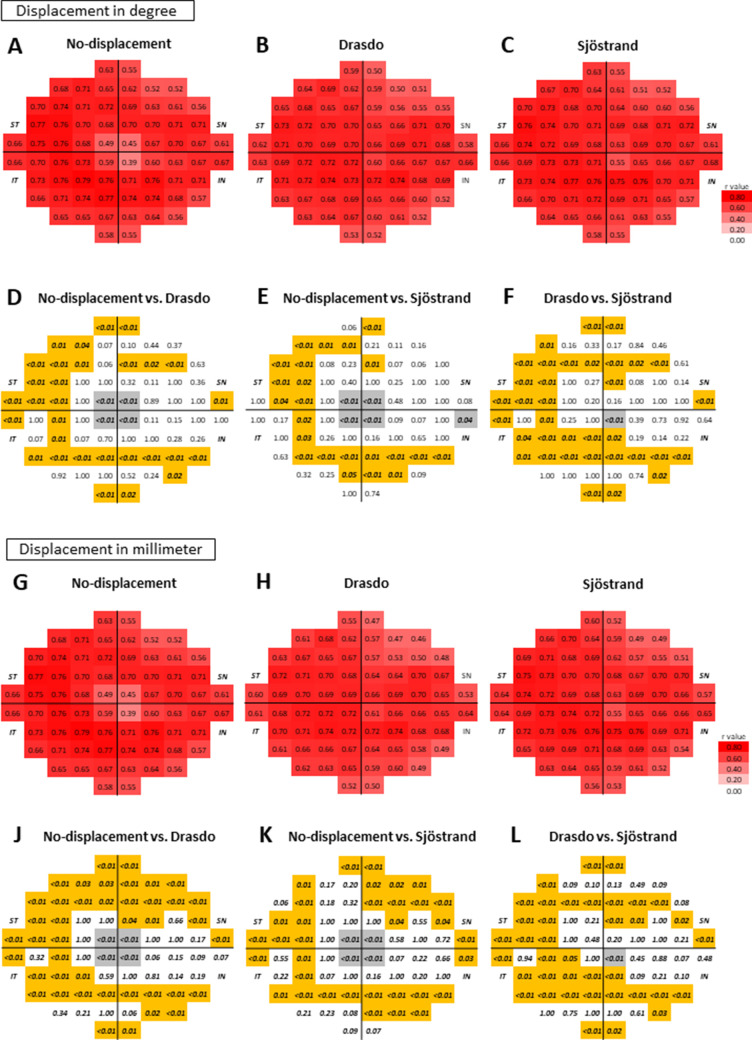
Results: In both the nonlong and long AL groups, compared with the no-displacement model, both the Drasdo and the Sjöstrand models showed that the structure-function relationship around the fovea improved (P < 0.05). The magnitude of improvement in the area was either comparable between the model or was larger for the Drasdo model than the Sjöstrand model (P < 0.05). Meanwhile, structure-function relationships outside the innermost retinal region that were based on the Drasdo and Sjöstrand models were comparable to or were even worse than (in the case of the Drasdo model) those obtained using the no-displacement model.

Conclusions: Structure-function relationships evaluated based on both the Drasdo and Sjöstrand models significantly improved around the fovea, particularly when using the Drasdo model. This was not the case in other areas.


Conflict of interest statement

Disclosure: K. Hirasawa, None; M. Matsuura, None; Y. Fujino, None; M. Yanagisawa, None; T. Kanamoto, None; K. Inoue, None; M. Nagumo, None; J. Yamagami, None; T. Yamashita, None; H. Murata, None; R. Asaoka, None

Figures

Figure 1.
Figure 1.
The 10-2 visual field test locations after RGC displacement and the difference in the extent of RGC displacement with each model. (A) The no-displacement, Drasdo, and Sjöstrand models are shown from left to right. (B) The differences in the extent of RGC displacement in the model are indicated by the sizes of the circles and numbers in degrees (top) and millimeters (bottom). The numbers under the circles are expressed as degrees. All data are shown as retinal views of the right eye. ST, superior temporal; SN, superior nasal; IT, inferior temporal; IN, inferior nasal.
Figure 2.
Figure 2.
The method used to allocate all A-scan pixels (65,536 pixels) to the 10-2 test locations. (A) A 2-degree square corresponding to each 10-2 test location was applied to the no-displacement model. For the Drasdo (B) and the Sjöstrand (C) models, all original A-scan locations within a 2-degree square were displaced by both models, and then the closest locations corresponding with the original A-scan locations were calculated. All data are shown as retinal views of the right eye.
Figure 3.
Figure 3.
The mean visual field sensitivity and standard deviations obtained in the nonlong and long axial length groups. The mean VF sensitivity (upper) and its standard deviation (lower) are shown as decibels in the nonlong (A) and long (B) AL groups, as indicated. The locations shown in red indicate that the mean VF sensitivity in the nonlong AL group was significantly higher than that obtained in the long AL group. (C) The P values were calculated by the Wilcoxon rank sum test. The locations shown in gray indicate a significant difference in the mean VF sensitivity between the nonlong and long AL groups. All data are shown as retinal views of the right eye.
Figure 4.
Figure 4.
The correlation coefficients between the ganglion cell inner plexiform layer thickness and visual field sensitivity with the displacement calculation in degrees and millimeters in the nonlong axial length group. The correlation coefficients (AC: displacement in degrees and GI: displacement in millimeters) of the nonlong axial length group are shown as r values with a color scale. The P values (DL) are shown below correlation coefficients to compare the correlation coefficients between each model. The P values written in italic bold letters indicate P values that were less than 0.05. The locations shown in gray indicate that the structure-function relationships based the Drasdo and Sjöstrand models were better than those of the no-displacement model and that the structure-function relationship based on the Drasdo model was better than that of the Sjöstrand model. In contrast, the locations shown in orange indicate that the structure-function relationship based on the Drasdo and Sjöstrand models was worse than those of the no-displacement model, while those based on the Drasdo model were worse than those based on the Sjöstrand model. All data are shown as retinal views of the right eye.
Figure 5.
Figure 5.
The correlation coefficients between the ganglion cell inner plexiform layer thickness and visual field sensitivity with the displacement calculation in degrees and millimeters in the long axial length group. The correlation coefficients calculated as degrees (AC: displacement in degree scale and GI: displacement in millimeters) of the long axial length group are shown with a color scale. The P values (DL) are shown below correlation coefficients to compare the correlation coefficients between each model. The P values written in italic bold font indicate that the P value was less than 0.05. The locations shown in gray indicate that the structure-function relationships based on the Drasdo and Sjöstrand models were better than those obtained by the no-displacement model, while those based on the Drasdo model were better than those based on the Sjöstrand model. In contrast, the locations shown in orange indicate that the structure-function relationships based on the Drasdo and Sjöstrand models were worse than those based on the no-displacement model and that the structure-function relationships based on the Drasdo model were worse than those obtained by the Sjöstrand model. All data are shown as retinal views of the right eye.
Figure 6.
Figure 6.
Influence of temporal retinal tilt on displacement. Representative images of a “flat retina” (A) and a “tilted retina” (B) measured with OCT. Retinal tilt only subtly influenced results in the “flat retina” (A). In contrast, the discrepancy between the displacement in the distance and that found for the angle becomes large in the “tilted retina” (B). For example, OCT (Spectralis; Heidelberg Engineering GmbH, Heidelberg, Germany) images were not obtained from the studied eyes in the current study.

References

    1. Hood DC, Raza AS, de Moraes CG, Liebmann JM, Ritch R. Glaucomatous damage of the macula. Prog Retin Eye Res. 2013; 32: 1–21. - PMC - PubMed
    1. Drasdo N, Millican CL, Katholi CR, Curcio CA. The length of Henle fibres in the human retina and a model of ganglion receptive field density in the visual field. Vision Res. 2007; 47: 2901–2911. - PMC - PubMed
    1. Curcio CA, Allen KA. Topography of ganglion cells in human retina. J Comp Neurol. 1990; 300: 5–25. - PubMed
    1. Sjöstrand J, Popovic Z, Conradi N, Marshall J. Morphometric study of the displacement of retinal ganglion cells subserving cones within the human fovea. Graefes Arch Clin Exp Ophthalmol. 1999; 237: 1014–1023. - PubMed
    1. Ohkubo S, Higashide T, Udagawa S, et al.. Focal relationship between structure and function within the central 10 degrees in glaucoma. Invest Ophthalmol Vis Sci. 2014; 55: 5269–5277. - PubMed

Publication types

MeSH terms