. 2020 May 8;6(5):1076-1084.
doi: 10.1021/acsinfecdis.9b00464. Epub 2020 Apr 28.

Cultivation-Free Typing of Bacteria Using Optical DNA Mapping

Affiliations

Cultivation-Free Typing of Bacteria Using Optical DNA Mapping

Vilhelm Müller et al. ACS Infect Dis. .

Abstract

A variety of pathogenic bacteria can infect humans, and rapid species identification is crucial for the correct treatment. However, the identification process can often be time-consuming and depend on the cultivation of the bacterial pathogen(s). Here, we present a stand-alone, enzyme-free, optical DNA mapping assay capable of species identification by matching the intensity profiles of large DNA molecules to a database of fully assembled bacterial genomes (>10 000). The assay includes a new data analysis strategy as well as a general DNA extraction protocol for both Gram-negative and Gram-positive bacteria. We demonstrate that the assay is capable of identifying bacteria directly from uncultured clinical urine samples, as well as in mixtures, with the potential to be discriminative even at the subspecies level. We foresee that the assay has applications both within research laboratories and in clinical settings, where the time-consuming step of cultivation can be minimized or even completely avoided.

Keywords: UTI; bacteria; diagnostics; nanofluidics; optical DNA mapping.


Conflict of interest statement

The authors declare no competing financial interest.

Figures
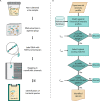
Figure 1
Figure 1
Schematic overview of the optical DNA mapping assay. (A) Experimental outline. Bacteria are isolated and then lysed in agarose plugs to extract large (>100 kb) DNA molecules. The DNA is labeled with YOYO-1 and netropsin in a single step, creating a sequence-specific intensity profile along the DNA. To record the intensity profile, the DNA is confined in a nanofluidic channel and imaged using a fluorescence microscope. The resulting experimental intensity profiles are compared to a reference database, and the bacterial species present in the sample are identified based on profiles that match discriminatively to a single species in the database. (B) Data analysis pipeline. The time-averaged kymographs are matched to the reference database of theoretical intensity profiles generated from complete bacterial genomes. For each experimental intensity profile, the database matches are filtered as follows. First, short intensity profiles are discarded (length < Lmin). Then, the highest-scoring matches are selected (Cmax within the range max(Cmax) to max(Cmax) – Cdiff), and if all of the highest-scoring matches match to a single species, the intensity profile is classified as discriminative. Lastly, discriminative intensity profiles with sufficiently high-scoring matches (max(Cmax) > Cthresh) are reported back to the user. See Methods section for details of how the parameter space of Lmin, Cdiff, and Cthresh was explored, and see Figures 2 and 3 for the results.
Figure 2
Figure 2
Effect of Cdiff and Cthresh on data quality and quantity. Heat maps showing fraction (%) of profiles found to be discriminative out of the total number of mapped molecules (A), and the true positive rate (TPR), i.e., the fraction (%) of the experimental profiles found to be discriminative to the correct species, out of the total number of discriminative profiles (B), as a function of Cdiff and Cthresh.
Figure 3
Figure 3
Effect of Cdiff and fragment size on data quality and quantity. (A) Fraction (%) of experimental profiles found to be discriminative to the correct species out of the total number of discriminative profiles (solid line, dark green), and the fraction (%) of molecules found to be discriminative out of the total number of mapped molecules (dashed line, green), as a function of Cdiff (Cthresh fixed to 0.5). (B) The fraction (%) of the experimental molecules found to be discriminative to the correct species out of the total number of discriminative molecules (solid line, dark brown), and the fraction (%) of molecules found to be discriminative out of the total number of mapped molecules (dashed line, light brown), as a function of fragment size (Cdiff = 0.05, Cthresh = 0.5). One pixel corresponds to approximately 500 bp.
Figure 4
Figure 4
Results for E. coli isolates. Example fits of experimental intensity profiles (green) and their respective highest-scoring theoretical intensity profile (black) for each of the three E. coli isolates (sequence types 93, 10, and 131). The inner circle in the pie charts illustrates the species distribution in the analyzed sample, and the outer circle illustrates the obtained species distribution of the discriminative profiles (the exact number of discriminative profiles specified).
Figure 5
Figure 5
Results for single-species samples and bacterial mixtures. The results obtained from single-species samples (A) and mixed samples (B, ratios specified beneath each chart), where each chart represents one sample. The inner circle illustrates the species distribution in the sample, and the outer circle illustrates the obtained species distribution of the discriminative profiles (with the exact number of discriminative profiles specified). Incorrect matches, i.e., profiles matching discriminatively to a species not present in the sample, are shown in gray.
Figure 6
Figure 6
Noncultured urine samples. The inner circle illustrates the expected species distribution in each sample, and the outer circle illustrates the obtained species distribution of the discriminative profiles (the exact number of discriminative profiles indicated).
Figure 7
Figure 7
Results from the subspecies identification of the E. coli isolates. The inner circle in the pie charts illustrates the expected distribution of E. coli sequence types in each sample, and the outer circle illustrates the obtained distribution of profiles discriminative on the sequence type level (with the exact number of discriminative profiles specified). Note that only one discriminative fragment was obtained for the E. coli isolate belonging to ST10. This is below the required threshold of three discriminative fragments used at the species level.

References

    1. Giljohann D. A.; Mirkin C. A. (2009) Drivers of biodiagnostic development. Nature 462 (7272), 461–4. 10.1038/nature08605. - DOI - PMC - PubMed
    1. Kelley S. O. (2017) What Are Clinically Relevant Levels of Cellular and Biomolecular Analytes?. ACS sensors 2 (2), 193–197. 10.1021/acssensors.6b00691. - DOI - PubMed
    1. Chakravorty S.; Helb D.; Burday M.; Connell N.; Alland D. (2007) A detailed analysis of 16S ribosomal RNA gene segments for the diagnosis of pathogenic bacteria. J. Microbiol. Methods 69 (2), 330–9. 10.1016/j.mimet.2007.02.005. - DOI - PMC - PubMed
    1. Singhal N.; Kumar M.; Kanaujia P. K.; Virdi J. S. (2015) MALDI-TOF mass spectrometry: an emerging technology for microbial identification and diagnosis. Front. Microbiol. 6, 791.10.3389/fmicb.2015.00791. - DOI - PMC - PubMed
    1. Lloyd K. G.; Steen A. D.; Ladau J.; Yin J.; Crosby L. (2018) Phylogenetically Novel Uncultured Microbial Cells Dominate Earth Microbiomes. mSystems 3 (5), e00055-1810.1128/mSystems.00055-18. - DOI - PMC - PubMed

Publication types