. 2020 Apr 14;31(2):107474.
doi: 10.1016/j.celrep.2020.03.038.

BCR-Induced Ca2+ Signals Dynamically Tune Survival, Metabolic Reprogramming, and Proliferation of Naive B Cells

Affiliations

BCR-Induced Ca2+ Signals Dynamically Tune Survival, Metabolic Reprogramming, and Proliferation of Naive B Cells

Corbett T Berry et al. Cell Rep. .

Abstract

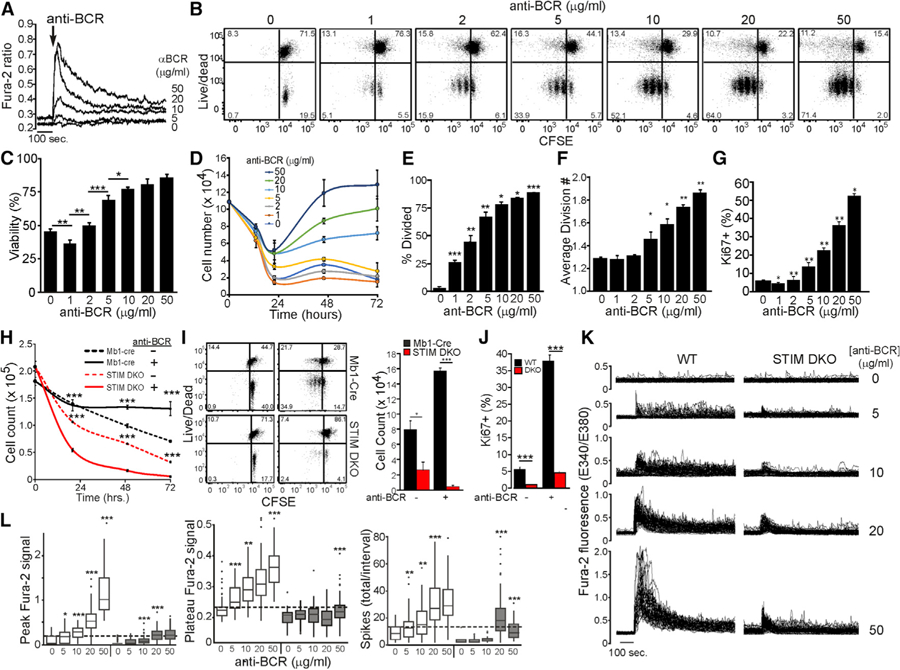
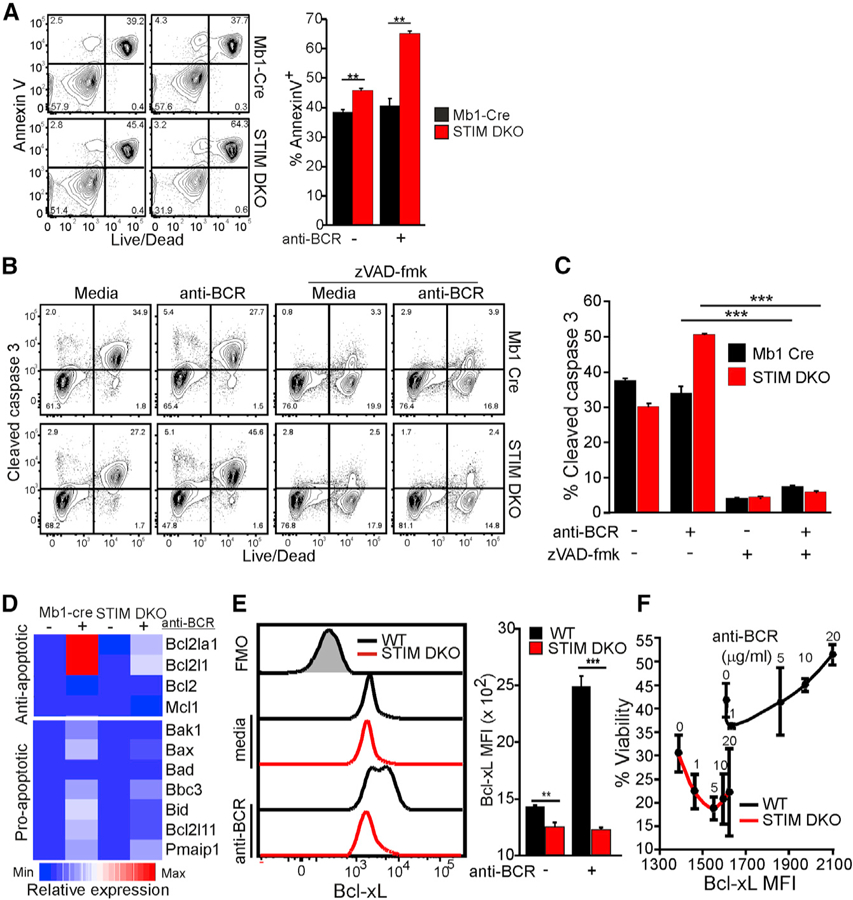
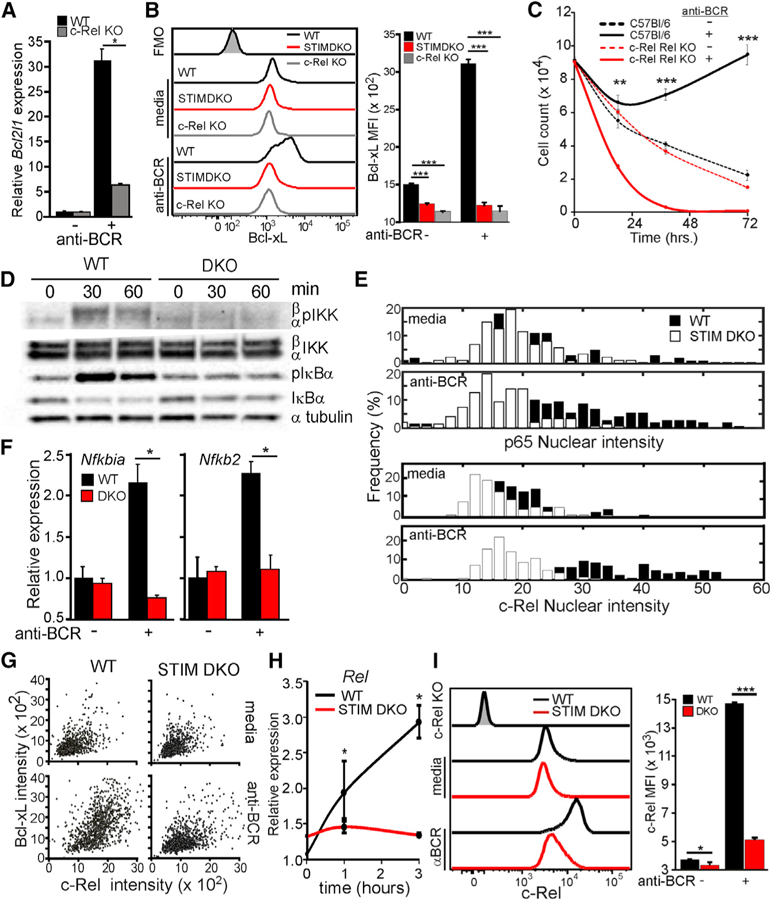
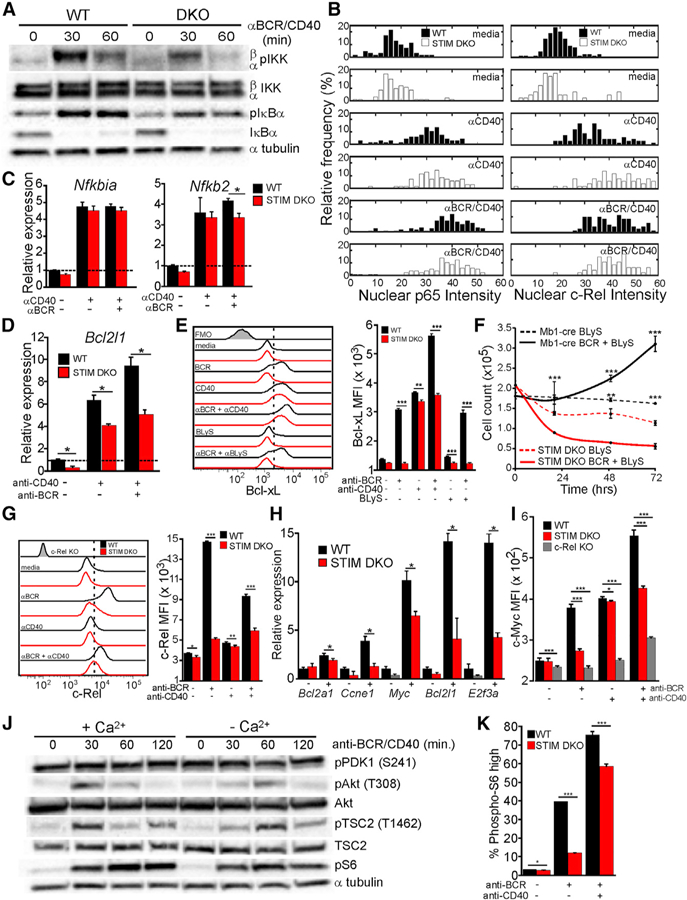
B cell receptor (BCR) engagement induces naive B cells to differentiate and perform critical immune-regulatory functions. Acquisition of functional specificity requires that a cell survive, enter the cell cycle, and proliferate. We establish that quantitatively distinct Ca2+ signals triggered by variations in the extent of BCR engagement dynamically regulate these transitions by controlling nuclear factor κB (NF-κB), NFAT, and mTORC1 activity. Weak BCR engagement induces apoptosis by failing to activate NF-κB-driven anti-apoptotic gene expression. Stronger signals that trigger more robust Ca2+ signals promote NF-κB-dependent survival and NFAT-, mTORC1-, and c-Myc-dependent cell-cycle entry and proliferation. Finally, we establish that CD40 or TLR9 costimulation circumvents these Ca2+-regulated checkpoints of B cell activation and proliferation. As altered BCR signaling is linked to autoimmunity and B cell malignancies, these results have important implications for understanding the pathogenesis of aberrant B cell activation and differentiation and therapeutic approaches to target these responses.

Keywords: Bcl-xL; CD40; NFAT; Orai1; STIM1; apoptosis; c-Myc; c-Rel; mTORC1; nuclear factor kappa B.


Conflict of interest statement

Declaration of Interests The authors declare no competing interests.

Figures

Figure 1.
Figure 1.. Ca2+ Signals Encode BCR Signal Strength to Regulate B Cell Activation
(A) Fura-2 ratiometric imaging of intracellular Ca2+ in WT CD23+ B cells stimulated with anti-BCR as indicated. Average results are representative of three independent experiments with >50 cells per condition. (B) CFSE-labeled WT CD23+ B cells were stimulated in complete media with anti-BCR for 72 h as indicated. Carboxyfluorescein succinimidyl ester (CFSE) dilution and live/dead plots are representative of triplicate experiments. (C and D) Viability of WT CD23+ B cells as determined by the proportion of live/dead cells at 22 h (C) and total number of live cells at each initial anti-BCR concentration for each time point (D) (mean ± SD from triplicate wells). (E and F) The proportion of divided cells (E) and average division number (F) for data shown in (B) (mean ± SD from triplicate wells). (G) Ki67 expression in WT CD23+ B cells stimulated for 32 h with anti-BCR as indicated (mean percentage ± SD from triplicate wells; statistical comparisons to adjacent [lower] concentration of anti-BCR). (H) Total cell counts at indicated times are plotted for each condition (mean cell number ± SD of triplicate wells). CFSE-labeled CD23+ B cells from Stim1wt/ wtStim2wt/wtMb1cre+ (Mb1-Cre) and Stim1fl/flStim2fl/flMb1cre+ (STIM DKO) mice were unstimulated or stimulated for 72 h with anti-BCR. (I)C FSE dilution versus live/dead plot (left) is representative of results from triplicate wells (right) at 72 h. (J) Ki67 expression (mean ± SD of triplicate wells) 32 h after anti-BCR stimulation of WT and STIM DKO B cells. (K) Fura-2 ratiometric imaging of cytoplasmic [Ca2+] in WT and STIM DKO B cells stimulated with anti-BCR as indicated. Each line depicts the response of a single cell. (L) Boxplot representation of mean initial peak (upper left), average sustained concentration (between 10 and 15 min, upper right), and total spikes (lower left) in WT and STIM DKO B cells. Results are representative of three independent experiments with >50 cells per genotype/treatment, and statistical comparisons were made to adjacent (lower) concentration of anti-BCR. For all figures, *p < 0.05, **p < 0.01, ***p < 0.001.
Figure 2.
Figure 2.. STIM/Orai-Dependent Ca2+ Signals Promote B Cell Survival through Induction of Bcl-xL Expression
WT and STIM DKO CD23+ B cells were cultured in complete media in the absence or presence of anti-BCR. (A) Annexin V and live/dead staining at 24 h of culture. (Left) Representative plot (right) and quantification of mean percentage of Annexin-V-stained cells (±SD from triplicate wells) are shown. (B and C) Flow cytometric analysis of intracellular cleaved caspase-3 at 12 h. The impact of the pan-caspase inhibitor zVAD-fmk (100 µM) on B cell viability was determined 12 h after anti-BCR stimulation. (B) Representative cytometry plot (B) and percentage (mean ± SD) of cleaved caspase-3-stained cells from triplicate wells (C). (D) Heatmap shows relative gene expression of anti-and pro-apoptotic genes based upon qRT-PCR analysis following culture as indicated for 6 h. Average expression from triplicate wells relative to Mb1-cre unstimulated (controls). (E) Intracellular Bcl-xL expression (Fluorescence minus one (FMO), gray shaded histogram, left) in anti-BCR stimulated WT and STIM DKO B cells at 6 h (right, Bcl-xL MFI ± SD from triplicate wells). (F) Bcl-xL mean fluorescence intensity (6 h) in CD23+ B cells from WT (black line) and STIM DKO (red line) mice stimulated with anti-BCR (at indicated concentration) plotted versus viability (24 h, % live cells ± SD from triplicate wells and duplicate cultures). For all figures, *p < 0.05, **p < 0.01, ***p < 0.001. See also Figure S1.
Figure 3.
Figure 3.. Ca2+ Entry Regulates NF-κB-Dependent Anti-apoptotic Gene Expression
(A) Bcl2l1 expression after 6 h of anti-BCR stimulation in CD23+ B cells from WT and c-Rel KO mice (mean ± 95% confidence interval; *, statistically significant). (B) Intracellular Bcl-xL protein levels (relative to FMO, gray shaded histogram) in CD23+ B cells from WT (black line), STIM DKO (gray line), and c-Rel KO (red line) mice 6 h after anti-BCR stimulation (left) and mean (median flourescence intensity (MFI) ± SD from triplicate wells) Bcl-xL fluorescence intensity (right). (C) CD23+ B cells from WT (solid line) and c-Rel KO (dashed line) mice were cultured for indicated times in media alone or media containing anti-BCR. The total number of live cells was enumerated, and mean cell number (±SD of triplicate wells) is plotted for the indicated time points. (D) Immunoblot of anti-BCR-dependent NF-κB activation in CD23+ WT and STIM DKO B cells at indicated time points. (E) p65 (top) and c-Rel (bottom) nuclear localization in unstimulated (media) and anti-BCR stimulated (2 h) WT (black) and STIM DKO (white) B cells. Overlay of average c-Rel and p65 nuclear cell intensity (>70 cells per group) is shown.(F) Nfkbia (IκBα) and Nfkb2 (p100) mRNA expression in CD23+ B cells from WT and STIM DKO mice cultured for 3 h in the presence or absence of anti-BCR (mean ± 95% confidence interval; *, statistically significant). (G) Scatterplot of c-Bcl-xL and Rel expression in individual WT (left) and STIM DKO (right) B cells cultured in the absence (media) and presence of anti-BCR for 20 h. (H) Time course of anti-BCR-induced Rel expression in CD23+ B cells from WT and STIM DKO mice (mean ± 95% confidence interval; *, statistically significant). (I) c-Rel expression in WT (black line) and STIM DKO (red line) B cells cultured for 12 h with anti-BCR. (Left) Mean c-Rel MFI (±SD from triplicate wells, right). For all figures except where indicated, *p < 0.05, **p < 0.01, ***p < 0.001. See also Figure S2.
Figure 4.
Figure 4.. Ca2+ Is Required for mTORC1-and Myc-Dependent Cell-Cycle Entry
(A and B) Intracellular phosphorylated S6 (pS6) (A) and c-Myc protein expression (B) in WT and STIM DKO at 4 h of stimulation with anti-BCR (mean percentage ± SD from triplicate wells). (C) pS6 expression in Myc+ and Myc B cells (top, from B) and Myc expression in phospho-S6 ‘‘high’’ and phospho-S6 ‘‘low’’ populations (bottom, from A). (D) Cell size (Forward scatter area or FSC-A) of anti-BCR-stimulated WT and STIM DKO B cells (32 h) and impact of the mTORC1 inhibitor rapamycin (25 nM). (E) Cell size from (D) (mean FSC-A ± SD from triplicate wells). (F) Ki67 expression (mean ± SD of triplicate wells) in WT and STIM DKO B cells following 32 h of anti-BCR and the impact of rapamycin (25 nM). (G) CFSE dilution analysis of the proliferative dynamics of anti-BCR-stimulated WT B cells in the absence or presence of rapamycin (25 nM) or torin-1 (100 nM). Results are representative of triplicate measurements. (H) Time course of Myc expression in CD23+ B cells from WT (black line) and STIM DKO (red line) mice stimulated with anti-BCR (mean ± 95% confidence interval; *, statistically significant). (I) c-Myc expression in CD23+ B cells from Ikk2fl/fl 3 Mb1cre (WT, black line) and Ikk2fl/fl 3 Mb1cre+ (IKKβ KO, red line) mice stimulated with anti-BCR (6 h) in the absence or presence of FK506 (1 µM). Mean percentage of Myc+ cells (±SD of triplicate measurements) is shown. (j) Immunoblot of mTORC1 activity in B cells stimulated with anti-BCR in the presence and absence of extracellular Ca2+. (K) Densiometric analysis of phospho-TSC2-Thr1462 and phospho-S6 (from J). For all figures, *p < 0.05, **p < 0.01, ***p < 0.001. See also Figure S3.
Figure 5.
Figure 5.. BCR-Induced Ca2+ Signals Tune mTORC1, NF-κB, and NFAT Activity
(A) Immunoblot analysis of S6 kinase phosphorylation (pS6K) in WT and STIM DKO B cells following stimulation with anti-BCR for times indicated. (B) pS6K and S6 phosphorylation (pS6) following anti-BCR stimulation of WT B cells cultured in media containing 0 mM Ca2+ and 2 mM Ca2+ and in cells loaded with membrane-permeant Ca2+ chelator (BAPTA) in 0 mM Ca2+ medium. (C) Anti-BCR dose dependence of pS6 in WT and STIM DKO at 6 h (mean percentage ± SD from triplicate wells are representative of two independent experiments). (D) Boxplot representation of initial peak (left), average plateau/sustained concentration (from 10 to 15 min after anti-BCR, middle), and total Ca2+ spikes (20-min interval, right) in WT B cells stimulated in media containing indicated [Ca2+]. Results are representative of three independent experiments with >50 cells per genotype and treatment. (E) Extracellular Ca2+ dependence of Rel, Nfkbia, Myc, and Irf4 mRNA expression 4 h after anti-BCR stimulation in media containing 0, 0.05, 0.2, 0.5, and 2.0 mM Ca2+ (mean ± 95% confidence interval; *, statistically significant). (F) Anti-BCR dose-dependent expression of c-Myc, Irf4, and c-Rel protein in WT and STIM DKO at 6 h (mean percentage ± SD of triplicate measurements; representative of at least two independent experiments0. For (C), (D), and (F), statistical significance was determined relative to preceding concentration of anti-BCR or extracellular [Ca2+]. For all figures, *p < 0.05, **p < 0.01, ***p < 0.001.
Figure 6.
Figure 6.. CD40 Costimulation Promotes B Cell Survival and Proliferation
(A) D23+ B cells from WT (black) and STIM DKO (red) mice were cultured for indicated times in media containing anti-CD40 ± anti-BCR. The total number of live cells was enumerated, and mean cell numbers (±SD of triplicate wells) are plotted for the indicated time points. (B) Intracellular cleaved caspase-3 in live and dead anti-BCR-stimulated WT and STIM DKO B cells (24 h). (C) Frequency of cells containing cleaved caspase-3 from (B) (mean percentage ± SD of triplicate measurements). (D) Cell size (FSC-A) analysis of WT and STIM DKO B cells stimulated with anti-BCR and anti-CD40 (results from triplicate wells and two independent experiments). (E) CFSE dilution and live/dead analysis of WT and STIM DKO CD23+ B cells stimulated as indicated for 72 h. Plots are representative of results from triplicate wells. (F) Total live cells from (E) (mean ± SD from triplicate wells). (G) Ki67 expression in WT and STIM DKO B cells following 32-h stimulation with anti-BCR in the absence or presence of anti-CD40 (mean percentage ± SD of Ki67+ cells from triplicate wells from at least two independent experiments). (H) Percentage of divided cells and mean division number for data shown in (E) (mean ± SD from triplicate wells). For all figures, *p < 0.05, **p < 0.01, ***p < 0.001. See also Figure S4.
Figure 7.
Figure 7.. Ca2+-Independent Activation of Canonical NF-κB and mTORC1 by CD40 Promotes B Cell Survival and Proliferation
(A) Immunoblot analysis of canonical NF-κB activation in CD23+ WT and STIM DKO B cells stimulated with anti-BCR and anti-CD40 at indicated time points. (B) NF-κB p65 (left) and c-Rel (right) nuclear intensity in WT (black) and STIM DKO (white) B cells (>70 cells per group) stimulated as indicated. (C and D) (C) Nfkbia (IκBα) and Nfkb2 (p100) and (D) Bcl2l1 (Bcl-xL) mRNA expression in CD23+ B cells from WT and STIM DKO mice stimulated for 3 h with anti-CD40 alone or anti-CD40 and anti-BCR (mean ± 95% confidence interval; *, statistically significant). (E) Bcl-xL expression in WT (black line) and STIM DKO (red line) B cells after 6 h of anti-BCR in the absence or presence of BLyS (100 ng/mL) and the absence or presence of anti-CD40 (left) and plot of mean Bcl-xL MFI (±SD) from triplicate wells (right). (F) Impact of BLyS (100 ng/mL) on the viability of unstimulated and anti-BCR-stimulated WT and STIM DKO B cells (mean cell number ± SD of triplicate wells). (G) c-Rel expression in WT (black line) and STIM DKO (red line) B cells stimulated as indicated for 12 h. Average MFI (±SD) of triplicate wells (right) is shown. (H) Expression of c-Rel target genes Bcl2a1 (A1), Ccne1 (Cyclin E), Myc (c-Myc), Bcl2l1, and E2f3a (E2f3) in WT (black) and STIM DKO B cells (red) 24 h following stimulation with anti-BCR and anti-CD40 (mean ± 95% confidence interval; *, statistically significant). (I) c-Myc expression in WT (black line), STIM DKO (red line), and c-Rel KO (gray) B cells following 20 h of culture with no stimulus (media), anti-BCR, or anti-BCR/CD40. (J) Immunoblot of mTORC1 activity in B cells stimulated with anti-BCR and anti-CD40 in Ca2+ containing (2 mM) or Ca2+-free medium. (K) Plot of phospho-S6 (pS6)-positive WT (black) and STIM DKO (red) B cells at 20 h of anti-BCR or anti-BCR/CD40 stimulation (mean percentage ± SD from triplicate wells). For all figures except where indicated, *p < 0.05, **p < 0.01, ***p < 0.001.

References

    1. Ahonen C, Manning E, Erickson LD, O’Connor B, Lind EF, Pullen SS, Kehry MR, and Noelle RJ (2002). The CD40-TRAF6 axis controls affinity maturation and the generation of long-lived plasma cells. Nat. Immunol 3, 451–456. - PMC - PubMed
    1. Akkaya M, Traba J, Roesler AS, Miozzo P, Akkaya B, Theall BP, Sohn H, Pena M, Smelkinson M, Kabat J, et al. (2018). Second signals rescue B cells from activation-induced mitochondrial dysfunction and death. Nat. Immunol 19, 871–884. - PMC - PubMed
    1. Baba Y, and Kurosaki T (2016). Role of calcium signaling in B cell activation and biology. Curr. Top. Microbiol. Immunol 393, 143–174. - PubMed
    1. Bajpai UD, Zhang K, Teutsch M, Sen R, and Wortis HH (2000). Bruton’s tyrosine kinase links the B cell receptor to nuclear factor kappaB activation. J. Exp. Med 191, 1735–1744. - PMC - PubMed
    1. Benschop RJ, Melamed D, Nemazee D, and Cambier JC (1999). Distinct signal thresholds for the unique antigen receptor-linked gene expression programs in mature and immature B cells. J. Exp. Med 190, 749–756. - PMC - PubMed

Publication types

MeSH terms