. 2020 Apr 14;31(2):107502.
doi: 10.1016/j.celrep.2020.03.066.

Molecular Analysis of Clinically Defined Subsets of High-Grade Serous Ovarian Cancer

Affiliations

Molecular Analysis of Clinically Defined Subsets of High-Grade Serous Ovarian Cancer

Sanghoon Lee et al. Cell Rep. .

Abstract

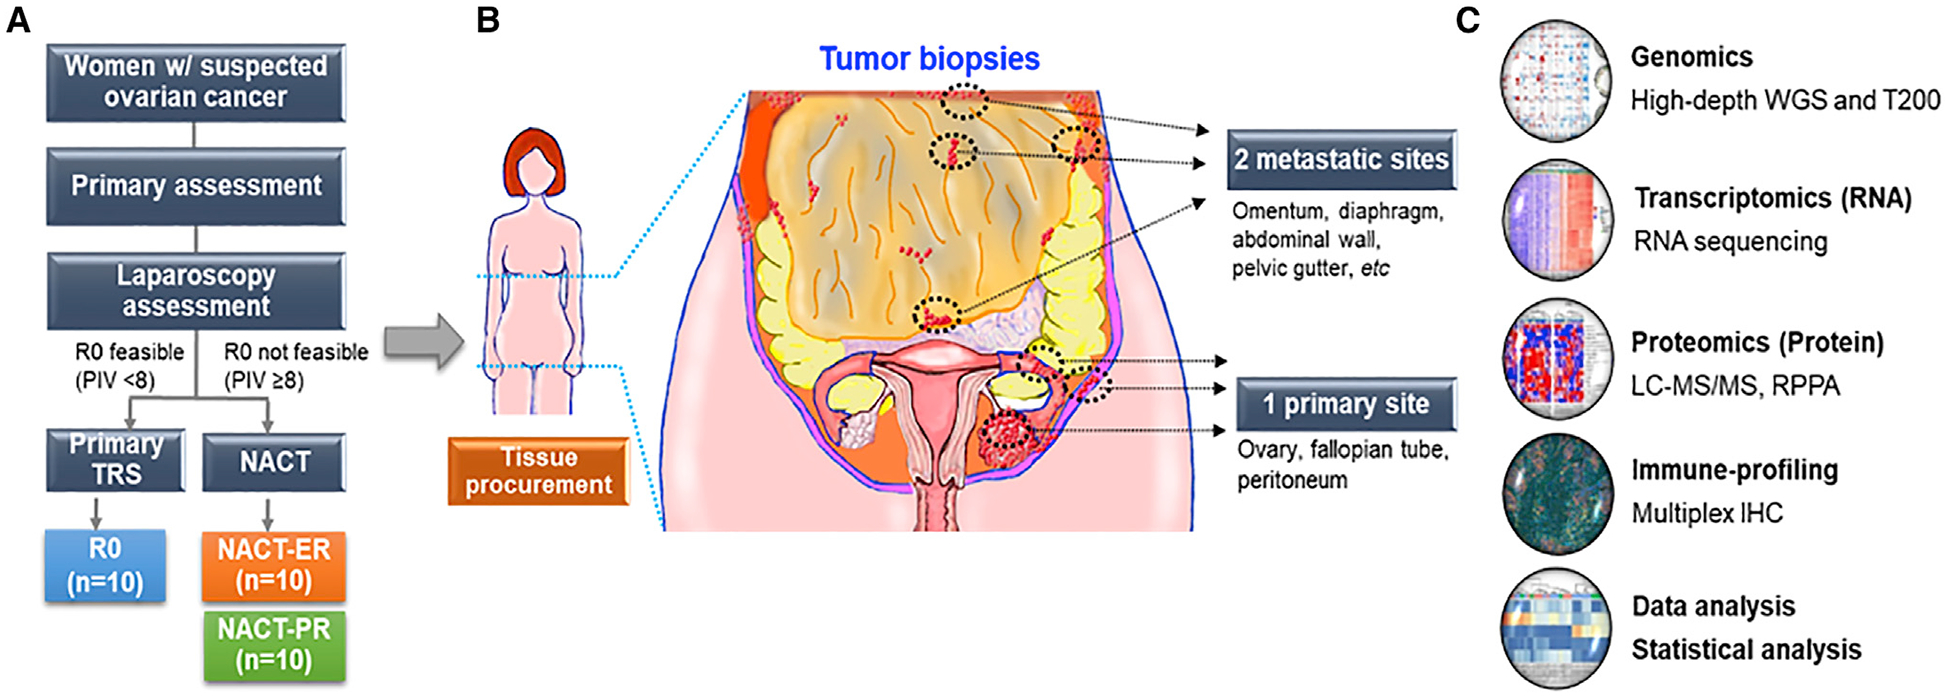
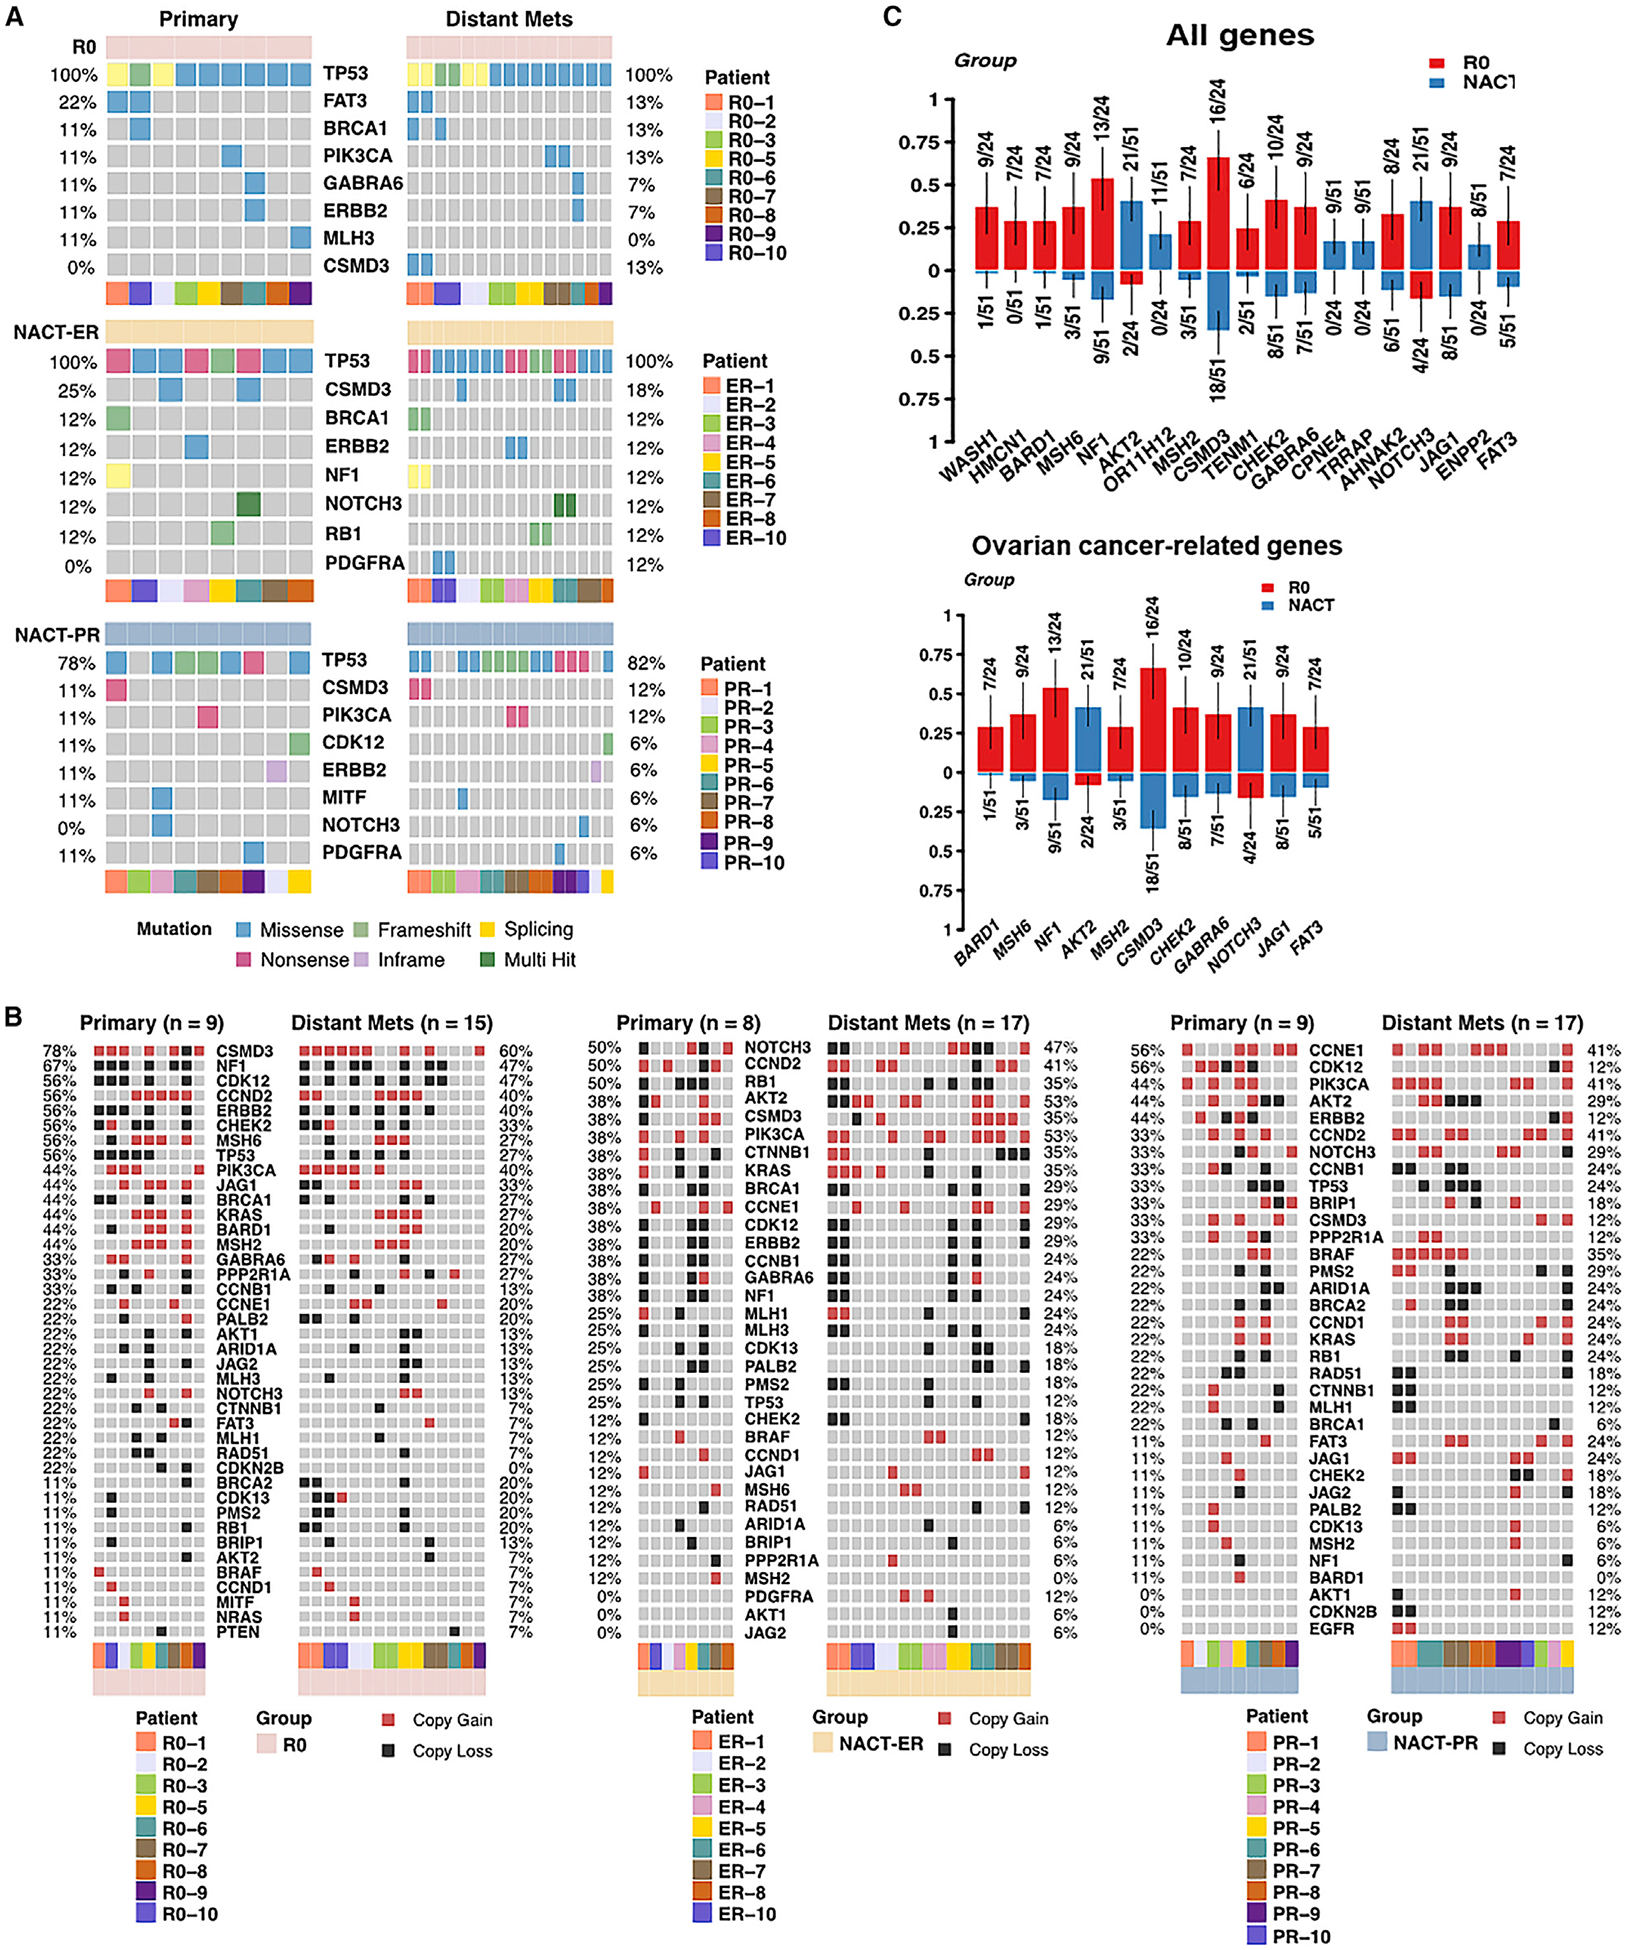
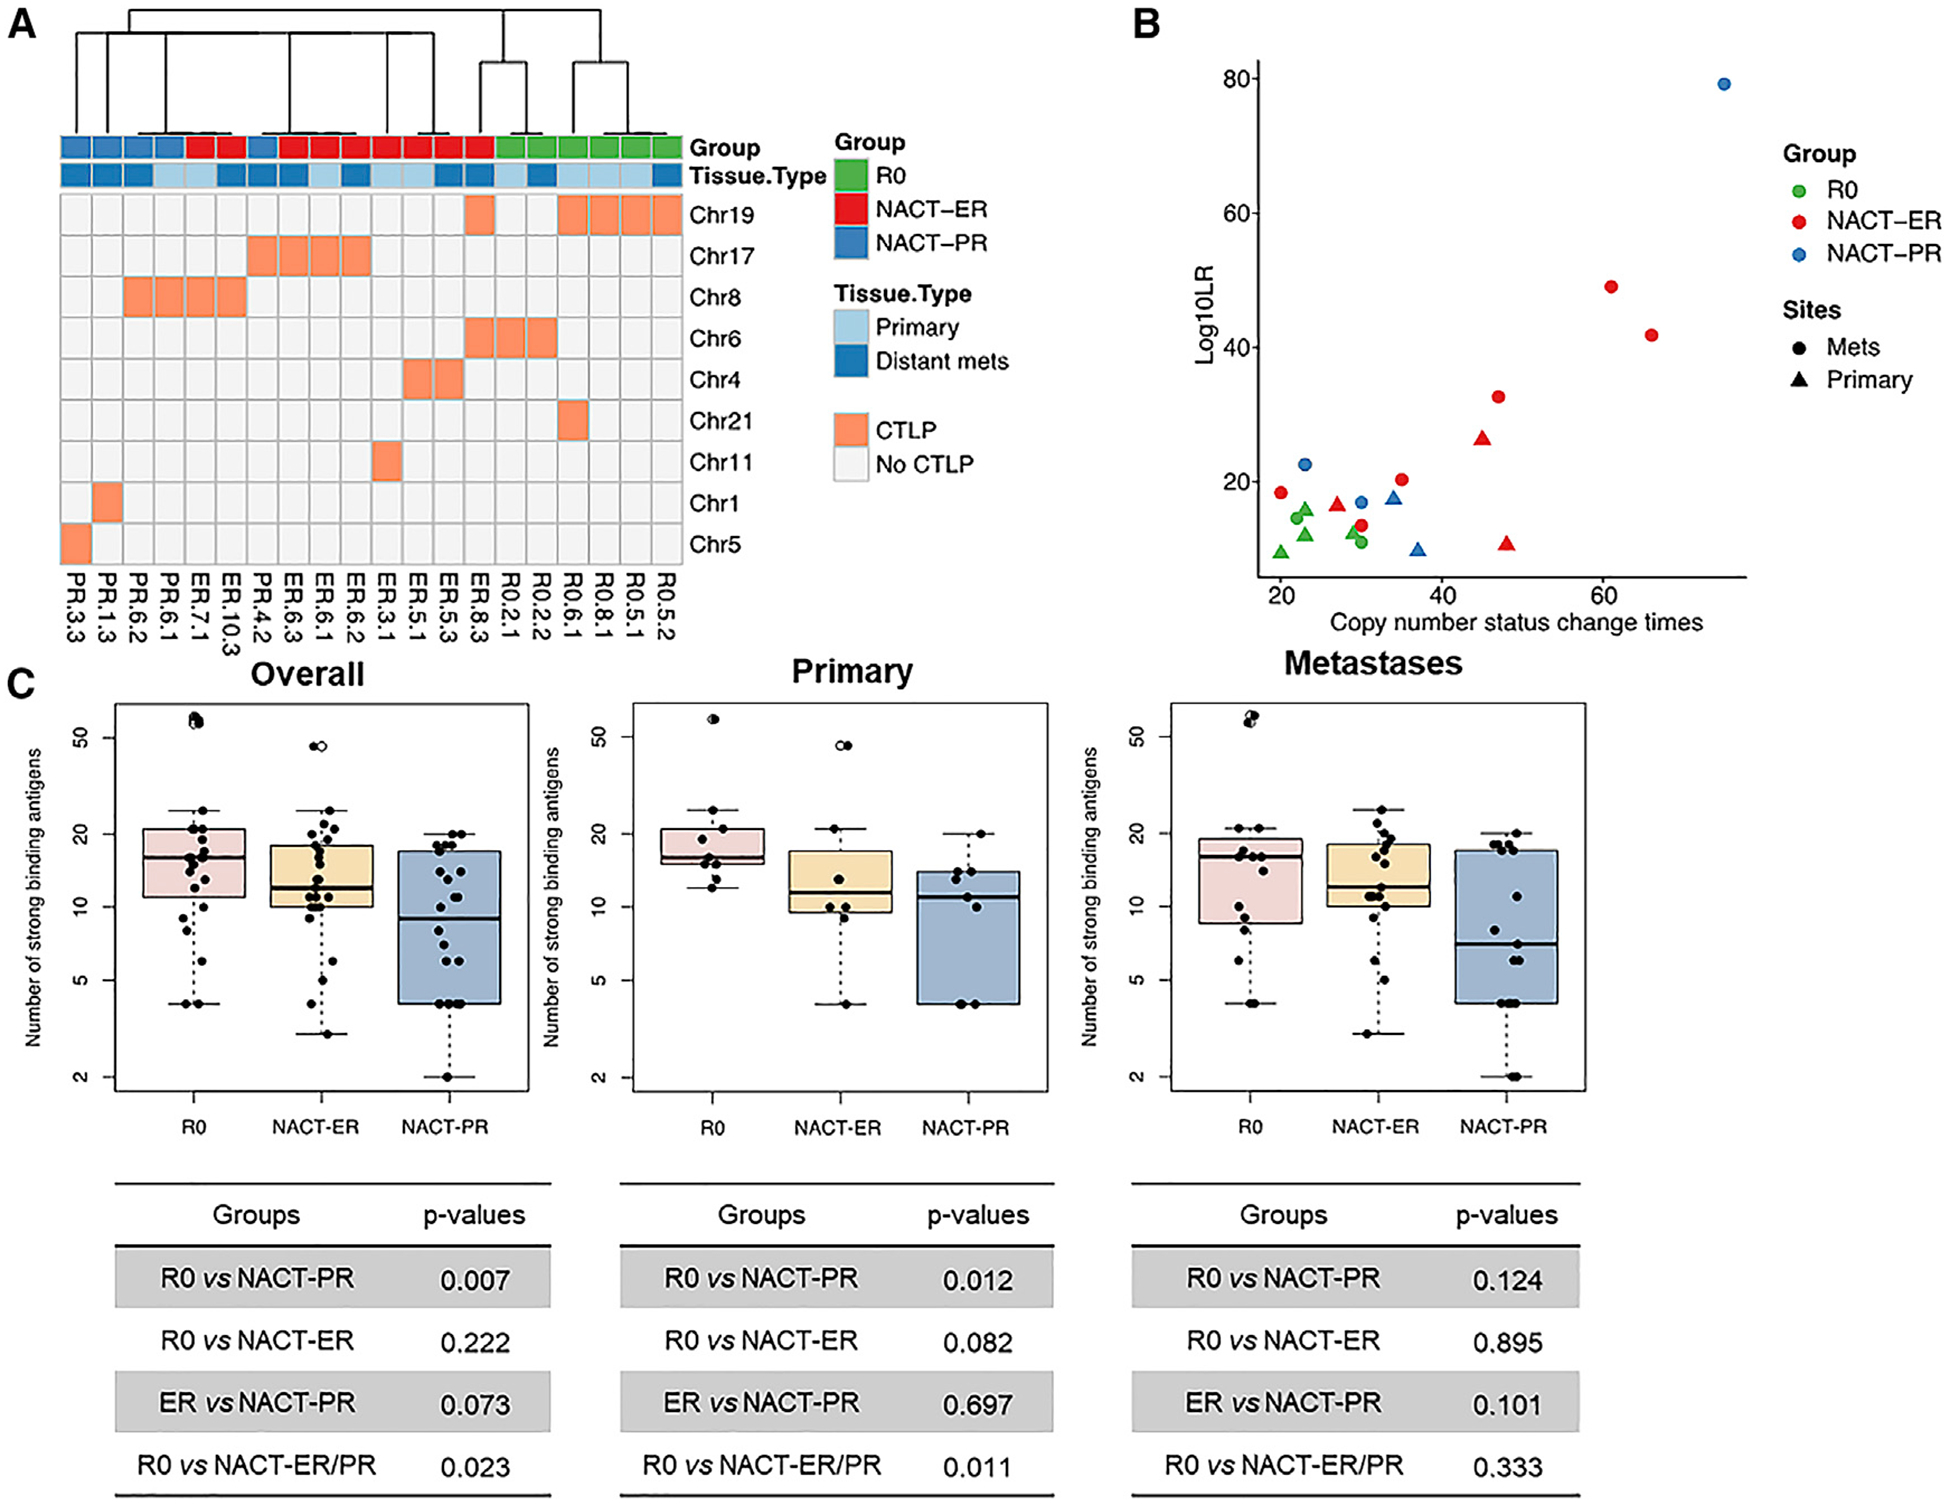
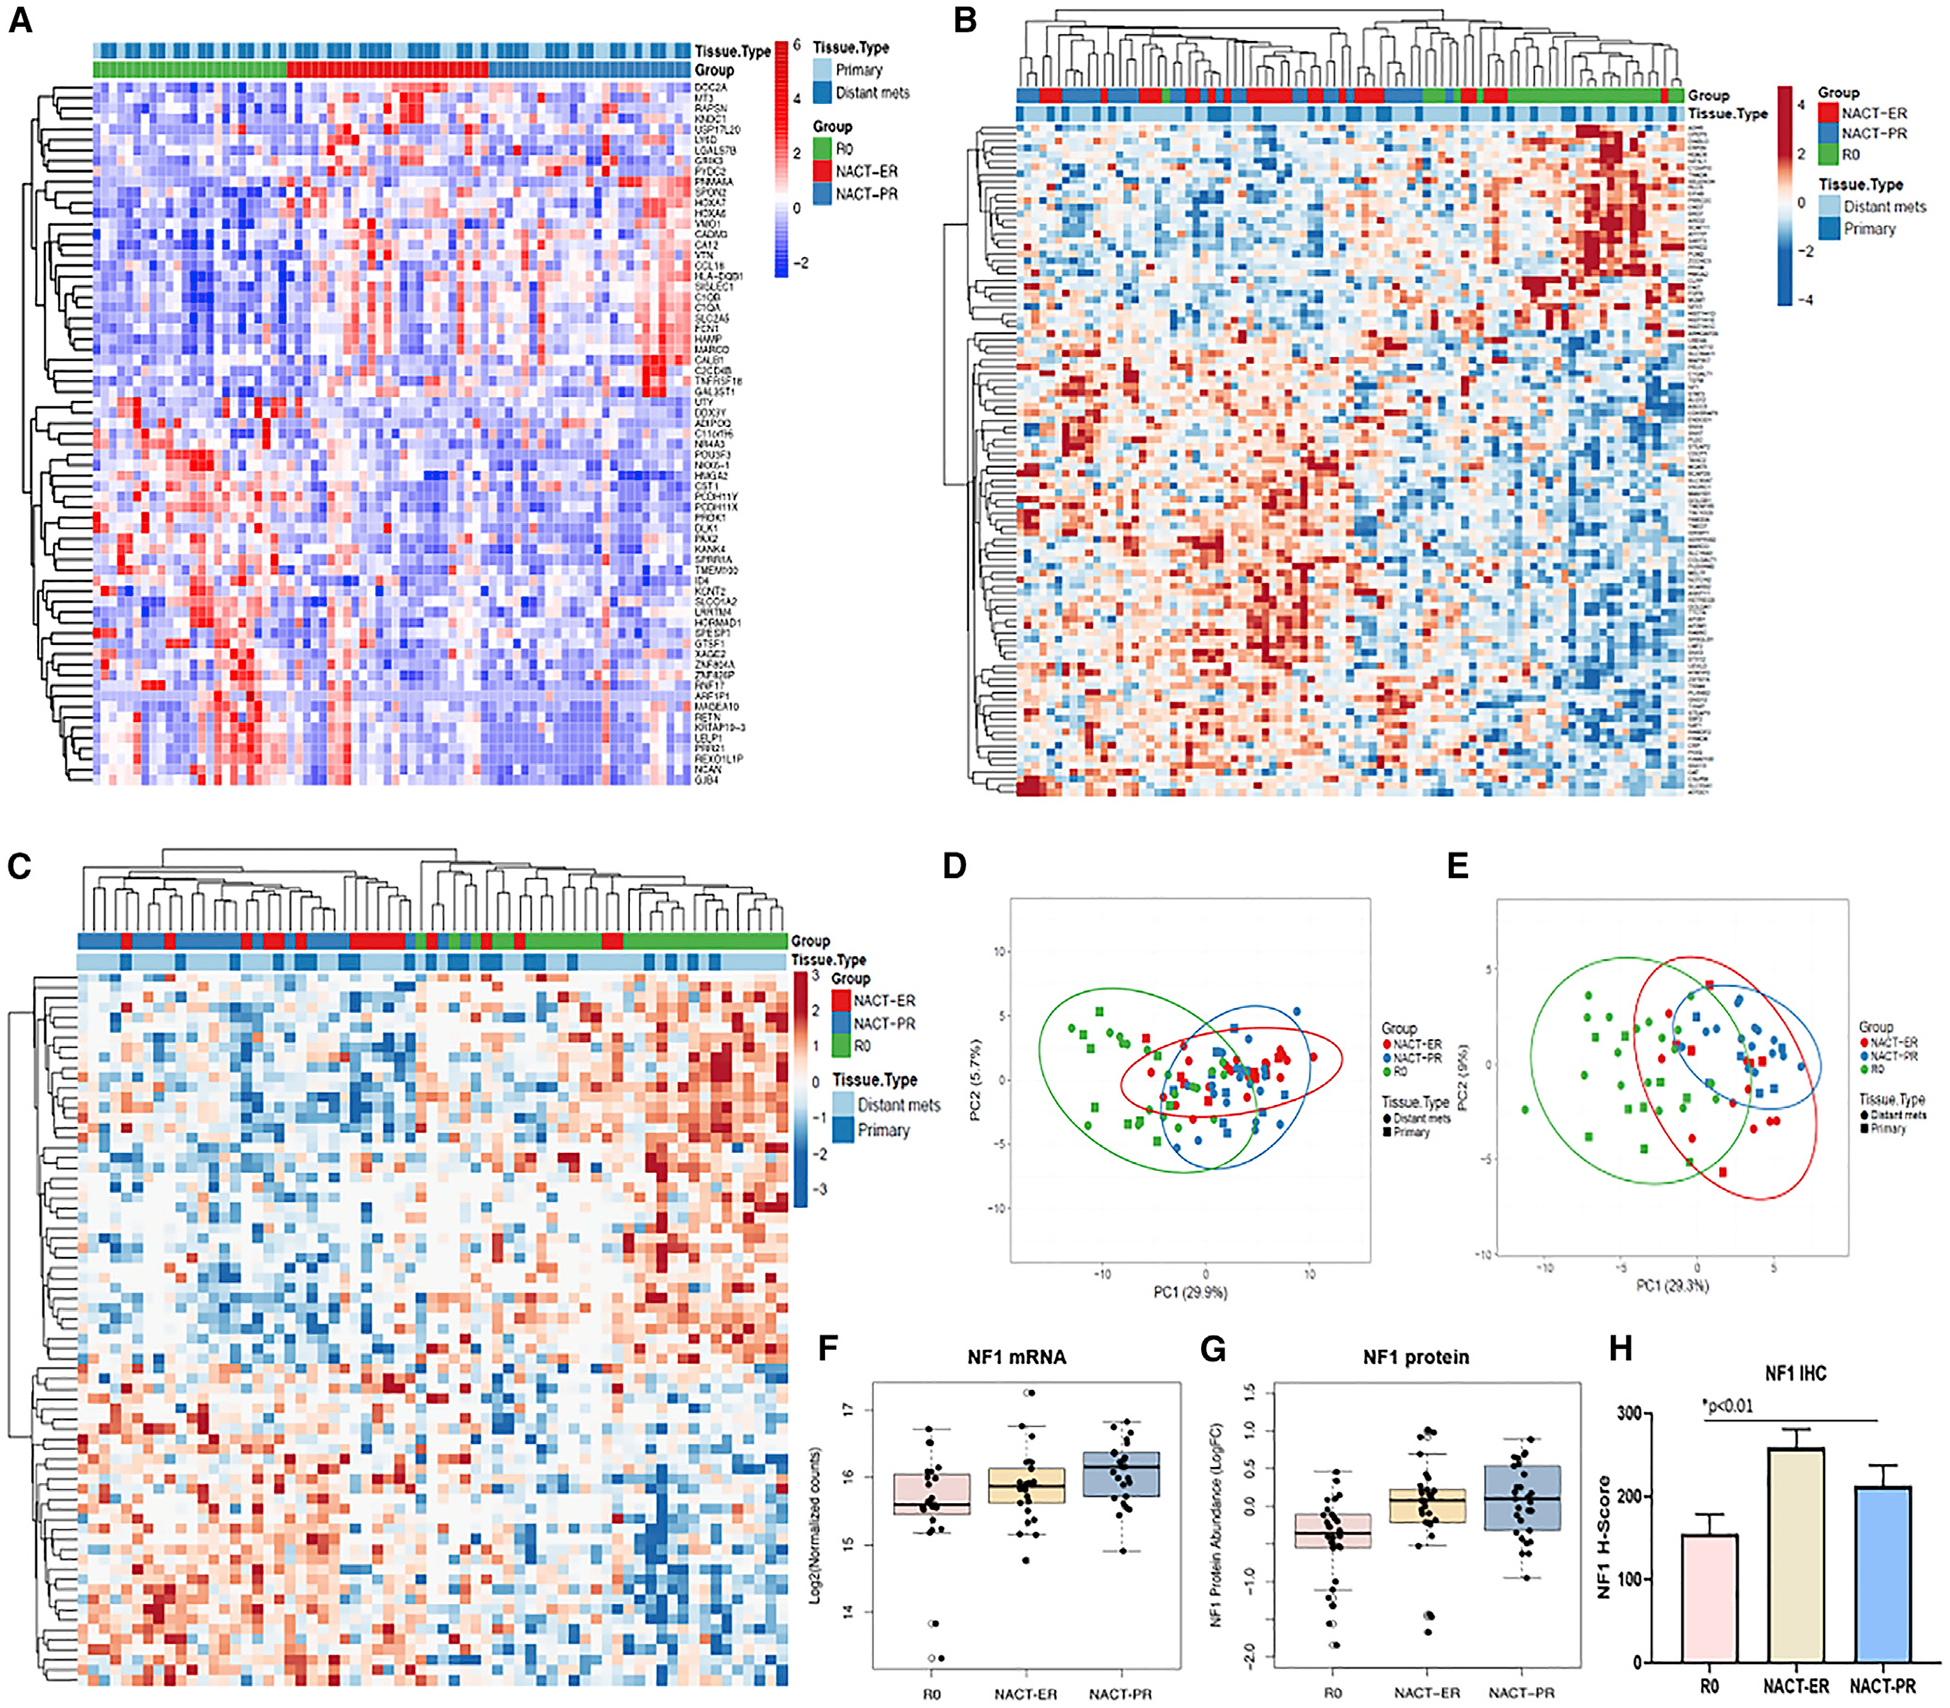
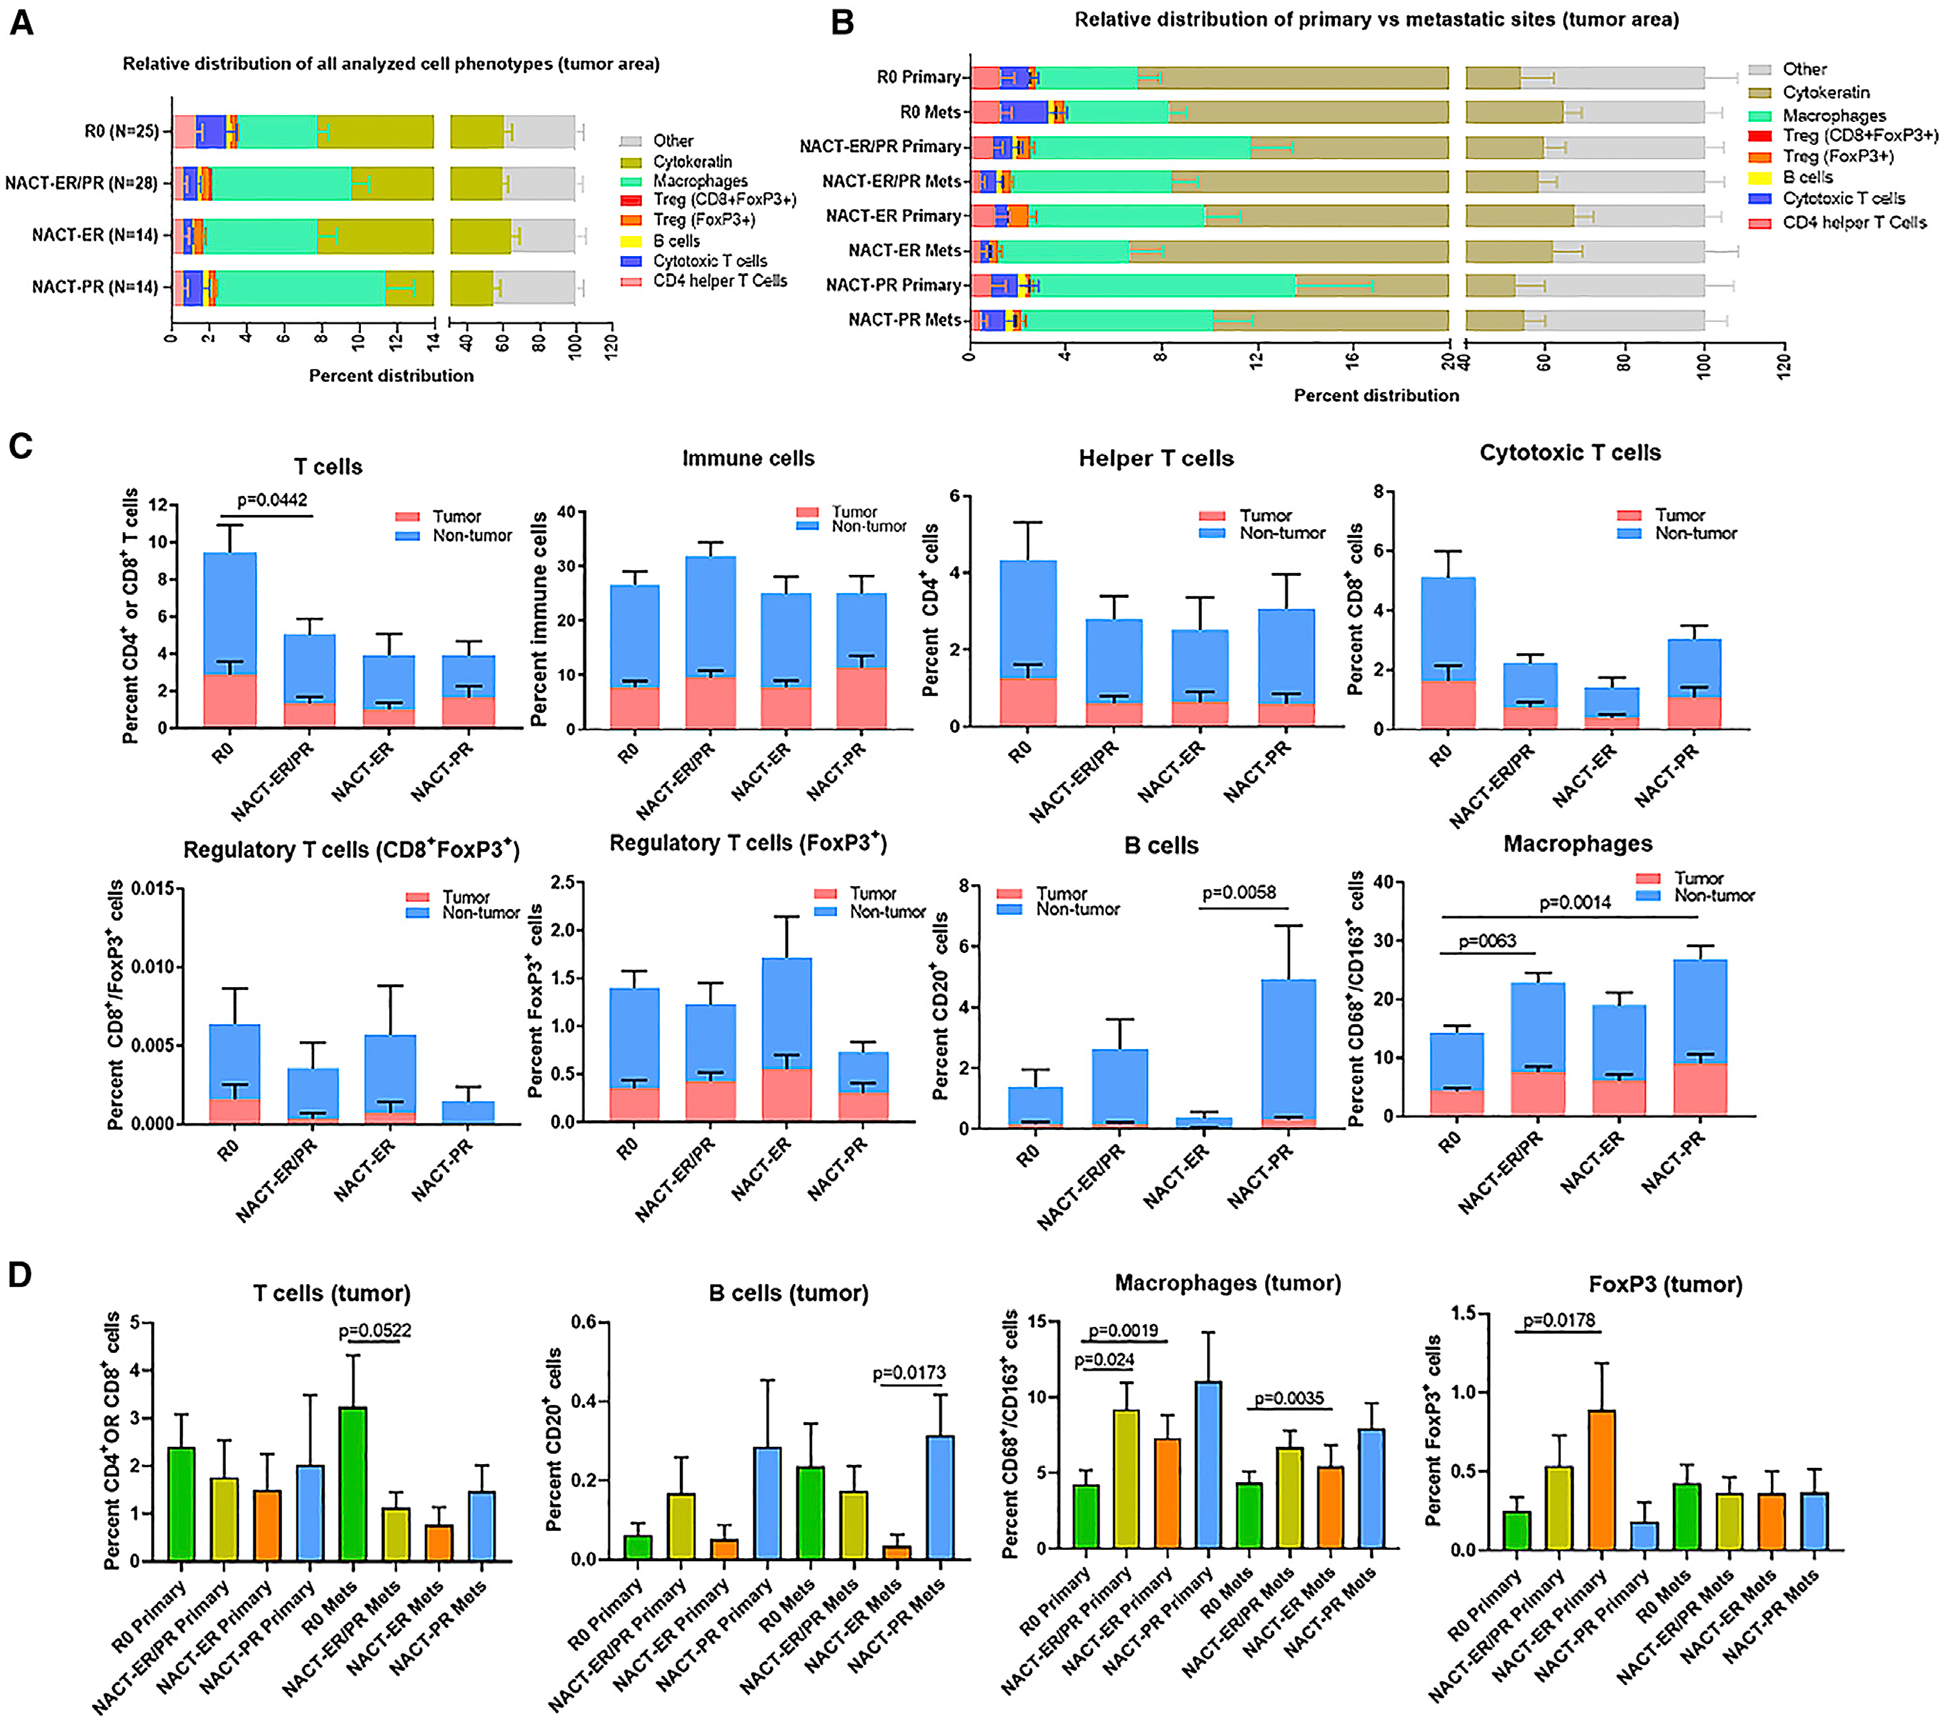
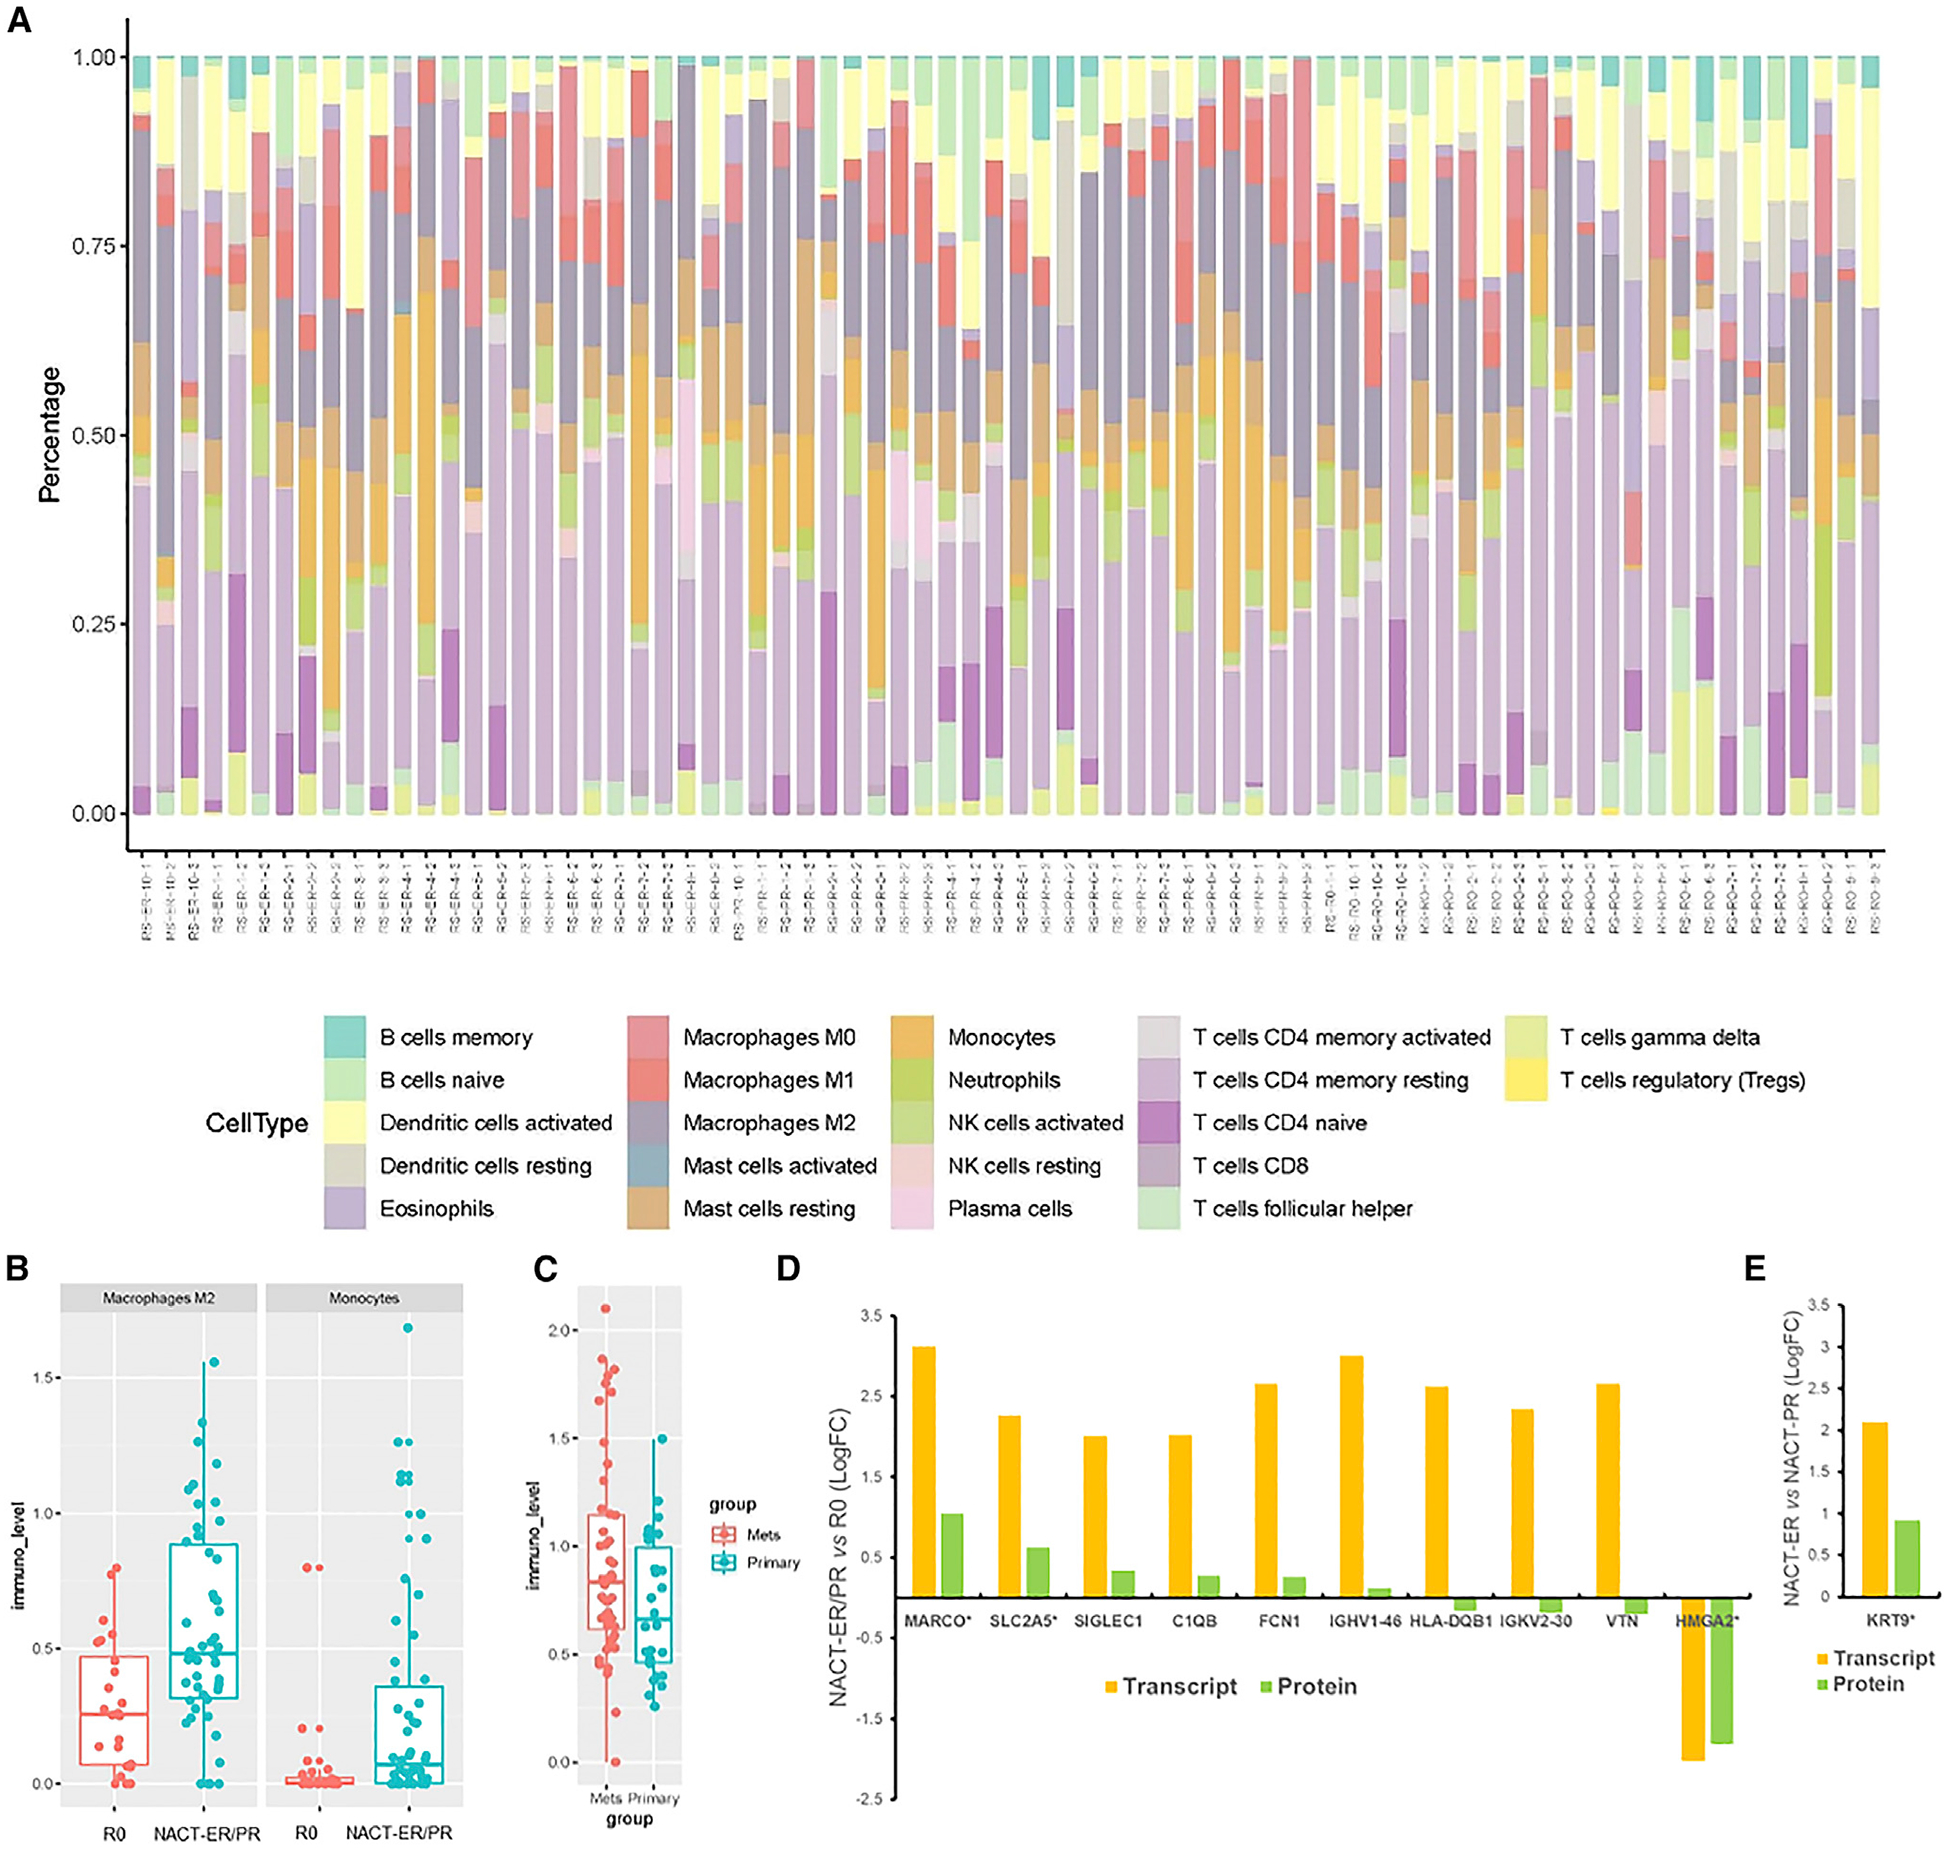
The diversity and heterogeneity within high-grade serous ovarian cancer (HGSC), which is the most lethal gynecologic malignancy, is not well understood. Here, we perform comprehensive multi-platform omics analyses, including integrated analysis, and immune monitoring on primary and metastatic sites from highly clinically annotated HGSC samples based on a laparoscopic triage algorithm from patients who underwent complete gross resection (R0) or received neoadjuvant chemotherapy (NACT) with excellent or poor response. We identify significant distinct molecular abnormalities and cellular changes and immune cell repertoire alterations between the groups, including a higher rate of NF1 copy number loss, and reduced chromothripsis-like patterns, higher levels of strong-binding neoantigens, and a higher number of infiltrated T cells in the R0 versus the NACT groups.

Keywords: R0 resection; copy number; genomics; immune monitoring; multi-omics; mutation; neoadjuvant chemotherapy; ovarian cancer; proteome; transcriptome.


Conflict of interest statement

Declaration of Interests A.A.J. consults with Roche/Genentech, Aravive, and Almac Group; has research funding from AstraZeneca, Pfizer, Bristol-Myers Squibb, Immatics, Iovance Biotherapeutics; honoraria from Gerson Lehrman Group; and travel support from AstraZeneca and MedImmune. K.R., A.D., and D.C. are employees of Akoya Biosciences. N.D.F. consults with Tesaro. S.N.W. has clinical research grants from AstraZeneca, ArQule, Bayer, Clovis Oncology, Cotinga Pharmaceuticals, NCCN, Novartis, Roche/Genentech, and Tesaro and consults with AstraZeneca, Circulogene, Clovis Oncology, Merck, Novartis, Pfizer, Roche/Genentech, Takeda, and Tesaro. R.L.C. has clinical research grants from AstraZeneca, Merck, Clovis Oncology, Genmab, Roche/Genentech, Janssen, V Foundation, and Gateway for Cancer Research and consults with AstraZeneca, Merck, Tesaro, Medivation, Clovis Oncology, Genmab, GamaMabs, Agenus, Regeneron, OncoQuest, OncoSec, Roche/Genentech, and Janssen. G.B.M. consults with AstraZeneca, ImmunoMet, Ionis, Nuevolution, PDX Phamaceuticals, SignalChem, Symphogen, and Tarveda Therapeutics; has stock options with Catena Pharmaceuticals, ImmunoMet, SignalChem, Spindletop Captial, and Tarveda Therapeutics; sponsored research from AstraZeneca, ImmunoMet, Pfizer, NanoString, and Tesaro and travel support from Chrysallis BioTherapeutics; and has licensed technology to NanoString and Myriad Genetics. Y.C.’s spouse owns stock in Celsion. T.P.C. consults with Thermo Fisher Scientific and has research funding from AbbVie. G.L.M. consults with Merck, Kiyatek, Renovia, and Tesaro and has research funding from Merck. A.K.S. consults with Merck and Kiyatec, has research funding from M-Trap, and is a shareholder of Bio-Path Holdings. All other authors declare no competing interests.

Figures

Figure 1.
Figure 1.. Outline of the Study
(A) Flow diagram of the study for tissue procurement in patients with advanced high-grade serous ovarian cancer (HGSC). PIV, predictive index value; TRS, tumor reduction surgery; NACT, neoadjuvant chemotherapy; R0, no residual disease; NACT-ER, excellent response to NACT; NACT-PR, poor response to NACT. (B) The areas of collection of tumor tissues from primary and multiple metastatic sites in patients with HGSC. (C) Multi-omics and downstream analyses were performed using DNA, RNA, proteins, and immune cells from tumor tissues. WGS, whole-genome sequencing; T200, high-depth targeted exome sequencing platform; LC-MS/MS, liquid chromatography-tandem mass spectrometry; RPPA, reverse phase protein array.
Figure 2.
Figure 2.. Somatic Mutations and CNVs Identified in Ovarian Cancer Genes
(A) Oncoplots show the frequency of each type of somatic mutation in ovarian cancer genes for primary and metastatic samples. Each column represents one sample. (B) The frequency of CNVs identified in each ovarian-cancer-related gene. Each column represents one sample. Red represents copy gains, and black represents copy losses. (C) The enriched abnormalities, including somatic mutations and CNVs, in the R0 versus NACT-ER/PR groups with a significant p value of < 0.05 in the group-wise comparison. The y axis represents the proportion of patient samples carrying the mutation in the corresponding genes.
Figure 3.
Figure 3.. CTLPs and Strong-Binding Neoantigens by Patient Group
(A) CTLPs identified in nine different chromosomes in different patient groups. (B) The scatterplot of copy number status changes and the likelihood of CTLP in different patient groups. (C) Left: the number of strong-binding antigens detected in all tumors, including both primary and metastasis samples. Significant differences were observed between the R0 and NACT-ER/PR groups and between the R0 and NACT-PR groups. Middle: the number of strong-binding antigens detected in primary tumors. Significant differences were observed between the R0 and NACT-ER/PR groups and between the R0 and NACT-PR groups. Right: the number of strong-binding antigens detected in distant metastasis tumors. A peptide was identified as a strong binder if the % rank was below 0.5% or binding affinity (IC50) was below 50.
Figure 4.
Figure 4.. DEGs for the Groups, Identified by RNA-Seq, Proteomics, and Phosphoproteomics
(A) Heatmap of 67 DEGs in the R0 compared to NACT-ER and NACT-PR groups. (B) Differential analyses of 7387 total proteins quantified and revealed 101 proteins significantly altered (adj. p < 0.05) among NACT-ER (n = 30), NACT-PR (n = 29), and R0 (n = 28) patients. Heatmap reflects clusters assembled by Euclidean distance and average linkage of significant protein abundance trends. (C) Differential analyses of 12,914 total phosphosites quantified and revealed 71 phosphosites significantly altered (adj. p < 0.05) among NACT-ER (n = 17), NACT-PR (n = 22), and R0 (n = 27) patients. Heatmap reflects clusters assembled by Pearson correlation and average linkage of significant phosphosite abundance trends. (D) Principle component analyses (PCAs) of 101 proteins significantly altered (adj. p < 0.05) among NACT-ER (n = 30), NACT-PR (n = 29), and R0 (n = 28) patients. (E) PCA of 71 phosphosites significantly altered (adj. p < 0.05) among NACT-ER (n = 17), NACT-PR (n = 22), and R0 (n = 27) patients. (F) NF1 RNA expression pattern was consistent with the WGS findings. The boxplot shows the log2 normalized counts of NF1 RNA in the R0, NACT-ER, and NACT-PR groups. The p values were calculated by differential analysis using DESeq2. (G) NF1 protein abundance was significantly elevated in NACT-ER and NACT-PR tumors versus R0 tumors. The boxplot reflects log2-fold change (L2FC) abundance of NF1 protein for the NACT-ER (n = 30), NACT-PR (n = 29), and R0 (n = 28) groups. (H) H-scores of NF1 expression by IHC for the NACT-ER (n = 12), NACT-PR (n = 14), and R0 (n = 24) groups. Statistical significance was determined by unpaired t test. Data are presented as the mean ± SEM.
Figure 5.
Figure 5.. HGSC Immune Infiltration Patterns
(A) Relative distribution of analyzed cell phenotypes in the tumor area across the R0, NACT-ER, and NACT-PR groups. (B) Relative distribution of immune cell populations separated into primary and metastatic tumor sites in each group. (C) Immune subpopulation infiltration patterns in the R0, NACT-ER, and NACT-PR groups. The percentages of immune cells were compared for all T cells, immune cells, helper T cells, cytotoxic T cells, regulatory T cells, macrophages, and B cells. Statistical significance was determined by unpaired t test. Data are presented as the mean ± SEM. (D) Immune subpopulation infiltration patterns in primary and metastatic sites in tumor area only. The percentages of T cells, B cells, macrophages, and FoxP3+ cells in the tumor area were compared for each group.
Figure 6.
Figure 6.. Deconvolution Analysis of Cell Fractions Using RNA-Seq Data and the Concordance of Differentially Expressed Transcripts and Proteins among Groups
(A) The composition of 22 immune cell subsets in each patient sample. The profiling of immune cells was inferred by deconvolution analysis of RNA-seq with the LM22 immune cell gene signature, and the relative percentages of different cell types are shown in the stacked bar plot. (B) Boxplots comparing the cell abundances of M2 macrophages and monocytes in the R0 and NACT-ER/PR groups based on RNA-seq deconvolution analysis. Consistent with the immune infiltrate analysis, the R0 group showed more abundant macrophages than did the NACT group. (C) Boxplot comparing the cell abundances of CD4+ T cells in primary and metastatic sites. (D) The 206 available transcript alterations were compared to proteins quantified and altered between NACT-ER (n = 30)/PR (n = 29) and R0 (n = 28) patients. Bar plot reflects the L2FC protein and transcript abundance trends for 10 co-measured candidates. *Co-significantly altered at the protein and transcript levels in NACT-ER/PR (p < 0.01) versus R0 groups. (E) The 263 available transcript alterations were compared to proteins quantified and altered between NACT-ER (n = 29) and NACT-PR (n = 30) patients. Bar plot reflects the L2FC protein and transcript abundance trends for the KRT9 gene. *Co-significantly altered protein (p < 0.01) between NACT-ER and NACT-PR patients.

References

    1. Abecasis GR, Auton A, Brooks LD, DePristo MA, Durbin RM, Hand-saker RE, Kang HM, Marth GT, and McVean GA; 1000 Genomes Project Consortium (2012). An integrated map of genetic variation from 1,092 human genomes. Nature 491, 56–65. - PMC - PubMed
    1. Allison LH, Bateman NW, Hood BL, Conrads KA, Zhou M, Litzi TJ, Oliver J, Mitchell D, Gist G, Blanton B, et al. (2019). Extensive Intratumor Proteogenomic Heterogeneity Revealed by Multiregion Sampling in a High-Grade Serous Ovarian Tumor Specimen. bioRxiv 10.1101/761155. - DOI
    1. Ansquer Y, Leblanc E, Clough K, Morice P, Dauplat J, Mathevet P, Lhommé C, Scherer C, Tigaud JD, Benchaib M, et al. (2001). Neoadjuvant chemotherapy for unresectable ovarian carcinoma: a French multicenter study. Cancer 91, 2329–2334. - PubMed
    1. Bamford S, Dawson E, Forbes S, Clements J, Pettett R, Dogan A, Flanagan A, Teague J, Futreal PA, Stratton MR, and Wooster R (2004). The COSMIC (Catalogue of Somatic Mutations in Cancer) database and website. Br. J. Cancer 91, 355–358. - PMC - PubMed
    1. Bowtell DD, Böhm S, Ahmed AA, Aspuria PJ, Bast RC Jr., Beral V, Berek JS, Birrer MJ, Blagden S, Bookman MA, et al. (2015). Rethinking ovarian cancer II: reducing mortality from high-grade serous ovarian cancer. Nat. Rev. Cancer 15, 668–679. - PMC - PubMed

Publication types