Comparative Transcriptomics Reveals Distinct Gene Expressions of a Model Ciliated Protozoa Feeding on Bacteria-Free Medium, Digestible, and Digestion-Resistant Bacteria
- PMID: 32295093
- PMCID: PMC7232342
- DOI: 10.3390/microorganisms8040559
Comparative Transcriptomics Reveals Distinct Gene Expressions of a Model Ciliated Protozoa Feeding on Bacteria-Free Medium, Digestible, and Digestion-Resistant Bacteria
Abstract
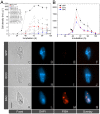
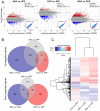
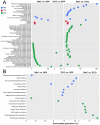
Bacterivory is an important ecological function of protists in natural ecosystems. However, there are diverse bacterial species resistant to protistan digestion, which reduces the carbon flow to higher trophic levels. So far, a molecular biological view of metabolic processes in heterotrophic protists during predation of bacterial preys of different digestibility is still lacking. In this study, we investigated the growth performance a ciliated protozoan Tetrahymena thermophila cultivated in a bacteria-free Super Proteose Peptone (SPP) medium (control), and in the media mixed with either a digestion-resistant bacterial species (DRB) or a digestible strain of E. coli (ECO). We found the protist population grew fastest in the SPP and slowest in the DRB treatment. Fluorescence in situ hybridization confirmed that there were indeed non-digested, viable bacteria in the ciliate cells fed with DRB, but none in other treatments. Comparative analysis of RNA-seq data showed that, relative to the control, 637 and 511 genes in T. thermophila were significantly and differentially expressed in the DRB and ECO treatments, respectively. The protistan expression of lysosomal proteases (especially papain-like cysteine proteinases), GH18 chitinases, and an isocitrate lyase were upregulated in both bacterial treatments. The genes encoding protease, glycosidase and involving glycolysis, TCA and glyoxylate cycles of carbon metabolic processes were higher expressed in the DRB treatment when compared with the ECO. Nevertheless, the genes for glutathione metabolism were more upregulated in the control than those in both bacterial treatments, regardless of the digestibility of the bacteria. The results of this study indicate that not only bacterial food but also digestibility of bacterial taxa modulate multiple metabolic processes in heterotrophic protists, which contribute to a better understanding of protistan bacterivory and bacteria-protists interactions on a molecular basis.
Keywords: Protozoa; RNA-seq; bacterivory; feeding; gene expression; microbial loop.
Conflict of interest statement
The authors declare no conflict of interest.
Figures


Similar articles
-
Protist-Bacteria Associations: Gammaproteobacteria and Alphaproteobacteria Are Prevalent as Digestion-Resistant Bacteria in Ciliated Protozoa.Front Microbiol. 2016 Apr 11;7:498. doi: 10.3389/fmicb.2016.00498. eCollection 2016. Front Microbiol. 2016. PMID: 27148188 Free PMC article.
-
Protistan Bacterivory in an Oligomesotrophic Lake: Importance of Attached Ciliates and Flagellates.Microb Ecol. 1996 May;31(3):249-68. doi: 10.1007/BF00171570. Microb Ecol. 1996. PMID: 8661531
-
Experimental Listeria-Tetrahymena-Amoeba food chain functioning depends on bacterial virulence traits.BMC Ecol. 2019 Nov 22;19(1):47. doi: 10.1186/s12898-019-0265-5. BMC Ecol. 2019. PMID: 31757213 Free PMC article.
-
The Impact of Protozoan Predation on the Pathogenicity of Vibrio cholerae.Front Microbiol. 2020 Jan 21;11:17. doi: 10.3389/fmicb.2020.00017. eCollection 2020. Front Microbiol. 2020. PMID: 32038597 Free PMC article. Review.
-
Significance of predation by protists in aquatic microbial food webs.Antonie Van Leeuwenhoek. 2002 Aug;81(1-4):293-308. doi: 10.1023/a:1020591307260. Antonie Van Leeuwenhoek. 2002. PMID: 12448728 Review.
Cited by
-
In Vitro Antiprotozoal Activity of Hibiscus sabdariffa Extract against a Ciliate Causing High Mortalities in Turbot Aquaculture.Biology (Basel). 2023 Jun 26;12(7):912. doi: 10.3390/biology12070912. Biology (Basel). 2023. PMID: 37508344 Free PMC article.
-
Comprehensive comparative genomics reveals over 50 phyla of free-living and pathogenic bacteria are associated with diverse members of the amoebozoa.Sci Rep. 2021 Apr 13;11(1):8043. doi: 10.1038/s41598-021-87192-0. Sci Rep. 2021. PMID: 33850182 Free PMC article.
-
Functional ecology of planktonic ciliates: Measuring mortality rates in response to starvation.J Eukaryot Microbiol. 2023 Jul-Aug;70(4):e12969. doi: 10.1111/jeu.12969. Epub 2023 Mar 14. J Eukaryot Microbiol. 2023. PMID: 36825816 Free PMC article.
References
-
- Azam F., Fenchel T., Field J.G., Gray J.S., Meyer-Reil L.A., Thingstad F. The ecological role of water-column microbes in the sea. Mar. Ecol. Prog. Ser. 1983;10:257–263. doi: 10.3354/meps010257. - DOI
Grants and funding
- No. 2018SDKJ0406-4/Marine S&T Fund of Shandong Province for Pilot National Laboratory for Marine Science and Technology (Qingdao)
- No. QYZDB-SSW-DQC013-1/Key Research Project of Frontier Science, CAS
- No. 2019216/Youth Innovation Promotion Association, CAS
- Nos. 31672251 and 41976128/Natural Science Foundation of China
LinkOut - more resources
Full Text Sources
Miscellaneous

