

Microaneurysms detection in color fundus images using machine learning based on directional local contrast
- PMID: 32295576
- PMCID: PMC7161183
- DOI: 10.1186/s12938-020-00766-3
Microaneurysms detection in color fundus images using machine learning based on directional local contrast
Abstract
Background: As one of the major complications of diabetes, diabetic retinopathy (DR) is a leading cause of visual impairment and blindness due to delayed diagnosis and intervention. Microaneurysms appear as the earliest symptom of DR. Accurate and reliable detection of microaneurysms in color fundus images has great importance for DR screening.
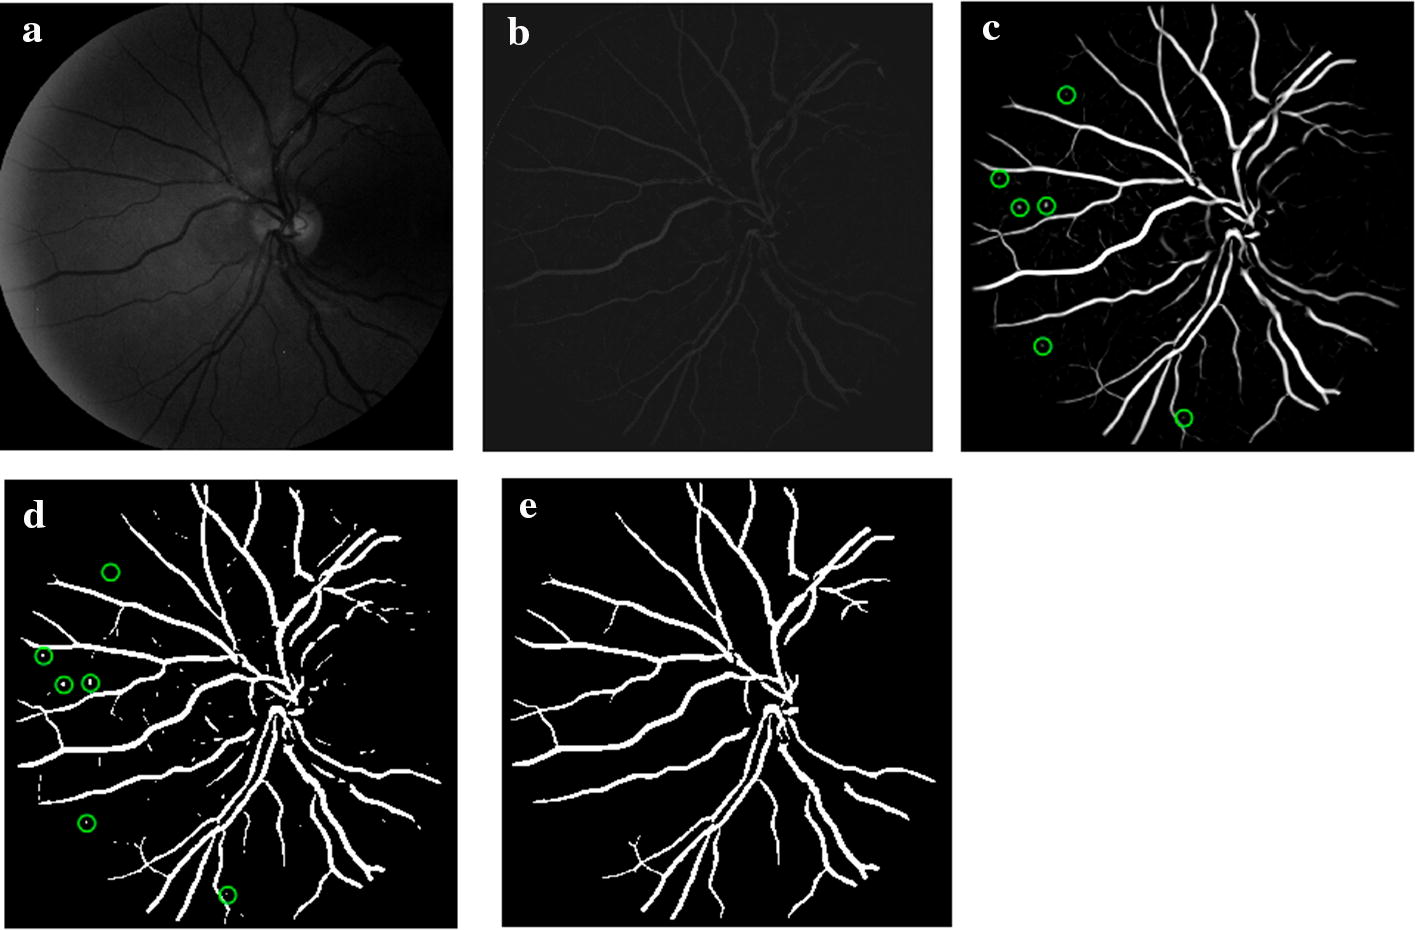
Methods: A microaneurysms' detection method using machine learning based on directional local contrast (DLC) is proposed for the early diagnosis of DR. First, blood vessels were enhanced and segmented using improved enhancement function based on analyzing eigenvalues of Hessian matrix. Next, with blood vessels excluded, microaneurysm candidate regions were obtained using shape characteristics and connected components analysis. After image segmented to patches, the features of each microaneurysm candidate patch were extracted, and each candidate patch was classified into microaneurysm or non-microaneurysm. The main contributions of our study are (1) making use of directional local contrast in microaneurysms' detection for the first time, which does make sense for better microaneurysms' classification. (2) Applying three different machine learning techniques for classification and comparing their performance for microaneurysms' detection. The proposed algorithm was trained and tested on e-ophtha MA database, and further tested on another independent DIARETDB1 database. Results of microaneurysms' detection on the two databases were evaluated on lesion level and compared with existing algorithms.
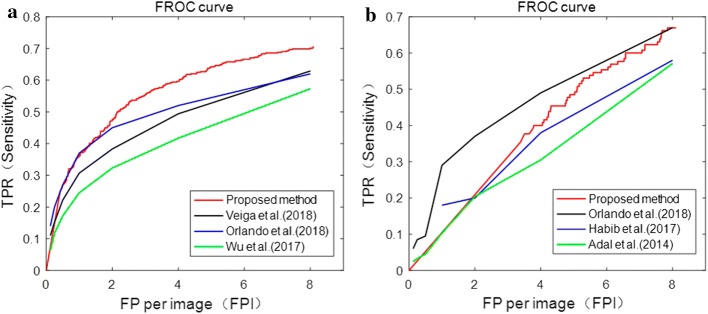
Results: The proposed method has achieved better performance compared with existing algorithms on accuracy and computation time. On e-ophtha MA and DIARETDB1 databases, the area under curve (AUC) of receiver operating characteristic (ROC) curve was 0.87 and 0.86, respectively. The free-response ROC (FROC) score on the two databases was 0.374 and 0.210, respectively. The computation time per image with resolution of 2544×1969, 1400×960 and 1500×1152 is 29 s, 3 s and 2.6 s, respectively.
Conclusions: The proposed method using machine learning based on directional local contrast of image patches can effectively detect microaneurysms in color fundus images and provide an effective scientific basis for early clinical DR diagnosis.
Keywords: Color fundus image; Directional local contrast; Feature extraction; Machine learning; Microaneurysms’ detection; Patch.
Conflict of interest statement
The authors declare that they have no competing interests.
Figures


References
-
- Saeedi P, Petersohn I, Salpea P, Malanda B, Unwin S, Colagiuri S, Guariguata L, Motala AA, Ogurtsova K, et al. Global and regional diabetes prevalence estimates for 2019 and projections for 2030 and 2045: results from the international diabetes federation diabetes atlas. Diabetes Res Clin Pract. 2019;157:107843. doi: 10.1016/j.diabres.2019.107843. - DOI - PubMed
-
- Lyssek-Boroń A, Wylȩgała A, Polanowska K, Krysik K, Dobrowolski D. Longitudinal changes in retinal nerve fiber layer thickness evaluated using Avanti Rtvue-XR optical coherence tomography after 23G vitrectomy for epiretinal membrane in patients with open-angle glaucoma. J Healthcare Eng. 2017;2017(4673714):1–5. doi: 10.1155/2017/4673714. - DOI - PMC - PubMed
MeSH terms
LinkOut - more resources
Full Text Sources
Research Materials
