. 2020 Jun;183(2):501-516.
doi: 10.1104/pp.19.00842. Epub 2020 Apr 15.

Omics Data Reveal Putative Regulators of Einkorn Grain Protein Composition under Sulfur Deficiency

Affiliations

Omics Data Reveal Putative Regulators of Einkorn Grain Protein Composition under Sulfur Deficiency

Titouan Bonnot et al. Plant Physiol. 2020 Jun.

Abstract

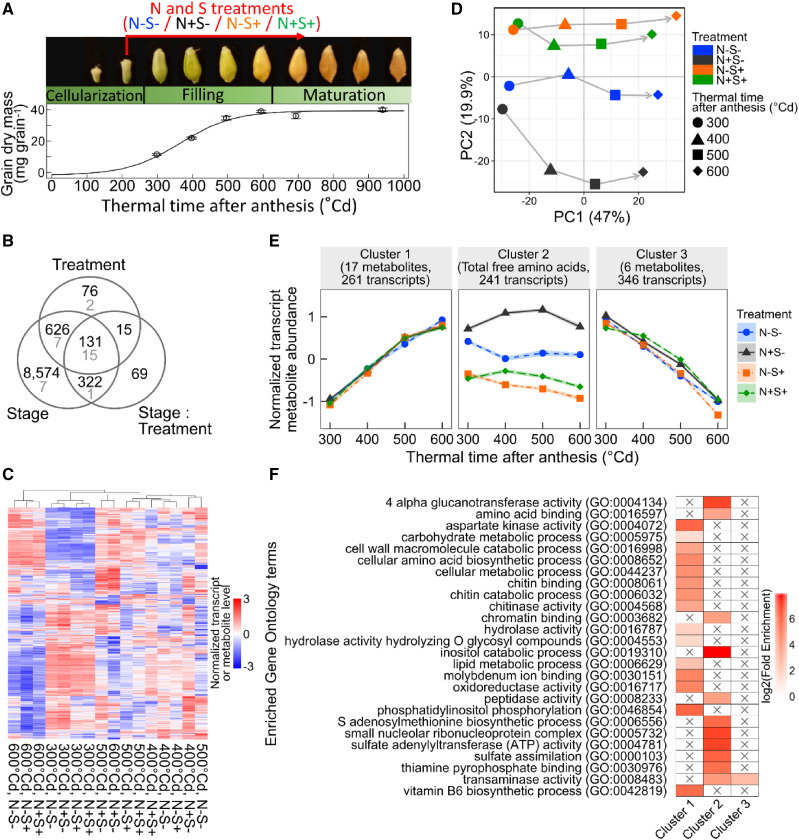
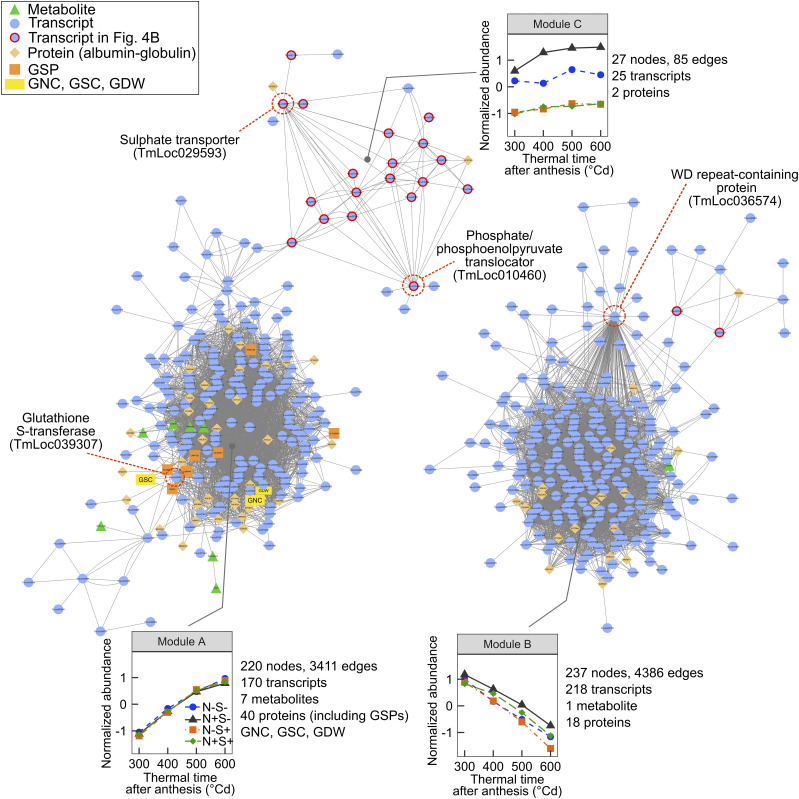
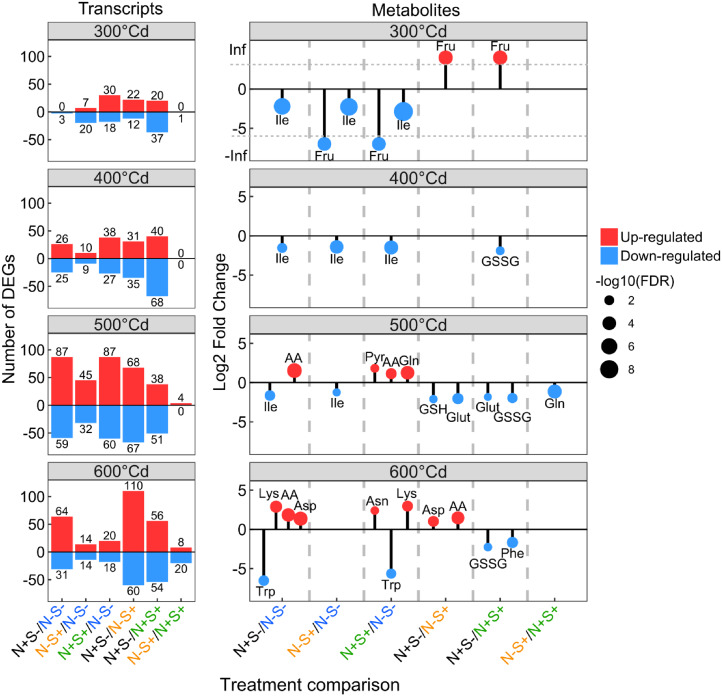
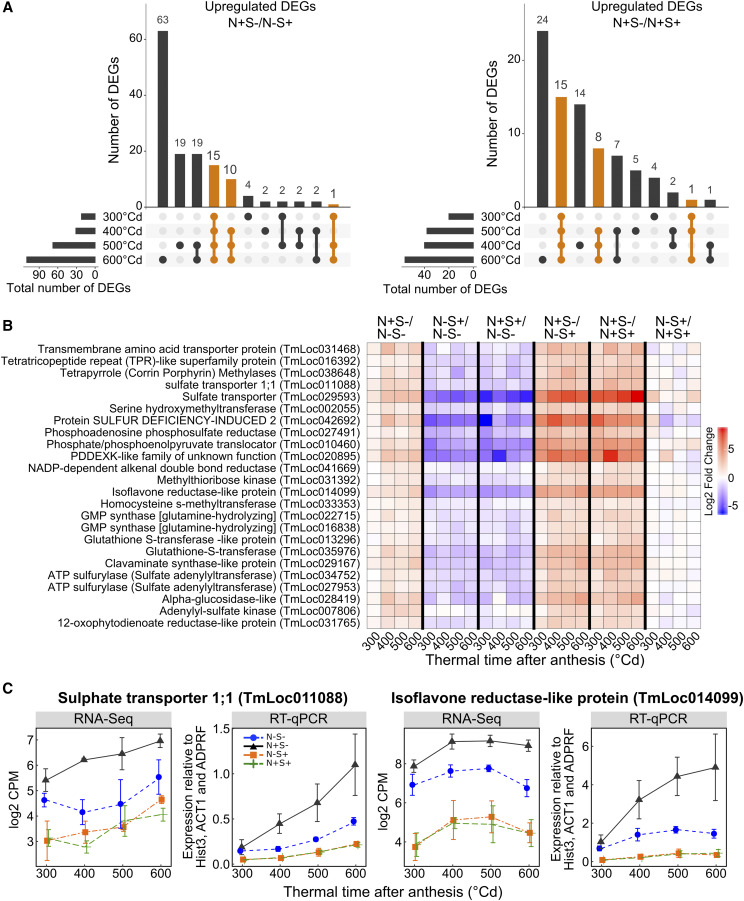
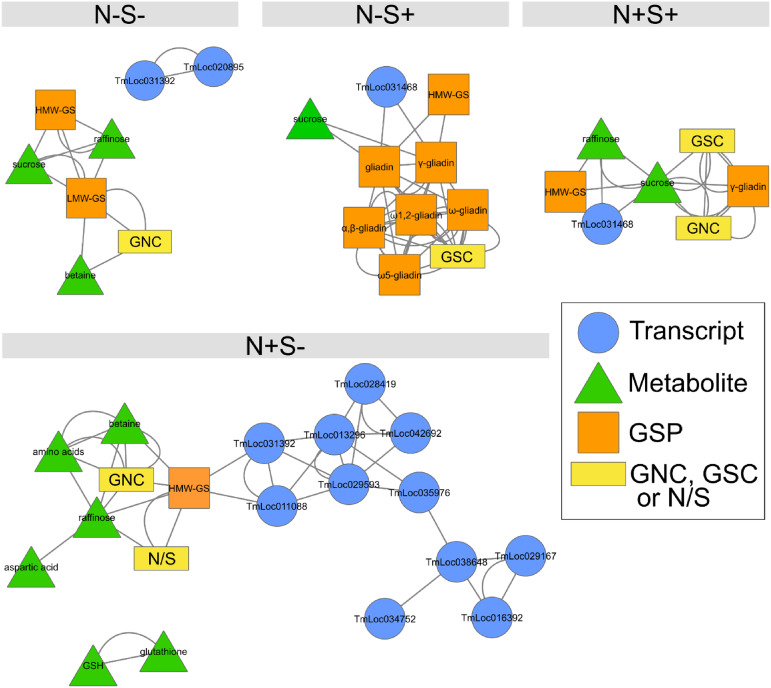
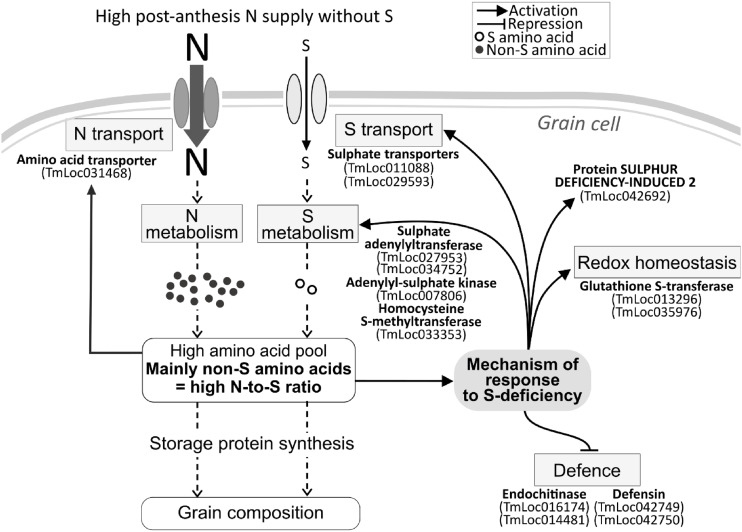
Understanding the molecular mechanisms controlling the accumulation of grain storage proteins in response to nitrogen (N) and sulfur (S) nutrition is essential to improve cereal grain nutritional and functional properties. Here, we studied the grain transcriptome and metabolome responses to postanthesis N and S supply for the diploid wheat einkorn (Triticum monococcum). During grain filling, 848 transcripts and 24 metabolites were differentially accumulated in response to N and S availability. The accumulation of total free amino acids per grain and the expression levels of 241 genes showed significant modifications during most of the grain filling period and were upregulated in response to S deficiency. Among them, 24 transcripts strongly responded to S deficiency and were identified in coexpression network analyses as potential coordinators of the grain response to N and S supply. Sulfate transporters and genes involved in sulfate and Met metabolism were upregulated, suggesting regulation of the pool of free amino acids and of the grain N-to-S ratio. Several genes highlighted in this study might limit the impact of S deficiency on the accumulation of grain storage proteins.


Figures

Figure 1.
Figure 1.
Differential effects of N and S treatments on the grain transcriptome and metabolome. A, Photograph of grains and accumulation of the grain dry mass during the three grain developmental phases. N and S treatments were applied from 200°Cd to 700°Cd after anthesis. B, Venn diagram depicting the overlapping transcripts (black) and metabolites (gray) with a significant (FDR < 0.05) treatment, grain development, and/or treatment × grain development interaction effect. C, Heatmap showing accumulation patterns for the 848 transcripts and 24 metabolites with a significant treatment effect in each N and S treatment and grain developmental stage. D and E, PCA (D) and hierarchical clustering on principal components (E) of the 848 transcripts and 24 metabolites with a significant treatment effect. In C and E, data are scaled (for each variable, the mean was subtracted, and the result was divided by the sd) and are means of n = 3 and 4 independent replicates for transcriptomic and metabolomic data, respectively. In each cluster, lines represent the average abundance of all cluster members in the corresponding treatment, and the shaded area represents the se. F, Enriched Gene Ontology terms in the sets of DEGs, by cluster.
Figure 2.
Figure 2.
Coexpression network of transcripts, metabolites, and proteins impacted by N and S supply during einkorn grain filling. Node shape and color reflect attribute category, as indicated in the key, where the yellow rectangles represent the N and S masses per grain (GNC and GSC, respectively) and dry weight (GDW). Edges between nodes represent coaccumulation links. For each module, the plot shows average abundance of the module nodes versus thermal time after anthesis for the four N and S treatments. Transcripts described in Figure 4B are encircled in red. For each module, examples of transcript nodes described in the manuscript are encircled with a dashed red line and the gene description is indicated.
Figure 3.
Figure 3.
Effects of nitrogen and sulfur on the differentially accumulated transcripts and metabolites by grain developmental stage. On the left, histograms show the number of DEGs, and on the right, lollipop charts represent the LFC of significant metabolites, by treatment comparison and by grain developmental stage. Upregulation and downregulation of transcripts and metabolites was based on a comparison between the first and second treatments and reflect a significant higher (up-regulated) or lower (down-regulated) accumulation in the first compared to the second treatment. In the lollipop charts, dot size represents −log10 of the FDR values. AA, total free amino acids; GSH, reduced glutathione; GSSG, oxidized glutathione; Glut, glutathione; Pyr, pyrroline-5 carboxylate.
Figure 4.
Figure 4.
Identification of sulfur-deficiency-induced genes. A, Unique and overlapping DEGs between grain developmental stages. Bar plots represent the number of DEGs that are unique to a developmental stage or common across different stages. DEGs upregulated in response to N+S− compared to N−S+ and N+S+ are represented on the left and the right, respectively. DEGs common across at least three grain developmental stages are represented in orange. B, Heatmap showing differential expression patterns of the 24 DEGs upregulated in at least three grain developmental stages in response to N+S− compared to both N−S+ and N+S+. The color scale depicts LFC values. C, Transcript levels quantified by RNA-Seq and RT-qPCR for two of the 24 selected DEGs identified in A. Data are means ± sd for n = 3 independent replicates.
Figure 5.
Figure 5.
Effects of N and S treatments on the coaccumulation of GSPs, metabolites, and sulfur-deficiency-responsive transcripts. Data for the 24 transcripts upregulated in response to S deficiency, as highlighted in Figure 4B, the 24 significant metabolites, the mass per grain of N (GNC) and S (GSC), GSPs, and the grain N-to-S ratio (N:S) were used to analyze their coaccumulation by treatment, from 300°Cd to 600°Cd after anthesis. Edges between nodes represent coaccumulation links. GSH, reduced glutathione.
Figure 6.
Figure 6.
Hypothetical mechanism of the grain response to S deficiency. The S-responsive mechanism was caused by an increased N-to-S ratio in the grain cell. Examples of genes involved in this mechanism are indicated in bold. They are part of the 24 genes strongly upregulated (or downregulated in the case of those involved in defense processes) in response to N+S− compared to the two S+ conditions (Fig. 4B; Supplemental Fig. S3B).

References

    1. Aarabi F, Kusajima M, Tohge T, Konishi T, Gigolashvili T, Takamune M, Sasazaki Y, Watanabe M, Nakashita H, Fernie AR, et al. (2016) Sulfur deficiency-induced repressor proteins optimize glucosinolate biosynthesis in plants. Sci Adv 2: e1601087. - PMC - PubMed
    1. Aguirrezábal L, Martre P, Pereyra-Irujo G, Echarte MM, Izquierdo N (2015) Improving grain quality: Ecophysiological and modeling tools to develop management and breeding strategies. In Sadras VO, Calderini DF, eds, Crop Physiology: Applications for Genetic Improvement and Agronomy, Ed 2. Academic Press, Amsterdam, pp 423–465
    1. Allwood JW, De Vos RCH, Moing A, Deborde C, Erban A, Kopka J, Goodacre R, Hall RD (2011) Plant metabolomics and its potential for systems biology research: Background concepts, technology, and methodology. In Jameson D, Verma M, Westerhoff HV, eds, Methods in Systems Biology, Methods in Enzymology, Vol 500. Elsevier, Amsterdam, pp 299–336 - PubMed
    1. Appels R, Eversole K, Stein N, Feuillet C, Keller B, Rogers J, Pozniak CJ, Choulet F, Distelfeld A, Poland J, et al. ; International Wheat Genome Sequencing Consortium I (2018) Shifting the limits in wheat research and breeding using a fully annotated reference genome. Science 361: eaar7191. - PubMed
    1. Banerjee A, Roychoudhury A(2019) Role of glutathione in plant abiotic stress tolerance In Khan NA, Singh S, and Umar S, eds, Sulfur Assimilation and Abiotic Stress in Plants. Springer, Berlin/Heidelberg, pp 207–225

Publication types

MeSH terms