

Improving Quantitative Power in Digital PCR through Digital High-Resolution Melting
- PMID: 32295887
- PMCID: PMC7269394
- DOI: 10.1128/JCM.00325-20
Improving Quantitative Power in Digital PCR through Digital High-Resolution Melting
Abstract
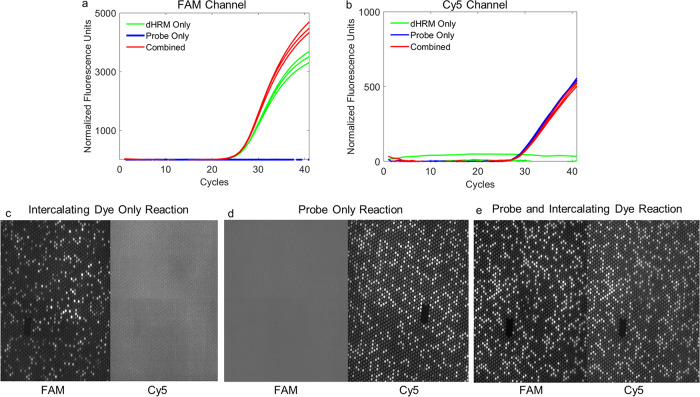
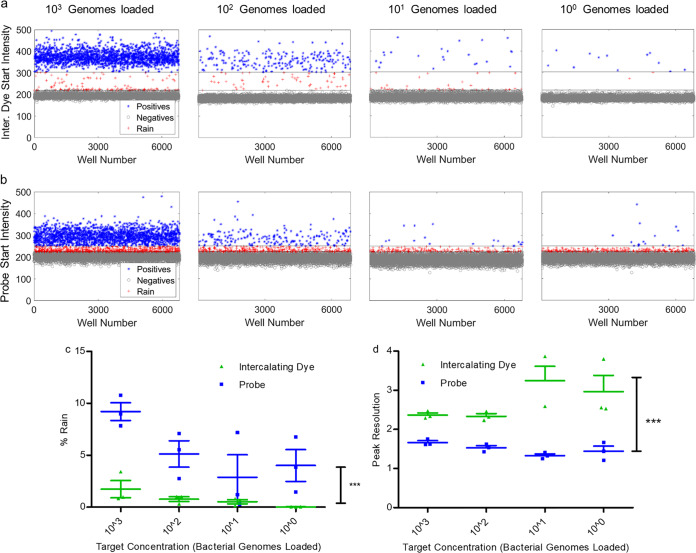
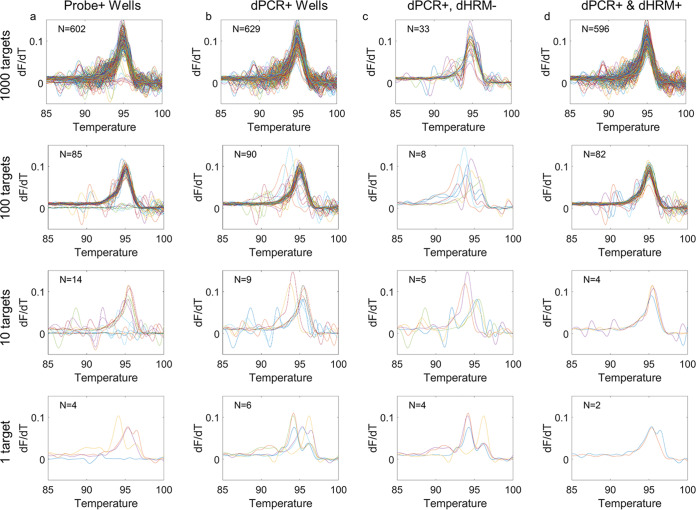
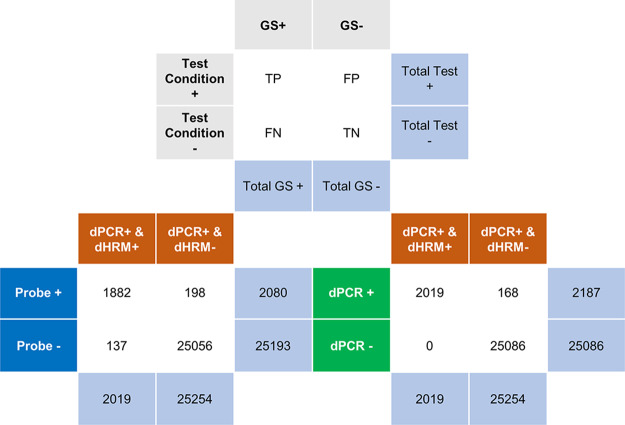
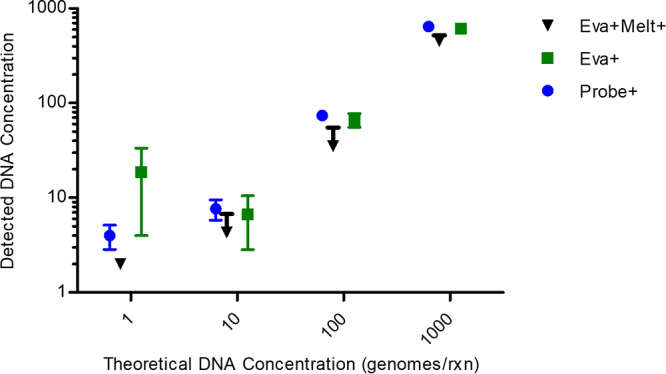
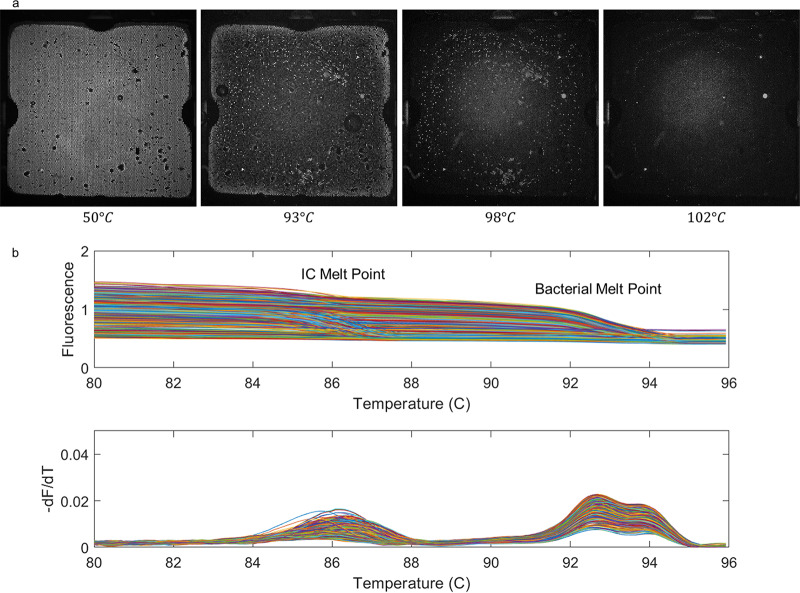
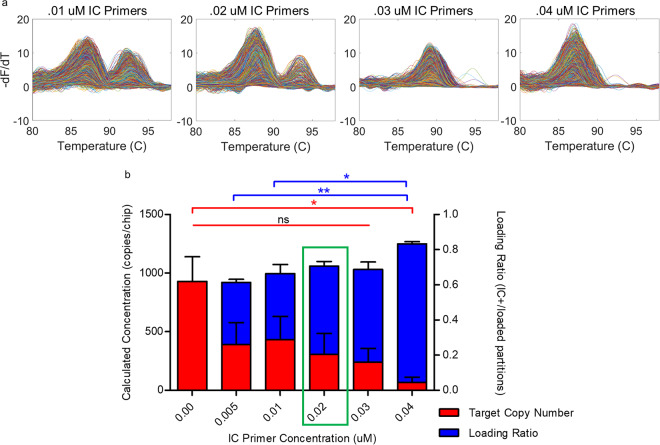
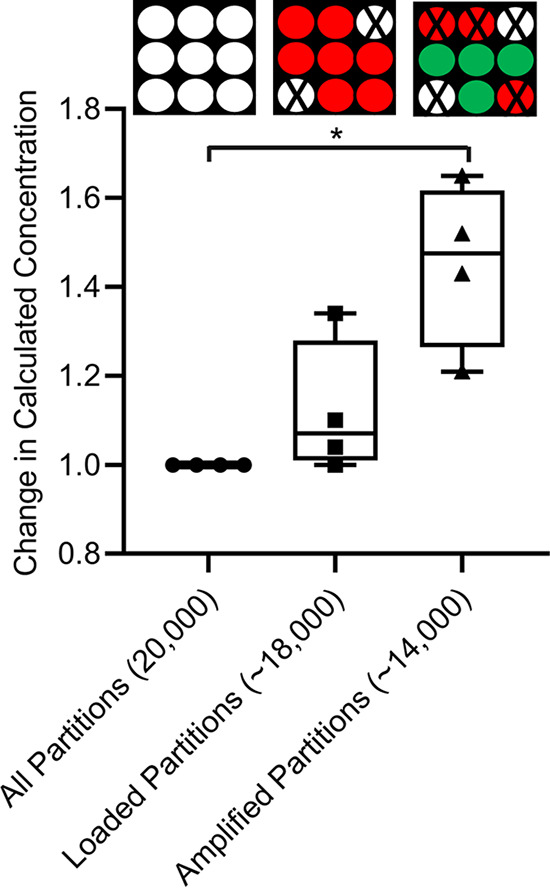
Applying digital PCR (dPCR) technology to challenging clinical and industrial detection tasks has become more prevalent because of its capability for absolute quantification and rare target detection. However, practices learned from quantitative PCR (qPCR) that promote assay robustness and wide-ranging utility are not readily applied in dPCR. These include internal amplification controls to account for false-negative reactions and amplicon high-resolution melt (HRM) analysis to distinguish true positives from false positives. Incorporation of internal amplification controls in dPCR is challenging because of the limited fluorescence channels available on most machines, and the application of HRM analysis is hindered by the separation of heating and imaging functions on most dPCR systems. We use a custom digital HRM platform to assess the utility of HRM-based approaches for mitigation of false positives and false negatives in dPCR. We show that detection of an exogenous internal control using dHRM analysis reduces the inclusion of false-negative partitions, changing the calculated DNA concentration up to 52%. The integration of dHRM analysis enables classification of partitions that would otherwise be considered ambiguous "rain," which accounts for up to ∼3% and ∼10% of partitions in intercalating dye and hydrolysis probe dPCR, respectively. We focused on developing an internal control method that would be compatible with broad-based microbial detection in dPCR-dHRM. Our approach can be applied to a number of DNA detection methods including microbial profiling and may advance the utility of dPCR in clinical applications where accurate quantification is imperative.
Keywords: dPCR; high-resolution melt; internal control.
Copyright © 2020 American Society for Microbiology.
Figures
Similar articles
-
High-Resolution Melting (HRM) analysis of DNA methylation using semiconductor chip-based digital PCR.Genes Genomics. 2024 Aug;46(8):909-915. doi: 10.1007/s13258-024-01527-5. Epub 2024 Jun 8. Genes Genomics. 2024. PMID: 38849705
-
A highly integrated real-time digital PCR device for accurate DNA quantitative analysis.Biosens Bioelectron. 2019 Mar 1;128:151-158. doi: 10.1016/j.bios.2018.12.055. Epub 2019 Jan 11. Biosens Bioelectron. 2019. PMID: 30660930
-
Universal Digital High Resolution Melt for the detection of pulmonary mold infections.bioRxiv [Preprint]. 2023 Nov 9:2023.11.09.566457. doi: 10.1101/2023.11.09.566457. bioRxiv. 2023. Update in: J Clin Microbiol. 2024 Jun 12;62(6):e0147623. doi: 10.1128/jcm.01476-23. PMID: 37986859 Free PMC article. Updated. Preprint.
-
Digital PCR: a new technology for diagnosis of parasitic infections.Clin Microbiol Infect. 2019 Dec;25(12):1510-1516. doi: 10.1016/j.cmi.2019.06.009. Epub 2019 Jun 18. Clin Microbiol Infect. 2019. PMID: 31226445 Review.
-
dPCR: A Technology Review.Sensors (Basel). 2018 Apr 20;18(4):1271. doi: 10.3390/s18041271. Sensors (Basel). 2018. PMID: 29677144 Free PMC article. Review.
Cited by
-
Universal digital high-resolution melting for the detection of pulmonary mold infections.J Clin Microbiol. 2024 Jun 12;62(6):e0147623. doi: 10.1128/jcm.01476-23. Epub 2024 May 2. J Clin Microbiol. 2024. PMID: 38695528 Free PMC article.
-
Universal Digital High-Resolution Melt Analysis for the Diagnosis of Bacteremia.J Mol Diagn. 2024 May;26(5):349-363. doi: 10.1016/j.jmoldx.2024.01.013. Epub 2024 Feb 21. J Mol Diagn. 2024. PMID: 38395408 Free PMC article.
-
Machine learning based DNA melt curve profiling enables automated novel genotype detection.BMC Bioinformatics. 2024 May 10;25(1):185. doi: 10.1186/s12859-024-05747-0. BMC Bioinformatics. 2024. PMID: 38730317 Free PMC article.
-
Streamlined and quantitative detection of chimerism using digital PCR.Sci Rep. 2022 Jun 17;12(1):10223. doi: 10.1038/s41598-022-14467-5. Sci Rep. 2022. PMID: 35715477 Free PMC article.
-
An update on current and novel molecular diagnostics for the diagnosis of invasive fungal infections.Expert Rev Mol Diagn. 2023 Jul-Dec;23(12):1135-1152. doi: 10.1080/14737159.2023.2267977. Epub 2023 Dec 15. Expert Rev Mol Diagn. 2023. PMID: 37801397 Free PMC article. Review.
References
Publication types
MeSH terms
Substances
Grants and funding
LinkOut - more resources
Full Text Sources
Other Literature Sources
Medical
Molecular Biology Databases
