. 2020 Apr 1;5(1):29.
doi: 10.1038/s41392-020-0119-9.

C3G contributes to platelet activation and aggregation by regulating major signaling pathways

Affiliations

C3G contributes to platelet activation and aggregation by regulating major signaling pathways

Sara Gutiérrez-Herrero et al. Signal Transduct Target Ther. .

Abstract

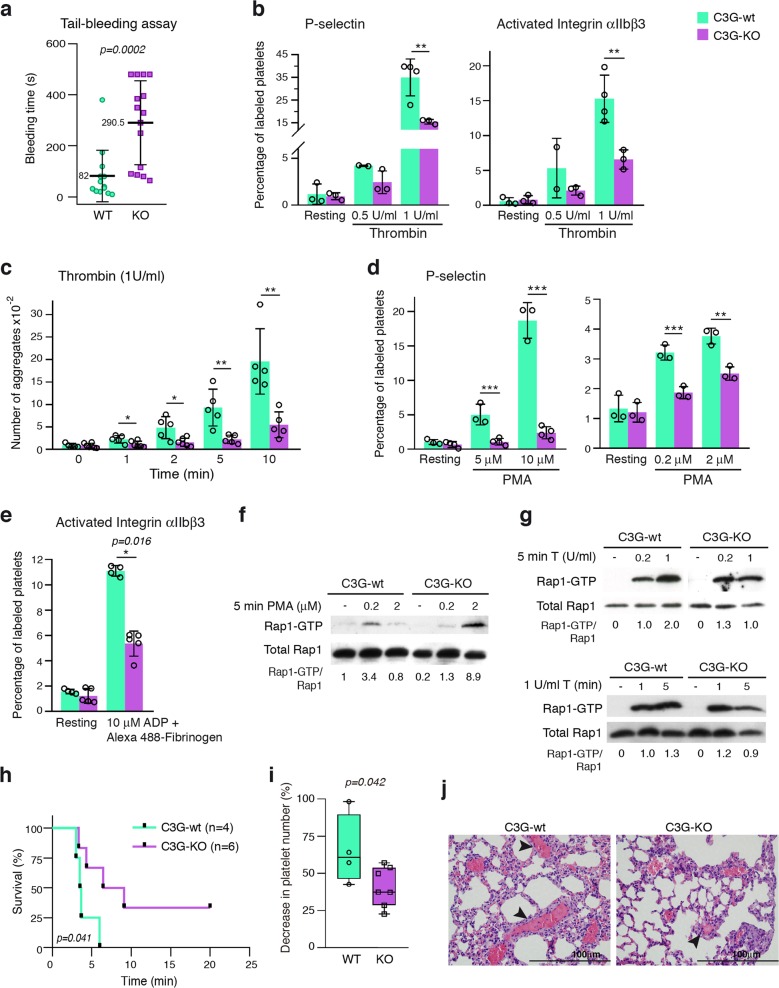
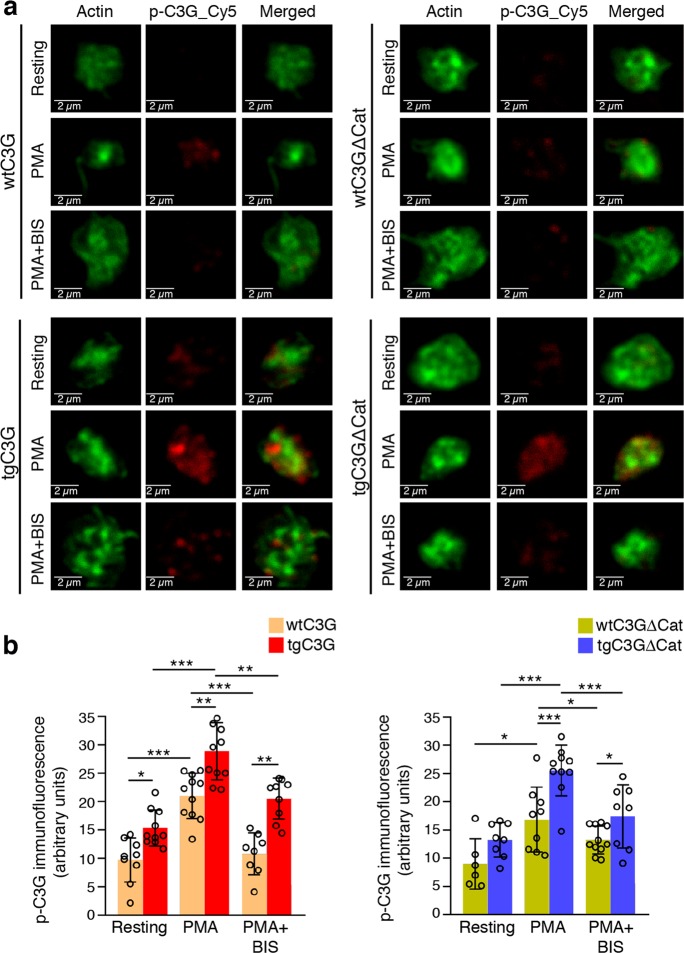
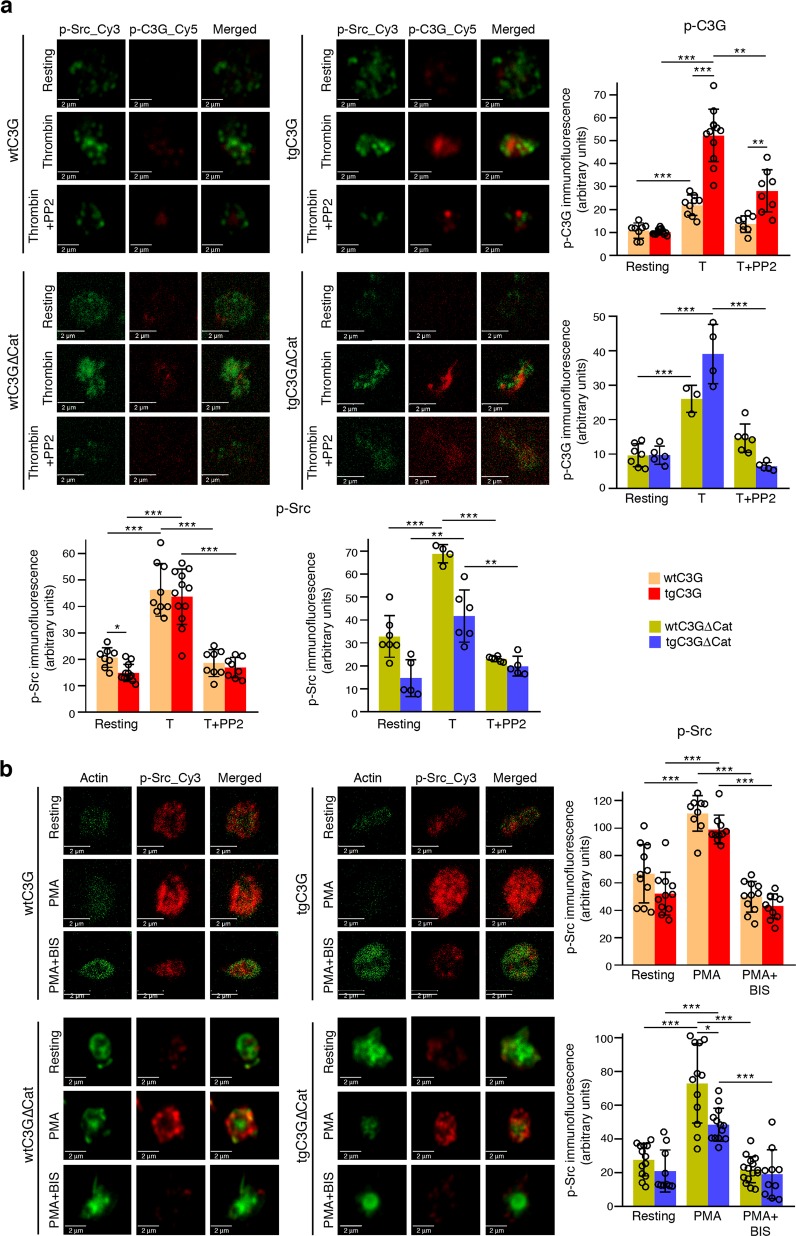
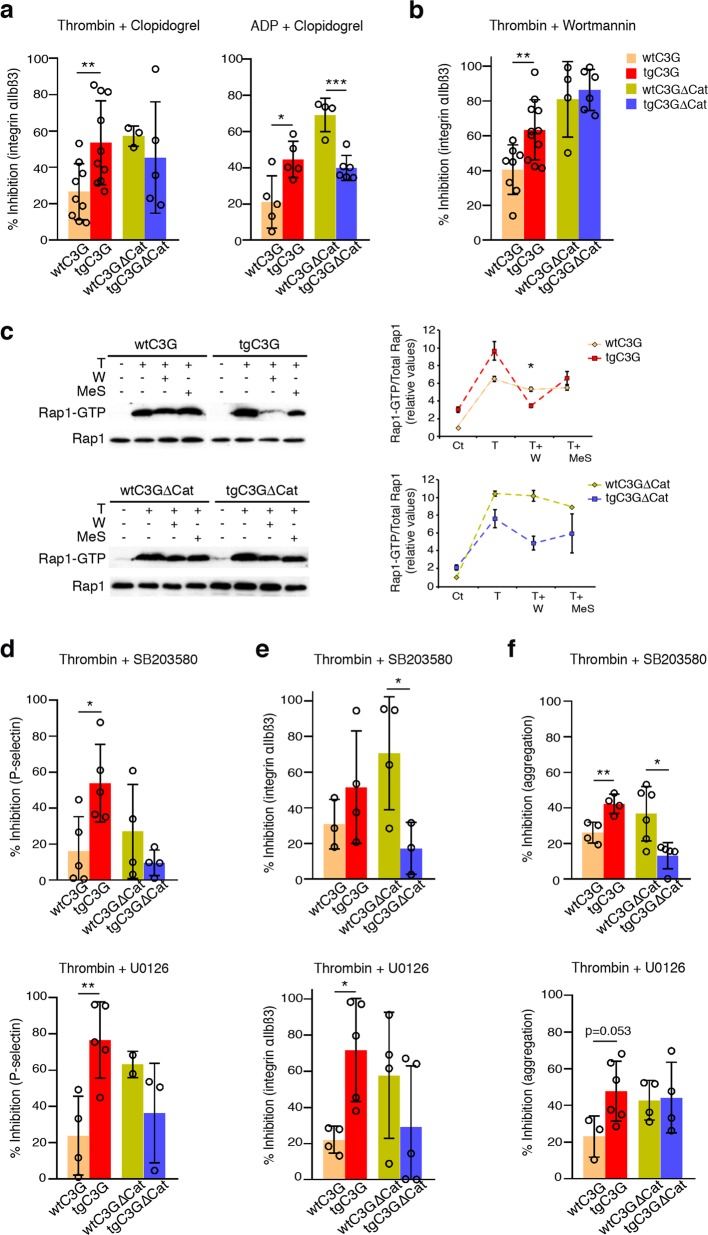
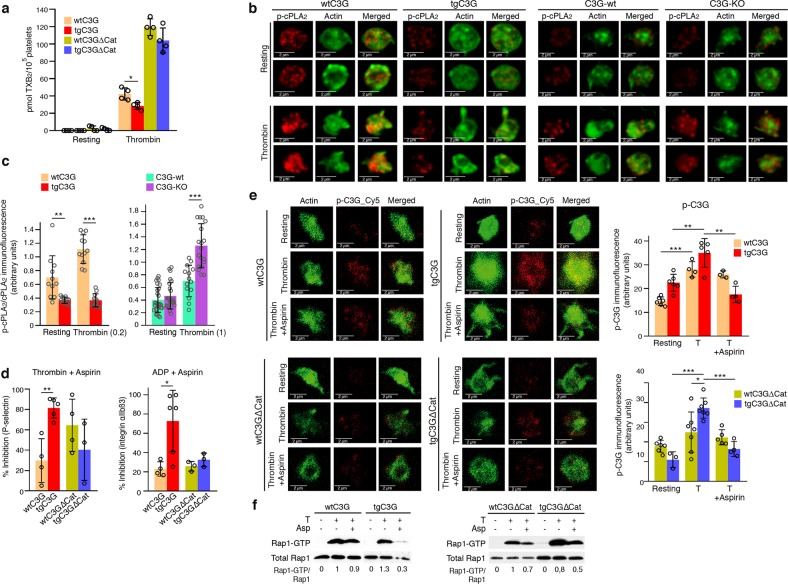
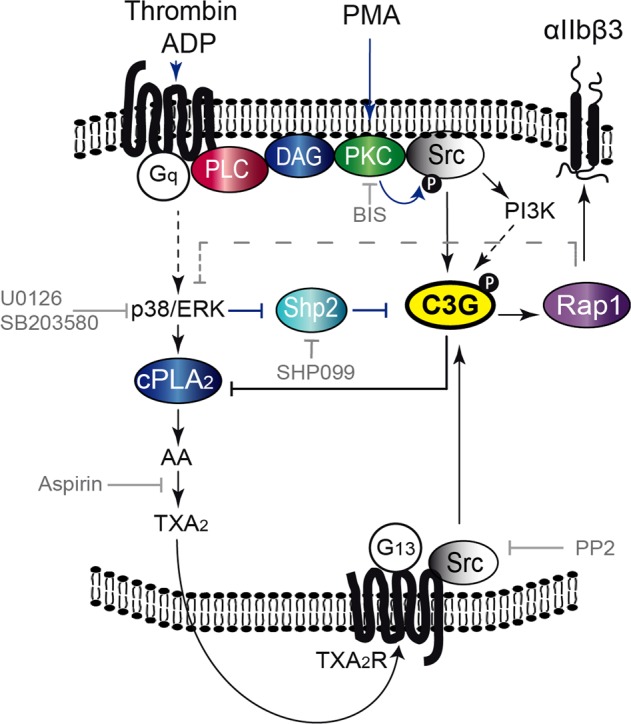
C3G is a GEF (guanine nucleotide exchange factor) for Rap GTPases, among which the isoform Rap1b is an essential protein in platelet biology. Using transgenic mouse models with platelet-specific overexpression of C3G or mutant C3GΔCat, we have unveiled a new function of C3G in regulating the hemostatic function of platelets through its participation in the thrombin-PKC-Rap1b pathway. C3G also plays important roles in angiogenesis, tumor growth, and metastasis through its regulation of the platelet secretome. In addition, C3G contributes to megakaryopoiesis and thrombopoiesis. Here, we used a platelet-specific C3G-KO mouse model to further support the role of C3G in hemostasis. C3G-KO platelets showed a significant delay in platelet activation and aggregation as a consequence of the defective activation of Rap1, which resulted in decreased thrombus formation in vivo. Additionally, we explored the contribution of C3G-Rap1b to platelet signaling pathways triggered by thrombin, PMA or ADP, in the referenced transgenic mouse model, through the use of a battery of specific inhibitors. We found that platelet C3G is phosphorylated at Tyr504 by a mechanism involving PKC-Src. This phosphorylation was shown to be positively regulated by ERKs through their inhibition of the tyrosine phosphatase Shp2. Moreover, C3G participates in the ADP-P2Y12-PI3K-Rap1b pathway and is a mediator of thrombin-TXA2 activities. However, it inhibits the synthesis of TXA2 through cPLA2 regulation. Taken together, our data reveal the critical role of C3G in the main pathways leading to platelet activation and aggregation through the regulation of Rap1b.


Conflict of interest statement

The authors declare no competing interests.

Figures

Fig. 1
Fig. 1. The targeting of C3G in platelets decreases Rap1 activation, resulting in impaired platelet activation and aggregation.
a Tail-bleeding assays were performed in C3G-KO (KO) mice and their wild-type (WT) controls at weaning. The scatter plots represent the bleeding times of 13–15 animals of each genotype. The mean values are shown. The Mann–Whitney U test was performed. b Washed blood from C3G-KO and C3G-wt mice was stimulated with 0.5 U/ml or 1 U/ml thrombin and incubated with anti-CD62P-FITC to determine the percentage of platelets presenting P-selectin on their surface or with JON/A-PE antibody to determine the percentage of platelets in which the integrin αIIbβ3 was activated. The histograms represent the mean ± SD of the percentage of labeled platelets. c Histograms represent the mean ± SD of the number of platelet aggregates formed upon 1 U/ml thrombin stimulation for the indicated time periods. d Washed blood from C3G-KO and C3G-wt mice was stimulated with PMA at the indicated concentrations and incubated with anti-CD62P-FITC. The histograms represent the mean ± SD of the percentage of labeled platelets. e Washed blood from C3G-KO and C3G-wt mice was stimulated with 10 μM ADP in combination with Alexa 488-fibrinogen, and labeled platelets were detected by flow cytometry. The histograms represent the mean ± SD of the percentage of labeled platelets. Platelets from C3G-KO and C3G-wt mice were stimulated with (f) 0.2 or 2 μM PMA for 5 min, (g) 0.2 or 1 U thrombin for 5 min (upper) or 1 U thrombin for 1 or 5 min (lower). The levels of Rap1-GTP were determined by pulldown assay and immunoblotting. Values are relative to the control value (f) or to the value for thrombin in wild-type platelets (g) and were normalized against total Rap1. The Rap1-GTP/Total Rap1 ratio is indicated beneath the blots. h Kaplan–Meier survival plots for mice after the induction of acute pulmonary thromboembolism (i.v. injection of a lethal dose of collagen/norepinephrine). Survival was significantly increased in C3G-KO mice (p = 0.0409, log-rank test). Two of six C3G-KO mice survived the lethal treatment. i The histograms show the percentage of reduction in blood platelets induced by the i.v. injection of a sublethal dose of collagen/norepinephrine. Blood was withdrawn before the injection and 4 min after injection. The Mann–Whitney U test was performed. j Representative H&E staining of lung sections from mice treated with a lethal dose of collagen/norepinephrine. Thrombi (arrowheads) appeared as eosinophilic material with borders, with partial or total affectation of the lumen of the small and medium caliber blood vessels located mainly on the periphery of the pulmonary lobes. Bar: 100 μm. *p < 0.05, **p < 0.01, ***p < 0.001. wt: wild-type; T: thrombin.
Fig. 2
Fig. 2. PKC promotes the phosphorylation of platelet C3G at Tyr504.
tgC3G platelets, tgC3GΔCat platelets and their controls (wtC3G and wtC3GΔCat, respectively) were treated with PMA (2 μM) in the presence or absence of BIS (5 μM) and labeled with anti-pTyr504-C3G_Cy5 (red) and phalloidin (actin, green). a Representative immunofluorescence confocal microscopy images of platelets of each genotype under each treatment condition taken at the same exposure time. Bar: 2 μm. b The histograms represent the mean ± SD of the fluorescence intensity (arbitrary units) of pTyr504-C3G (p-C3G), as quantified by ImageJ. *p < 0.05; **p < 0.01; ***p < 0.001. tg: transgenic; wt: wild-type; BIS: bisindolylmaleimide.
Fig. 3
Fig. 3. The thrombin-PKC pathway engages Src to phosphorylate C3G at Tyr504.
a tgC3G platelets, tgC3GΔCat platelets and their controls (wtC3G and wtC3GΔCat, respectively) were treated with thrombin (0.5 U/ml) in the presence or absence of PP2 (10 μM) and labeled with anti-pTyr418-Src_Cy3 (green) and anti-pTyr504-C3G_Cy5 (red). Upper left: representative immunofluorescence confocal microscopy images of platelets of each genotype under each treatment condition taken at the same exposure time. Bar: 2 μm. Histograms represent the mean ± SD of the fluorescence intensities (arbitrary units) of pTyr504-C3G (p-C3G, upper right panels) and pTyr418-Src (p-Src, lower panels), as quantified by ImageJ. T: thrombin. b tgC3G platelets, tgC3GΔCat platelets and their controls were stimulated with PMA (2 μM) in the presence or absence of BIS (5 μM) and labeled with anti-pTyr418-Src_Cy5 (red) and phalloidin (green). Left: representative immunofluorescence confocal microscopy images of platelets of each genotype under each treatment condition taken at the same exposure time. Bar: 2 μm. Right: histograms represent the mean ± SD of the fluorescence intensity (arbitrary units) of p-Src relative to the phalloidin signal, as quantified by ImageJ. *p < 0.05, **p < 0.01, ***p < 0.001. tg: transgenic; wt: wild-type; BIS: bisindolylmaleimide.
Fig. 4
Fig. 4. TgC3G and tgC3GΔCat platelets show differential sensitivities to inhibition of the P2Y12, PI3K, ERK and p38 MAPK signaling pathways.
a Platelets from mice of the different genotypes under study were pretreated with 100 μM clopidogrel for 5 min and then stimulated for 15 min with 1 U/ml thrombin or 10 μM ADP, as indicated. The histograms represent the mean ± SD of the percentage of inhibition of activated integrin αIIbβ3 in platelets treated with agonist + inhibitor compared to platelets treated with agonist. b Platelets were pretreated with 100 nM wortmannin for 5 min and then stimulated with 1 U/ml thrombin for 15 min. The histograms represent the mean ± SD of the percentage of inhibition of activated integrin αIIbβ3 in platelets treated with agonist + inhibitor compared to platelets treated with agonist. c Platelets were pretreated with 100 nM wortmannin or 50 μM 2-MeSAMP for 5 min and then stimulated with 0.5 U/ml thrombin for 5 min. Rap1-GTP was isolated by pulldown with GST-RalGDS-RBD and detected by immunoblotting with anti-Rap1 antibodies. Left panel: representative western blots. Right panel: line/scatter plots of Rap1-GTP levels (n = 2). Values (mean ± SEM) are relative to those in unstimulated wild-type platelets and were normalized to total Rap1 levels. df Platelets were pretreated with 20 μM U0126 or SB203580 for 5 min and then stimulated with 1 U/ml thrombin (15 min for activation, 10 min for aggregation), as indicated. The histograms represent the mean ± SD of the percentages of inhibition of the expression of P-selectin on the surface (d), activation of integrin αIIbβ3 (e) or aggregation (f) in platelets treated with thrombin + inhibitor, compared to thrombin-treated platelets. *p < 0.05, **p < 0.01, ***p < 0.001. tg: transgenic; wt: wild-type; T: thrombin; W: wortmannin; MeS: 2-MeSAMP.
Fig. 5
Fig. 5. ERKs and p38 MAPKs favor the phosphorylation of C3G at Tyr504.
a Platelets from mice of the different genotypes under study were stimulated for 1 min with thrombin (0.5 U/ml) after 5 min of treatment with U0126 (20 μM) or SB203580 (20 μM) and labeled with anti-pTyr504-C3G_Cy5 (red) and phalloidin (green). Left: representative immunofluorescence confocal microscopy images taken at the same exposure time. Bar: 2 μm. Right: histograms represent the mean ± SD of the fluorescence intensity (arbitrary units) of pTyr504-C3G (p-C3G) relative to the phalloidin signal, as quantified by ImageJ. b tgC3GΔCat platelets and their controls (wtC3GΔCat) were treated as described above in the presence or absence of U0126 and labeled with anti-pTyr504-C3G_Cy5 (red), pTyr418-Src_Cy3 (green) and phalloidin (white). Left: representative immunofluorescence confocal microscopy images taken at the same exposure time. Bar: 2 μm. Right: histograms represent the mean ± SD of the fluorescence intensity (arbitrary units) of pTyr418-Src (p-Src) relative to the phalloidin signal, as quantified by ImageJ. *p < 0.05, **p < 0.01, ***p < 0.001. tg: transgenic; wt: wild-type; T: thrombin; U0: U0126; SB: SB203580.
Fig. 6
Fig. 6. ERKs regulate the activation of C3G by acting through the phosphatase Shp2.
a Representative immunofluorescence confocal microscopy images of tgC3G platelets and their controls under the indicated treatments [rest, thrombin (0.5 U/ml) treatment, thrombin + U0126 (20 μM) treatment, thrombin + SHP099 (20 μM) treatment and thrombin + U0126 + SHP099 treatment] labeled with anti-pTyr504-C3G_Cy5 (red) and phalloidin (green) were taken at the same exposure time. Bar: 2 μm. The histograms represent the mean ± SD of the fluorescence intensity (arbitrary units) of pTyr504-C3G relative to the phalloidin signal, as quantified by ImageJ. b Double immunofluorescence confocal microscopy images showing the subcellular distributions of Shp2 (red) and pTyr504-C3G (green) and an overlay of three representative tgC3G platelets under each stimulation condition [rest, thrombin (0.5 U/ml) treatment, thrombin + U0126 (20 μM) treatment, thrombin + SHP099 (20 μM) treatment and thrombin + U0126 + SHP099 treatment]. All micrographs were taken at the same exposure time. Scale bars: 1 μm. The graph shows the Manders’ colocalization coefficients (mean ± SD) of Shp2 and pTyr504-C3G under the indicated experimental conditions. (c) Platelets from tgC3G and tgC3GΔCat mice and their wild-type controls were pretreated for 5 min at 37 °C with 20 μM U0126 and/or SHP099 and then stimulated with 1 U/ml thrombin for 1 min. Rap1-GTP was isolated by pulldown with GST-RalGDS-RBD and detected by immunoblotting with anti-Rap1 antibodies. Values are relative to the value for thrombin in wild-type platelets and were normalized against total Rap1. The Rap1-GTP/Total Rap1 ratio is indicated beneath the blots. *p < 0.05, ***p < 0.001. tg: transgenic; wt: wild-type; T: thrombin; U0: U0126; SHP: SHP099.
Fig. 7
Fig. 7. C3G participates in the activities of the TXA2 pathway in platelets.
a TgC3G expression negatively regulates the production of TXB2 induced by thrombin. Platelets from mice of the different genotypes under study were stimulated with thrombin (1 U/ml) for 3.5 min at 37 °C while stirring, and secreted TXA2 was determined by detecting its breakdown product, TXB2, by LC/MS/MS. The histograms represent the mean ± SD of the amount of TXB2 (pmol) per 105 platelets. b C3G inhibits cPLA2 phosphorylation. Representative immunofluorescence confocal microscopy images of tgC3G and C3G-KO platelets and their corresponding controls treated with 0.2 U or 1 U/ml thrombin, as indicated, and stained with anti-phospho-cPLA2_Alexa Fluor 568 (red) and phalloidin (green). The images of wtC3G/tgC3G and C3G-wt/C3G-KO platelets correspond to two different experiments, but all images from each experiment were taken at the same exposure time. Bar: 2 μm. c The histograms represent the mean ± SD (n > 10) of the fluorescence intensity (arbitrary units) of phospho-cPLA2 relative to the levels of total cPLA2 (Fig. S7a), as quantified by ImageJ. d tgC3G and tgC3GΔCat platelets showed different sensitivities to the activity of aspirin. Transgenic platelets and their controls were pretreated with 2 mM aspirin for 5 min and then stimulated for 15 min with 1 U/ml thrombin or 10 μM ADP. The histograms represent the mean ± SD of the percentage of inhibition of P-selectin expression on the surface or activation of integrin αIIbβ3 in platelets treated with thrombin + aspirin or ADP + aspirin, compared to agonist-treated platelets. e Left: Representative immunofluorescence confocal microscopy images of platelets of each genotype under each treatment condition (resting, thrombin treatment, thrombin + aspirin treatment) stained with anti-pTyr504-C3G_Cy5 (red) and phalloidin (green) were taken at the same exposure time. Bar: 2 μm. Right: The histograms represent the mean ± SD of the fluorescence intensity (arbitrary units) of pTyr504-C3G (p-C3G) relative to the phalloidin signal, as quantified by ImageJ. f Platelets were pretreated with 2 mM aspirin for 5 min and then stimulated with 0.2 U/ml thrombin for an additional 5 min. Rap1-GTP was isolated by pulldown with GST-RalGDS-RBD and detected by immunoblotting with anti-Rap1 antibodies. Values are relative to the thrombin value in control platelets and were normalized against total Rap1. The Rap1-GTP/Total Rap1 ratio is indicated beneath the blots. *p < 0.05, **p < 0.01, ***p < 0.001. tg: transgenic; wt: wild-type; T: thrombin, Asp: aspirin.
Fig. 8
Fig. 8. Proposed model for the participation of C3G in platelet signaling.
C3G participates in the second wave of Rap1 activation induced by thrombin, which leads to its activation by phosphorylation at Tyr504 through the PKC-Src pathway. C3G phosphorylation is also regulated by ERKs and p38 MAPKs: ERKs inhibit the Shp2 tyrosine phosphatase, allowing C3G phosphorylation, and both MAPKs control the production of TXA2. C3G, via Rap1-dependent and -independent mechanisms, regulates TXA2 synthesis through a negative feedback loop involving the inhibition of cPLA2. PLC: phospholipase C; DAG: diacylglycerol; AA: arachidonic acid; TXA2: thromboxane A2; TXA2R: TXA2 receptor; cPLA2: cytosolic phospholipase A2; BIS: bisindolylmaleimide, an inhibitor of PKC; PP2: a Src inhibitor; wortmannin: a PI3K inhibitor; SHP099: a Shp2 inhibitor; U0126: an ERK inhibitor; SB203580: a p38α/β MAPK inhibitor; aspirin: a cyclooxygenase inhibitor. Dashed gray lines indicate a hypothetical Rap1-dependent pathway that could regulate the activation of ERKs and p38 MAPKs.

References

    1. Stefanini L, Bergmeier W. RAP GTPases and platelet integrin signaling. Platelets. 2018;30:41–47. - PMC - PubMed
    1. Ortiz-Rivero S, et al. C3G, through its GEF activity, induces megakaryocytic differentiation and proplatelet formation. Cell Commun. Signal. 2018;16:101. - PMC - PubMed
    1. Gutiérrez-Herrero S, et al. C3G transgenic mouse models with specific expression in platelets reveal a new role for C3G in platelet clotting through its GEF activity. Biochim. Biophys. Acta Mol. Cell. Res. 2012;1823:1366–1377. - PubMed
    1. Martín-Granado V, et al. C3G promotes a selective release of angiogenic factors from activated mouse platelets to regulate angiogenesis and tumor metastasis. Oncotarget. 2017;8:110994–111011. - PMC - PubMed
    1. Benz PM, et al. Vasodilator-stimulated phosphoprotein (VASP)-dependent and -independent pathways regulate thrombin-induced activation of Rap1b in platelets. Cell Commun. Signal. 2016;14:21. - PMC - PubMed

Publication types

MeSH terms

Substances